Neural network prediction of performance parameters of an inclined plate seed metering mechanism and its reverse mapping for rice
Bạn đang xem bản rút gọn của tài liệu. Xem và tải ngay bản đầy đủ của tài liệu tại đây (574.92 KB, 22 trang )
Int.J.Curr.Microbiol.App.Sci (2018) 7(10): 3494-3515
International Journal of Current Microbiology and Applied Sciences
ISSN: 2319-7706 Volume 7 Number 10 (2018)
Journal homepage:
Original Research Article
/>
Neural Network Prediction of Performance Parameters of an Inclined Plate
Seed Metering Mechanism and its Reverse Mapping for Rice
Manisha Sahu* and Ajay Verma
Department of Farm Machinery and Power Engineering, IGKV University,
Raipur 492012 (Chhattisgarh), India
*Corresponding author
ABSTRACT
Keywords
Neural network
prediction,
Performance,
Inclined plate seed,
Metering
mechanism
Reverse Mapping
for RICE
Article Info
Accepted:
24 September 2018
Available Online:
10 October 2018
India is a predominantly agriculture based economy country. Annual population growth
rate of the country is nearly 1.8 % and if per capita consumption of rice is expected to be
400 gm of rice per day then the demand for rice in 2025 will be 130 m. tones. For
obtaining the high yield with seed planting equipment or planter, it is very essential to drop
the paddy seeds in rows maintaining accurate seed rate and seed spacing with minimum
damage to seeds during metering. This mainly depends on forward speed of the planting
equipment, peripheral speed of metering plate and area of cells on the plate. The
relationship between these factors and the performance parameters viz. seed rate, seed
spacing and percent seed damage can be established using regression analysis. But they
may not be very accurate and may pose to difficulty in the determination of inputs for a set
of desired outputs (reverse mapping). Hence, an attempt has been made in this paper to
develop the feed forward artificial neural network (ANN) models for the prediction of the
performance parameters of an inclined plate seed metering device. The data were
generated in the laboratory by conducting experiments on a sticky belt test stand provided
with a seed metering device and an opto-electronic seed counter. The generated data was
used to develop both statistical and neural network models. The performance of the
developed models was compared among themselves for 4 randomly generated test cases.
The results show that the ANN model predicted the performance parameters of the seed
metering device better than the statistical models. In order to determine the optimum
forward speed of the planter, peripheral speed of the metering plate and the area of cells on
the plate to obtain the recommended seed rate of 104.68 seeds/m2, seed spacing of 100.04
mm and percent seed damage of 0.19% with 100% fill of the cells, a novel technique of
reverse mapping using ANN model was followed. It was observed that the optimum
forward speed of the planting equipment and optimum area of cells on the metering plate
had good correlation with size of seed. Linear regression equations were developed to
predict the optimum forward speed of the planting equipment and optimum area of cells on
the metering plate using the size of seeds as independent parameters. The peripheral speed
of the metering plate of 0.150 m/s was found to be optimum for the size of seeds in the
range of 33.67-41.01 mm2. However the results need to be verified by conducting planting
operation under actual field conditions.
3494
Int.J.Curr.Microbiol.App.Sci (2018) 7(10): 3494-3515
Introduction
Rice is one of the principal commercial crops
in India cultivated in about 44 million-hectare
area.
Sustainable improvement in the livelihoods of
poor farmers in developing countries depends
largely on the adoption of improved, resourceconserving cropping systems. These systems
will often be based on methods involving
direct seeding implements, but adaptation is
usually needed to suit local soils, crops and
conditions. A major constraint to adoption of
improved
resource-conserving
cropping
systems in developing countries is the lack of
simple planting equipment.
Farmers in the rural areas use broadcasting or
transplanting to sow paddy seeds; often times
more than the required numbers of the seed
are dropped in a row and covered. Planting
seeds through this means is labour- intensive
(Bamiro et al, 1986). Timeliness of field
operation in seed planting has been identified
as a major factor increasing the intensity of
cropping (Ojha and Michal, 2012). Hence,
there is a necessity to mechanize seeding
operation. According to Bamgboye and
Mofolasayo (2006), the traditional planting
method is tedious, causing fatigue and
backache due to the longer hours required for
careful hand metering of seeds if crowding or
bunching is to be avoided. In rain fed
conditions the success of crop production
depends on timely seeding. The seed rate for
various dry land crops varies from 4 to 140
kg/ha-1. Availability of a multi crop planter
with replaceable metering plate is crucial to
meet the seed rate requirements and to reduce
the cost involved in machinery management.
Though different types of planters having
different seed metering mechanisms were
evolved, their performance is not up to the
mark.
Seed metering device is a heart of seed sowing
machine which is evaluated for seed distance,
seed size between seed varieties. Seed
metering devices meter the seed from the seed
box and deposit it into the delivery system that
conveys the seed for placement on or in the
seedbed. The major functional requirements of
seed metering systems are to meter the seed at
a predetermined rate/output (e.g. kg/ha-1 or
seeds/meter of row length) meter the seed with
the required accuracy (spacing) to meet the
planting pattern requirements (i.e. drill
seeding, precision drilling, etc); and cause
minimal damage to the seed during the
metering process. The seed sowing machine is
a key component of agriculture field. The
performance of seed sowing device has a
remarkable influence on the cost and yield of
agriculture products.
Under actual field conditio0ns cell may fail to
pick up any seed or cell may pick up and drop
more than one seed at a point or seed may not
emerge from soil due to damage of seed
during metering (Kachman and Smith, 1995;
Singh et al., 2005) thereby leading to variation
in seed spacing, seed rate and plant population
(number of plants/unit area).
In order to achieve the uniformity in seed
spacing and accuracy in seed rate, it is
essential to use the metering plate with size of
cells matching to the size of seeds (Jayan and
Kumar, 2004; Korayem et al., 1986). Further,
size of cell coupled with speed of rotation of
the metering plate significantly affects cell fill
and seed damage (Singh et al., 2005; Barut
and Ozmerzi, 2004; Santos et al., 2003).
Hence, it is essential in a planting equipment
with inclined plate seed metering device to
first select a metering plate of suitable cell size
and operate it at the rotary speed that shall
result in 100% cell fill and minimum seed
damage, and then adjust the forward speed of
the planting equipment to obtain the
recommended seed rate and seed spacing. This
3495
Int.J.Curr.Microbiol.App.Sci (2018) 7(10): 3494-3515
necessitates the development of highly
accurate models for the seed rate, seed spacing
and percent seed damage based on the
independent
design
and
operational
parameters like, size of seed, forward speed of
planting equipment, rotary speed of the
metering plate and size of cell on the plate.
Based on the models, the values of design and
operational parameters for achieving the 100%
fill of the cells along with desired seed rate
and seed spacing can be obtained using
suitable optimization techniques.
In the present work, an attempt is made to
develop soft computing based models such as
feed forward artificial neural network to
model the seed rate, seed spacing and percent
seed damage by the inclined plate metering
device. The statistical regression models might
be able to predict the dependent parameters
accurately. However, these models are
independent in the sense that each response is
determined separately as a function of input
variables. But, in actual practice, all the
responses are measured for a particular set of
input parameters. Hence, it is necessary to
think for an alternative, which will consider all
input parameters and responses as an integral
system. Moreover, determination of set of
input parameters (forward speed of the
planting equipment, rotary speed of the
metering plate and area of cell on the plate)
for a set of desired outputs (seed rate, seed
spacing and percent seed damage at 100% fill
of cells) is an important practical requirement.
Reverse mapping (i.e., to predict the inputs for
a set of desired outputs) might be difficult to
carry out by using response equations obtained
through statistical analysis. As the models are
developed independently, the interdependency
of the output responses might be lost in
statistical models. While it presents no
problem in the development of a model that
maps n sets of possible design and operational
parameters into the same response, a reverse
mapping can only capture one of these n
relations. It is always better to have a number
of solutions for achieving the given desired
target so that one of which is most appropriate
can be chosen for the purpose of a better
operation in the field. It is important to
mention that reverse mapping can be carried
out using the forward mapping models in an
optimization framework and it can be solved
using an optimizer, say a genetic algorithm
(GA). However, it is difficult to obtain the
required information related to the set of
desired output parameters and constraints
quickly, as optimization might be a timeconsuming process. In the present work, an
attempt is made to use the forward mapping
ANN model of the inclined plate seed
metering device in a reverse direction to
generate the optimum values of forward speed
of the planting equipment, rotary speed of the
metering plate and area of cell on the plate for
achieving the desired seed rate and seed
spacing with minimum seed damage and
100% cell fill.
Feed forward artificial neural networks
(ANNs) are currently being used in a variety
of applications with great success. Their first
main advantage is that they do not require a
user-specified problem solving algorithm (as
is the case with classic programming) but
instead they “learn” from examples, much like
human beings. Their second main advantage is
that they possess inherent generalization
ability. This means that they can identify and
respond to patterns that are similar but not
identical to the ones with which they have
been trained. Examples of the modeling of the
performance parameters of agricultural
machinery using artificial neural network are
limited. Hall (1992) developed ANN model to
predict grain breakage, grain dockage,
threshing loss, separator loss and cleaner loss
of a combine harvester for harvesting wheat
crop. Each performance parameter of the
machine was predicted using a neural network
of 15-6-4-1 configuration. He reported that the
3496
Int.J.Curr.Microbiol.App.Sci (2018) 7(10): 3494-3515
ANN model might be adapted to fit local
conditions with the addition of relatively few
cases of training data and in cases where
outliers exist in data, ANN models were less
sensitive than conventional regression
analysis.
The literatures on the use of various
optimization techniques for the determination
of design and operational parameters of
agricultural machinery are available to a
limited extent. In most of the works, power
required for farm operations and size of
implements has been optimized using
optimization techniques like least cost method
(Butani and Singh, 1994; Dash and Sirohi,
2008) and genetic algorithms (Parmer et al.,
1996). Hansson (1995) optimized the
parameters describing the characteristics of a
passive non-linear cab suspension of an
agricultural tractor using an evolution
algorithm. The objective of the optimization
was to minimize the total vibration load on the
driver. Yazgi and Degirmencioglu (2007) used
response surface methodology (RSM) to
determine the optimum levels of vacuum
pressure, diameter of the seed holes and
peripheral speed of the seed plate for the
precision planting of cotton seeds. The
optimum levels of vacuum pressure and the
diameter of holes for precision seeding of
cottonseeds were found to be 5.5 kPa and
3mm, respectively. No optimum value was
obtained
Kushwaha and Zhang, 1998 used the radial
basis function (RBF) network for predicting
draft requirement, energy requirement, final
soil condition and tool wear of an agricultural
tool operating at high speed. The number of
hidden units was determined during the
training of network according to the given
goal error. They found that the ANN model
was able to recognize the output response
related to input patterns that are fuzzy and
have uncertain properties such as soil and tool
types. Al-Janobi et al., (2001) used ANN with
4-24-12-1 configuration to predict the specific
draft of agricultural implements using
different sites, tillage implements, plowing
depths and operating speeds as the input
parameters. They reported the correlation
coefficient and mean squared error of 0.987
and 0.1445, respectively between the
measured and predicted specific draft. Ma et
al., (2006) developed a cutting performance
model of a sugarcane harvester using a 3- 3-1
neural network with driving speed of the
machine, rotational speed and dip angle of
cutting dish as input parameters. The results of
the neural network were compared with that of
fuzzy comprehensive evaluation method for
the new set of input parameters and they
reported that the neural network was able to
extract the similarities and discrepancy among
samples. Here, an attempt is made to explore
the ability of the neural network model. The
present work consists of the following
objectives, which are (i) development of
statistical and feed forward artificial neural
network models for the prediction of
performance parameters of an inclined plate
metering device (ii) determination of optimum
values of design and operational parameters of
the seed metering device for obtaining the
desired values of performance parameters by
using the developed ANN models in a reverse
direction.
Materials and Methods
Data collection
Three distinct and most popular varieties of
paddy (IR-36, HMT and Javaful) grown in
India were selected. Average physical
dimensions of the 100 good quality seeds of
each variety are presented in Table 1. For each
variety, three metering plates of 120 mm
diameter, 5 mm thick with 24 equal sized
oblong rectangular shaped cells were
prepared. Size of cell on each plate was
3497
Int.J.Curr.Microbiol.App.Sci (2018) 7(10): 3494-3515
decided based on the size of the variety of
paddy for which it was prepared (Anantachar
et al., 2010). The half distance of the minor
axis of the cell of one of the plates was chosen
10% more than half breadth of the seed. The
other 2 plates had the half distance of the
minor axis of the cell 1 and 2 mm more than
that of the minor axis of the first plate. The
dimensions of the cell of the metering plate
selected for each variety are presented in
Table 2. A sticky belt test stand along with
seed metering device and opto-electronic seed
counter was used for the performance
evaluation of metering plates. The span and
width of the belt was 5 m and 60 cm,
respectively. The selected metering plate was
fixed in the seed metering device for its
performance evaluation. The drive to the
metering plate was given from a transmission
wheel through a variable speed set of belt and
pulley to vary its speed of rotation. Optoelectronic seed counter was provided in the
seed tube through which seeds picked up by
the metering plate passes and falls on the
sticky belt. Instead of operating the seed
metering device using a 5 hp electric motor at
the linear speed equal to the forward speed of
tractor mounted planting equipment in field.
The linear speed of belt was varied by varying
the velocity ratio between motor shaft and belt
drive shaft.
In India, speed of seed metering by metering
plate of the tractor mounted planting
equipment varies from 6 to 20 seeds/s and
forward speed varies from 2.0 to 5.0 km/h
under actual field conditions (Chauhan et al.,
1999; Sahoo and Srivastava, 2000;
Shrivastava et al., 2003; Kamble et al., 2003).
Keeping these points in mind, four levels of
the peripheral speed of the metering plate viz.,
0.05, 0.11, 0.14 and 0.17 m/s (9-24 rpm) and
three levels of linear speed of the sticky belt
(forward speed of the planting equipment)
viz., 2.0, 3.5 and 5.0 km/h were considered for
the experiment for each of the three metering
plates developed for three varieties of paddy
seed. Experiments were conducted by filling
the uniform sized and good quality seeds in
the hopper such that a constant vertical seed
column of 40 mm is maintained on the seed
metering plate. The selected metering plate
was operated for 50 rotations at the specified
speed. The belt was operated at the selected
linear speed to a distance of 4 m to collect the
seed falling from the metering device. The
reading shown by the seed counter was noted
down at the end of each run considering the
appropriate correction factor for the efficiency
of seed count by the seed counter. The
distance between the seeds collected on the
belt was measured using a scale. The actual
seed rate and seed damage were determined as
follows:
(1)
(2)
Where, SR refers to the seed rate in number of
seeds/m2, SC refers to the seed counter
reading after appropriate correction factor, N
refers to the rotary speed of the metering plate
in m/s, V refers to the linear speed of the
sticky belt in km/h, SD refers to percent seed
damage, Wd refers to the weight of visible
damaged seeds and Wt refers to the total
weight of seeds metered. The constant value
of 3.534 in Eq. (1) was calculated based on
row spacing of 20 cm.
The most common row spacing and seed
spacing recommended for the paddy varieties
is 10 and 10 cm, respectively (Bhowmik et al.,
2012). For each combination of independent
variables, three observations were made to
minimize the error of variation and the
average value was considered. Thus, a set of
36 data were collected for each variety of
paddy seed and they are presented in Figures
2, 3 and 4. Figure 3 indicates that the seed rate
increased with increase in peripheral speed of
3498
Int.J.Curr.Microbiol.App.Sci (2018) 7(10): 3494-3515
the metering plate and increase in cell area on
the plate. The seed spacing decreased with
increase in peripheral speed of the metering
plate and increase in cell area on the plate.
Increase in the forward speed of the planting
equipment, decreased the seed rate and
increased the seed spacing. The percent seed
damage increased with increase in the
peripheral speed of the metering plate (Fig. 4).
The percent seed damage was higher for the
metering plate of larger cell area than that of
the metering plate of smaller cell area.
Maximum percent seed damage was found to
be 0.33%. This is less than the maximum
allowable seed damage (0.5%) in a seed
metering device of the seed drill and planter
(RNAM, 1995). These sets of data were used
for training the neural network. Again, a set of
8 data were generated for each variety of
paddy seed by varying the speed of rotation of
metering plate and forward speed. The first
and second sets of 4 data were used for the
validation and testing of the network,
respectively. Table 3 shows response-wise
mean and standard deviation (S.D.) values of
the training, validation and test cases
considered in the present study.
Development of statistical and neural
network models for the performance
parameters of inclined plate seed metering
device
Development of statistical models
The purpose of modeling performance
parameters of inclined plate seed metering
device is to establish its input (forward speed
of planting equipment, peripheral speed of
metering plate and cell area on the plate)
output (seed rate, seed spacing and percent
seed damage) relationships.
The statistical models were developed for each
performance parameter of the metering device
using SPSS 10.0 software for Windows (SPSS
South Asia). Linear regression equation was
developed for each performance parameter by
stepwise regression method. The software
developed the following type of equation for
the seed rate (number of seeds/m2) and seed
spacing (mm):
(3)
where, Y1 is the dependent parameter (seed
rate in no. of seeds/m2 or seed spacing in mm).
For the percent seed damage, the software
developed the following linear model:
(4)
where, Y2 is the percent seed damage (%). V
represents
forward
velocity
(km/h).N
represents speed of rotation of the metering
plate (m/s) and A represents cell area (mm2).
ao and bo are the constants and a1, a2, a3, b1, b2
are the regression coefficients.
Development of neural network models
Feed forward artificial neural network model
was developed for each variety of paddy seed
for modeling the performance parameters. In
the present work, neural network is assumed
to be consisting of three or four layers of
neurons, i.e., one input layer, one or two
hidden layers and one output layer. Many
researchers (Hornik, 1993; Bishop, 1995;
Ripley, 1996; Benardos and Vosniakos, 2007)
have reported that one hidden layer with an
arbitrarily large number of neurons is
sufficient for the pattern recognition.
Maximum two hidden layers are considered in
the present study for the better approximation
of the output parameters. Three neurons were
considered in both input and output layers to
represent the three input parameters and
responses. The optimal number of hidden
layers and neurons in each of them were
obtained through genetic algorithm (GA) as
single objective constrained optimization
problem. A neural network of 3-4-2-3
3499
Int.J.Curr.Microbiol.App.Sci (2018) 7(10): 3494-3515
configuration was found to be most suitable
for variety-1. For the variety-2 and -3, neural
network of 3-3-3 and 3-4-3 configuration,
respectively was found to be most optimum.
The input data used in the network training,
validation and testing processes were
normalized between -1 and +1 using the
following expression:
Similarly, the output data were normalized
between 0 and 1 using the following
expression:
where, Xnorm is the normalized value of a
variable, X indicates the value before
normalization, Xmin and Xmax are the minimum
and maximum values of the variable,
respectively. Due to the availability of a
powerful training algorithm called back
propagation, multilayer feed forward neural
networks are most popular for modeling
applications. A multilayer neural network with
four layers (one input layer, two hidden layers,
and one output layer) used for modeling
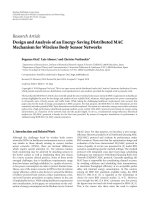
purposes is shown in Fig. 1. Referring to the
notation in Fig. 1, X = (x1, . . ., xi, . . ., xm) is
the input vector, G= (g1, . . ., gi, . . ., gn), H=
(h1, . . ., hk, . . ., hp), and Y = (y1, . . ., yl, . . .,
yq) are the outputs of the first hidden layer,
second hidden layer, and output layer,
respectively, uij is the weight of the synaptic
joint between the ith input and the jth neuron
in the first hidden layer, vjk is the weight of the
synaptic joint between the jth neuron in the
first hidden layer and the kth neuron in the
second hidden layer, and wkl is the weight of
the synaptic joint between the kth neuron in
the second hidden layer and the lth neuron in
the output layer. The bias value of the neurons
in the first hidden layer, second hidden layer
and output layer is given by [B11, . . ., B1j, . . .,
B1n], [B21, . . ., B2k, . . ., B2p], [Bo1, . . ., Bol, . .
., Boq], respectively. The output of the neural
network can be computed as
where,
is the weighted total input to the
output neuron 1, which is defined as
and p is the number of neurons in the second
hidden layer. Similarly, the output of the
second hidden layer H can be expressed as a
function of the output of the first hidden layer
G, which can, in turn, be expressed as a
function of the input vector X. The back
propagation training algorithm aims to adjust
the weights and bias values of a feed forward
neural network in order to minimize the sumsquared error of the network, which is defined
as
(9)
where S is the number of training data points,
q is then number of output variables, and dm =
[dm1 dm2 . . . dmq] and ym = [ym1 ym2 . . . ymq]
are the mth desired and calculated output
vectors, respectively. This is typically done by
continually changing the values of the weights
in the direction of steepest descent with
respect to the error function E as given below:
(10)
Where
3500
indicates the change in values, L
Int.J.Curr.Microbiol.App.Sci (2018) 7(10): 3494-3515
indicates the learning rate and t indicates the
iteration number.
and
determined using the chain
differentiation as given below:
can be
rule of
where, yl and _l represent the output and
input, respectively of the lth neuron lying on
the output layer (Jang et al., 2005). This
process is called the training of the network.
At the end of every training iteration (epoch),
overall training error (absolute relative percent
error) was calculated as given below:
network and the responses were predicted.
The generalization error was computed in the
similar way as that of the training error. The
above process was repeated several times
(epochs or iterations) till the computed
generalization error remains constant for a
predefined number of epochs or starts to
increase rapidly (Doan and Liong, 2004). This
is called early stopping technique. The final
weights of the synaptic joints and bias values
were stored for further analysis.
Determination of optimum values of design
and operational parameters of the inclined
plate seed metering device
Reverse mapping
The function of a neural network model of the
inclined plate seed metering device is to
predict the performance parameters of the
metering device corresponding to given design
and operational parameters. Since the
objective is to determine the optimum values
of design and operational parameters of the
metering device that produce the desired
levels of performance parameters, it would be
ideal if the developed model can be used in a
reverse direction to generate deign and
operational parameters that will produce the
desired levels of performance parameters. A
neural network system cannot be developed
for the direct mapping from the outputs to the
inputs (Wu and Vai, 1997). Due to this
limitation, a conventional optimization
process (like GA) using a neural network
involves two iterative steps: (1) Use a
searching method independent of the neural
network itself to identify a set of input
parameters; and (2) Feed the input parameters
to the neural network to obtain a set of
corresponding output parameters. These two
steps are repeated until the outputs determined
in step 2 are substantially close to the
predetermined desired outputs. Instead of
pursuing an explicit optimization technique
using the developed models, a novel approach
(Wu and Vai, 1997; Vai et al., 1998) in which
the searching of a solution is performed with
amodified neural network learning process, is
developed. This approach begins by training a
neural network to model the performance
parameters of the metering device. As
described in Section 3.2, the weights of the
neural network are adjusted at this stage to
minimize its error function given by (11). The
solution searching is then performed by
applying a modified back propagation learning
rule to the trained network. An initial solution
of design and operational parameters of the
metering device (input variables) is taken and
the trained neural network model is used to
predict the outcome of this solution. The
difference between the desired outcome (seed
rate, seed spacing and percent seed damage)
and the one corresponding to the current
solution is calculated and back propagated
3501
Int.J.Curr.Microbiol.App.Sci (2018) 7(10): 3494-3515
through the layers in the neural network.
Instead of adjusting the neural network
weights, as originally done in the training of
the neural network, the input variables are
modified to minimize the error function
defined in (11), while the weights and bias
values are kept unchanged. This is a very
simple modification of the learning process
because we can simply exchange the roles of
weights and inputs in the back propagation
learning rule. This modified learning rule can
be described as,
and
All the variables are as defined in Section 3.2.
It is evident that the operations described in
(16) can be carried out in a distributed fashion.
Each neuron can utilize values propagated
back from the next layer to calculate its
associated terms and, in turn, send the results
to the previous layer. The above process is
repeated several times for each data of the
training dataset till either the computed error
function defined in (11) becomes a very small
value or maximum of 10,000 iterations are
reached. The final solutions which results in
the desired outcome are stored.
The reverse mapping steps proposed above,
allows the solution searching routine to be
implemented along with the training and
modeling operations. There is no need of an
external optimization routine for the solution
searching. Since the forward mapping model
is used, all the relations between input
parameters and outcomes are retained.
Another significant property of this design
approach is that multiple solutions, if they
exist in the modeled system, can be found
typically with different initial solutions. This
allows the selection of the best solution from
among the multiple solutions from the point of
view of applications in actual field conditions.
Desired performance parameters of the
metering device and selection of the best
solution
As the recommended row spacing and seed
spacing for paddy is 10 and 10 cm,
respectively, seed metering device should be
set to give the seed rate 104.68 seeds/m2. The
percent seed damage during metering was well
within 0.5%, which is the maximum allowable
seed damage in planting equipment.
Considering these facts, the desired outcome
(performance parameters) of the seed metering
device was set as, 104.68 seeds/m2 seed rate,
100 mm seed spacing and 0.19% seed
damage. This generated a number of
combinations of design and operational
parameters of the metering device that shall
satisfy the desired outcome. In order to select
the best solution from among the multiple
solutions, percent cell fill close to 100 was
used as a criterion. It is essential that the
combination of design and operational
parameters should ensure that there is 100%
fill of the cells during metering. Percent cell
fill was computed as the ratio of actual seed
rate obtained using the combination of design
and operational parameters and the theoretical
seed rate determined.
Results and Discussion
The performance parameters of the inclined
plate seed metering device developed through
statistical modeling and back propagation
neural network are presented below.
3502
Int.J.Curr.Microbiol.App.Sci (2018) 7(10): 3494-3515
Results of statistical modeling
Table 4 presents the statistical models
developed for various performance parameters
of the seed metering device. The minimum
value of correlation coefficient was 0.867 and
this indicates that the developed models are
able to represent minimum 86.7% of the
input–output relationship. The performance of
the statistical models was tested on the 4
randomly generated data for the testing
purpose and the mean absolute generalization
error was found to be in the range of 4.83–
32.64%. Percent
seed damage
was
independent of the forward velocity. Apart
from the obvious variation in seed spacing and
seed rate with variation in the forward speed
of planting equipment and rotary speed of the
metering plate as described in Eqs. (1) and (2),
it was observed that the regression coefficients
associated with peripheral speed of the
metering plate is positive for percent seed
damage. This indicates that with increase in
peripheral speed of the metering plate, percent
seed damage increased. Increase in cell area
on the plate, increased the seed rate and
percent seed damage, and decreased the seed
spacing.
The absolute values of the coefficients
associated with peripheral speed of the
metering plate are higher than the rest in each
model, indicating that the peripheral speed of
the metering plate has the highest influence on
the performance parameters of the metering
device than that of other independent
parameters.
Results of neural network modeling
Neural networks of 3-4-2-3 configuration, 3-33 configuration and 3-4-3 configuration were
developed for modeling the performance
parameters of the inclined plate seed metering
device using variety-1, -2 and -3, respectively.
The values of the constants (weight of the
synaptic joints and biases) of the ANN models
are presented in Table 5. The mean absolute
generalization error for the prediction of
individual performance parameter by the ANN
model for each variety is given in Table 6. It
was found to be varying from 1.38 to 3.29%.
The statistical and ANN models were
compared in terms of percent deviation in the
prediction of performance parameters of
inclined plate seed metering device for the 4
test cases (Fig. 5). The values of percent
deviation in prediction of seed rate, seed
spacing and percent seed damage by statistical
models were found to lie in the ranges of
−54.15–53, 4–71 and −11–8, respectively for
variety-1, −29–42, 6–63, and −18–12,
respectively for variety-2, and −38–42, 1–63
and −14–1, respectively for variety-3. As
compared to statistical models, the percent
deviation in prediction by ANN model was
much lower except for 2 data points (cases 1
and 3 of percent seed damage) of each variety.
The prediction of performance parameters by
ANN models was consistent with maximum
percent deviation of 4.35% for the test cases.
The prediction by ANN was better than that of
statistical model mainly because of its ability
to fully capture the input–output relationship
during training of the network and its better
generalization ability. This was also proved by
the sensitivity analysis of the ANN model.
The sensitivity analysis was conducted to
determine the relative importance of each
input parameter for the prediction of each
output parameter. Each input parameter was
varied between its mean±standard deviations
while all other inputs were fixed at their
respective means. The change in output
caused by the change in input was calculated.
The result of the sensitivity analysis when
used with variety-1 is presented in Fig. 6 and
the similar trend was observed when used with
other varieties. Fig. 6 indicates that the
forward speed of the planting equipment had
the highest influence on seed rate followed by
3503
Int.J.Curr.Microbiol.App.Sci (2018) 7(10): 3494-3515
peripheral speed of the metering plate. The
seed rate was negatively correlated with the
metering plate. The seed spacing was highly
influenced by peripheral speed of the metering
plate followed by forward speed of the planting
equipment. The seed spacing was positively
correlated with forward speed and negatively
correlated with peripheral speed of the
metering plate. The percent seed damage was
greatly affected by the variation in the
peripheral speed of the metering plate. The cell
area on the plate and forward velocity had very
little influence on the seed damage. The percent
seed damage was positively correlated with
peripheral speed of the plate. Thus, the trend of
variation in the output parameters for the
variation in the input parameters matched very
closely to the observed variations shown in Fig.
2 and 3. This indicates that the developed ANN
model respects the intuitive correlations
between the input and output parameters and
incorporates this existing domain knowledge in
the model.
Results of the reverse mapping of the ANN
model
The developed ANN model for the
performance parameters of the inclined plate
seed metering device using 3 varieties of paddy
were used in reverse direction to determine the
various combination of design and operational
parameters that result in the desired seed rate of
104.68 seeds/m2, seed spacing of 100 mm and
percent seed damage of 0.2%. The entire
training dataset was passed through the ANN
model in reverse direction with learning rate of
0.3. The combinations of forward speed of the
planting equipment, peripheral speed of the
metering plate and cell area on the plate that
resulted in the desired seed rate, seed spacing
and percent seed damage were stored. Instead
of presenting all the multiple combinations of
design and operational parameters to obtain the
desired performance parameters, only those
with percent cell fill between 99 and 105% are
presented in Table 7. For each variety, any one
of the combinations of design and operational
parameters listed in Table 7 may be selected.
Considering nearly 100% fill of cells, the
combination of design and operational
parameters given in italics in Table 7 were
selected for each varieties of paddy. This
indicated the optimum peripheral speed of the
metering plate to be 0.157 m/s for variety-1 and
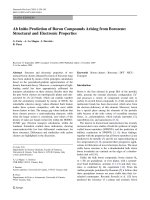
-2 and 0.138 m/s for variety-3. The variation in
the optimum forward speed of the planting
equipment and optimum area of cells on the
metering plate with size of seeds is shown in
Fig. 6. Correlating optimum forward speed of
the planting equipment (Vo, km/h) and
optimum area of cells on the metering plate
(Ao, mm2)with size of seeds (As, mm2), the
following relations were developed:
The R2 value of 0.883 and 0.992 for the Eqs.
(17) and (18), respectively indicates good fit of
the relationship. If the size of seeds to be
planted is known, the optimum forward speed
and size of cells on the metering plate can be
selected using the above relations for the seeds
in the range of 83.12–123.01mm2. The
peripheral speed of the metering plate of 0.150
m/s can be selected for the size of seeds in the
range of 29.46–32.74 mm2.
However, the results presented above will only
serve the purpose of initial approximation in
the selection of design and operational
parameters of the inclined plate seed metering
device. But it needs to be verified under actual
field conditions. It is worth mentioning, that the
reverse mapping process using the ANN
models is very fast since the number of
adjustable variables is significantly reduced
from that of forward training. It takes several
hours to complete the training of neural
network models on a typical work station, but
the optimum solution can be found within 10
seconds.
3504
Int.J.Curr.Microbiol.App.Sci (2018) 7(10): 3494-3515
Table.1 Physical dimensions of the selected varieties of paddy
Parameters
Variety-1
Variety-2
Mean
Std. error Mean
of mean
Variety-3
Std. error Mean
Std. error
of mean
of mean
Length, mm
Breadth, mm
Area, mm2
Half distance of the
minor axis, mm
9.28
2.54
41.01
1.39
0.02
0.03
0.05
0.02
0.03
0.04
0.04
0.03
8.25
2.43
33.67
1.33
6.02
2.26
21.08
1.24
0.03
0.02
0.05
0.04
Table.2 Dimensions of the cell of the metering plates
Metering
plates
Variety-1
Half
Area of the
distance of single cell,
minor axis mm2
of the cell,
mm
Variety-2
Half
Area of the
distance of single cell,
minor axis mm2
of the cell,
mm
Variety-3
Half
Area of the
distance of single cell,
minor axis mm2
of the cell,
mm
1
2
3
2.39
1.89
1.39
2.33
1.83
1.33
2.24
1.74
1.24
77.18
61.03
41.01
64.58
50.72
33.67
41.80
32.47
21.08
Table.3 Response-wise mean and standard deviation of the training validation and test cases
Response
Variety-1
Seed rate
Seed spacing
Percent seed damage
Variety-2
Seed rate
Seed spacing
Percent seed damage
Variety-3
Seed rate
Seed spacing
Percent seed damage
Training data
Validation data
Test data
Mean
S.D.
Mean
S.D.
Mean
S.D.
56.09
200.81
0.24
26.4800
59.5983
0.07561
55.16
198.16
0.24
25.8523
76.8759
0.0887
62.42
202.29
0.26
39.8248
74.7256
0.0975
55.78
196.46
0.24
24.8012
49.8444
0.07640
54.54
201.7026
0.24725
26.9860
64.2456
0.0886
60.24
199.19
0.26
34.1599
66.3677
0.1005
56.27
193.21
0.25
25.1502
51.0122
0.0758
54.88
202.17
0.26
27.6175
78.8019
0.0822
59.6
196.20
0.27
32.5775
64.3433
0.1034
3505
Int.J.Curr.Microbiol.App.Sci (2018) 7(10): 3494-3515
Table.4 Statistical models for the performance prediction of inclined plate seed metering device
Performance
parameter
Statistical model
Correlation Mean
coefficient, absolute
R2
generalization
error
Variety-1
Seed rate
SR=27.3520.887
15.637V+185.861N+0.171A
Seed spacing
SS=186.763+30.4850.867
458.155N-0.455A
Percent seed SD=0.945
damage
0.0307+0.928N+0.0001544A
Variety-2
Seed rate
SR=37.2500.906
15.548V+161.541N0.173A
Seed spacing
SS=126.554+31.178V0.921
311.727N-0.365A
Percent seed SD=0.944
damage
0.0201+0.938N+0.0001804A
Variety-3
Seed rate
SR=39.2910.912
15.890V+162.127N+0.189A
Seed spacing
SS=132.291+29.380V0.880
347.129N-0.455A
Percent seed SD=0.965
damage
0.0311+0.936N+0.0003821A
32.6432
Overall
absolute
generalization
error
23.8845
31.5356
7.1518
24.1690
17.8633
21.2644
7.6504
24.3795
18.2282
25.1631
4.8335
Table.6 Mean absolute generalization error of the ANN models for the prediction of
performance parameters
Variety
1.
2.
3.
ANN
architecture
Mean absolute generalization error, percent
Seed rate
Seed spacing Seed damage
Overall
3-4-2-3
3-3-3
3-4-3
2.9796
1.4179
1.9533
2.4551
2.4310
1.7205
3.8551
2.7167
1.7212
3506
2.9356
2.6991
19536
Int.J.Curr.Microbiol.App.Sci (2018) 7(10): 3494-3515
Table.5 Constants of the ANN models developed for the 3 varieties of paddy
Variety
ANN
architecture
1.
3-4-2-3
Values of constants
U=matrix of weight of synaptic joints between input and 1 st hidden layers; v=matrix of weight of synaptic joints
between 1st and 2nd hidden layers; w= matrix of weight of synaptic joints between 2 nd hidden and output layers;
B1=matrix of bias of 1st hidden layer nodes; B2=matrix of bias of 2nd hidden layer nodes; Bo=matrix of bias of output
layer nodes
2.
3-3-3
3.
3-4-3
u=matrix of weight of synaptic joints between input and hidden layers; w=matrix of weight of synaptic joints
between hidden and output layers; B1=matrix of bias of hidden layer nodes; Bo=matrix of bias of output layer nodes
3507
Int.J.Curr.Microbiol.App.Sci (2018) 7(10): 3494-3515
Table.7 The multiple combinations of design and operational parameters of the inclined plate
seed metering device that resulted in seed rate of 104.68 seeds/m2, seed spacing 100 mm and
percent seed damage of 0.2% with percent cell fill of 99-105%
Design and operational parameters
Forward
speed
of
planting
equipment,
km/h
Variety-1
3.887
4.087
4.142
4.042
Variety-2
3.918
3.896
4.102
4.187
Variety-3
3.939
3.945
3.926
3.865
Resulting performance parameter
Peripheral Cell area Seed rate, Seed
speed
of on
the no.
of spacing,
2
2
metering
plate, mm seeds/m
mm
plate, m/s
Percent
seed
damage,
%
Percent
cell fill, %
0.158
0.158
0.157
0.158
45.421
41.282
47.399
44.472
106.221
100.104
104.842
105.145
99.518
99.542
103.078
102.445
0.198
0.198
0.200
0.200
102.603
103.376
98.857
102.154
0.157
0.158
0.156
0.157
40.487
36.545
52.676
50.576
106.332
106.324
105.658
105.671
100.089
100.140
102.151
102.125
0.198
0.198
0.200
0.200
101.299
102.660
98.953
98.977
0.137
0.137
0.138
0.141
38.890
39.294
35.978
25.943
104.016
104.102
103.984
103.837
97.840
97.878
97.848
97.857
0.199
0.199
0.199
0.199
99.933
99.805
100.451
103.349
w
X
uij
g
uij
vjk
h
vjk
w
Y kl
l
l
l
l
xi
g
h
yl
j
k
gn
h
x
yq
p
m
Fig.1 A feed forward neural network with two hidden layers
3508
Int.J.Curr.Microbiol.App.Sci (2018) 7(10): 3494-3515
Peripheral speed of metering plate, m/s
A1=41.01 mm2, A2=61.03 mm2, A3=77.18 mm2 .
Variety-1
Peripheral speed of metering plate, m/s
A1=33.67 mm2, A2=50.72 mm2, A3=64.58 mm2.
Variety-2
Peripheral speed of metering plate, m/s
A1=21.08 mm2, A2=32.47 mm2, A3=41.80 mm2
Variety-3
Fig.2 Variation in seed spacing with peripheral speed of the metering plate at various forward
speed of the planting equipment for the 3 varieties.
3509
Int.J.Curr.Microbiol.App.Sci (2018) 7(10): 3494-3515
Peripheral speed of metering plate, m/s
A1=41.01 mm2, A2=61.03 mm2, A3=77.18 mm2.
Variety-1
Peripheral speed of metering plate, m/s
A1=33.67 mm2, A2=50.72 mm2, A3=64.58 mm2.
Variety-2
Peripheral speed of metering plate, m/s
A1=21.08 mm2, A2=32.47 mm2, A3=41.80 mm2
Variety-3
Fig.3 Variation in seed rate with peripheral speed of the metering plate at various forward speed
of the planting equipment for the 3 varieties.
3510
Int.J.Curr.Microbiol.App.Sci (2018) 7(10): 3494-3515
Peripheral speed of metering plate, m/s
A1=41.01 mm2, A2=61.03 mm2, A3=77.18 mm2.
Variety-1
Peripheral speed of metering plate, m/s
A1=33.67 mm2, A2=50.72 mm2, A3=64.58 mm2.
Variety-2
Peripheral speed of metering plate, m/s
A1=21.08 mm2, A2=32.47 mm2, A3=41.80 mm2
Variety-3
Fig.4 Variation in percent seed damage with peripheral speed of the metering plate at various
forward speed of the planting equipment for the 3 varieties.
3511
Int.J.Curr.Microbiol.App.Sci (2018) 7(10): 3494-3515
4.1
Forward
speed
4.05
Cell area
4
3.95
3.9
3.85
3.8
41.01
33.67
34
33
32
31
30
29
28
27
Optimum area of cell on
metering plate, mm2
Optimum forward speed of
planting equipment
Fig.5 Sensitivity analysis of input parameters
21.08
Area of seed, mm2
Fig.6 Variation of the optimum forward speed of planting
equipment and optimum area of cells on metering plate
with size of seeds
3512
Int.J.Curr.Microbiol.App.Sci (2018) 7(10): 3494-3515
The fast time for optimization allows a
number of solutions to be generated from
different initial conditions for the same design
goal. Considering the constraints, suitable
combination of input parameters can be
selected from among the generated solutions.
Hence, this type of reverse mapping using the
ANN model has the scope in control of
operating parameters of farm machines under
actual field conditions.
In conclusions, artificial neural network
models were developed for the prediction of
the performance parameters (seed rate, seed
spacing and percent seed damage) of the
inclined plate seed metering device using
forward speed of the planting equipment,
peripheral speed of the metering plate and
area of the cells on the plate as input
parameters. Three most commonly used
varieties of paddy seeds were used to collect
the data on the performance parameters under
the laboratory conditions. Neural networks of
configuration 3-4-2-3 for variety-1, 3-3-3 for
variety-2 and 3-4-3 for variety- 3 were
developed to model the performance
parameters of the inclined plate seed metering
device. The ANN model had lower mean
absolute generalization error and mean
percent deviation in prediction of each
individual performance parameter for each
variety as compared that of statistical models.
ANN models predicted the performance
parameters of the metering device better than
that of the statistical models developed using
regression analysis due to the ability of the
neural network model to fully capture the
input–output relationship during training of
the network and its better generalization
ability. The applications of neural network
were extended beyond their traditional roles
of black box models by applying a modified
back propagation learning rule to the
developed ANN models for synthesizing
design and operational parameters of the
metering device from desired performance
parameters (reverse mapping). The optimum
values of the input parameters required to
obtain the seed rate of 104.68 seeds/m2, seed
spacing of 100.04 mm and percent seed
damage of 0.19% with 100% fill of the cells
were determined. The optimum peripheral
speed of the metering plate was found to be
0.157 m/s for variety-1 and variety -2 and
0.137 m/s for variety-3. The optimum forward
speed of the planting equipment and area of
cells on the metering plate had good
correlation with size of seed. Linear
regression equations were developed to
predict the optimum forward speed of the
planting equipment and area of cells on the
metering plate using the size of seeds. The
peripheral speed of metering plate of 0.150
m/s can be selected for the size of seeds in the
range of 29.46–32.74 mm2. The results can
serve the purpose of initial approximation in
the selection of design and operational
parameters of the inclined plate seed metering
device. But it needs to be verified under
actual field conditions.
References
Al-Janobi, A.A., Aboukarima, A.M., Ahmed,
K.A. 2001. Prediction of specific draft
of different tillage implements using
neural networks. Misr J. Agric. Eng.
18 (3), 699–714.
Bamiro, O.A, Nuradeen, A and Akuru, I.O.
1986. Introductory technology for
schools and colleges. Evans brothers
(Nigeria publishers) limited. Pp. 227233.
Barut, Z.B., Ozmerzi, A. 2004. Effect of
different operating parameters on seed
holding in the single seed metering
unit of a pneumatic planter. Turk. J.
Agric. For. 28, 435–441.
Benardos, P.G., Vosniakos, G.-C. 2007.
Optimizing feed forward artificial
neural network architecture. Eng.
Appl. Artif. Intell. 20 (3): 365–382.
3513
Int.J.Curr.Microbiol.App.Sci (2018) 7(10): 3494-3515
Bhowmik, S. K., Sarkar, M. A. R. and Zaman,
F. 2012. Effect of spacing and number
of seedlings per hill on the
performance of aus rice cv. NERICA
1 under dry direct seeded rice (DDSR)
system of cultivation. J. Bangladesh
Agril. Univ. 10(2): 191–195.
Bishop, C.M., Bamgboye, A.I and
Mofolasayo, A.S. 2006. “Performance
evaluation of a Two row Okra
planter”. Agricultural engineering
international: The CIGR E journal.
Manuscript pm 06002. Vol viii.
Chauhan, A.M., Dingra, H.S., Bhatia, B.S.
1999. Seed placement behavior of
sunflower planter. Agric. Mech. Asia
Africa Latin Am. 3 (4): 9–11.
Dash, R., Sirohi, N.P.S., 2008. A computer
model to select optimum size of farm
power and machinery for paddy–
wheat crop rotation in northern India.
Agric. Eng. Int. CIGR E-J. 10.
Doan,
C.D.,
Liong,
S.-Y.
2004.
Generalization for multilayer neural
network: Bayesian regularization or
early stopping. In: Proceedings of the
2nd Conference of the Asia Pacific
Association of Hydrology and Water
Resources (APHW), Singapore.
Hall, J.W. 1992. Emulating Human Process
Control Functions with Neural
Networks. Ph. D. thesis. Dept. of
Mech. Eng., Uni. of Illinois, Urbana,
IL.
Hansson,
P.-A.
1995.
Optimization
agricultural tractor cab suspension
using the evolution method. Comput.
Electron. Agric. 12 (1): 35–49.
Hornik, K. 1993. Some new results on neural
network approximation. Neural Netw.
6 (9), 1069–1072.
Jayan, P.R., Kumar, V.J.F. 2004. Planter
design in relation to the physical
properties of seeds. J. Trop. Agric. 42
(1/2): 69–71.
Kachman, S.D., Smith, J.A. 1995. Alternative
measures of accuracy in plant spacing
for planters using single seed
metering. Trans. ASAE 38 (2): 379387.
Kamble, A.K., Rahate, R.H., Devagirikar,
A.A., Diwane, L.P., Alurkar, H.P.
2003. Development evaluation of
multipower operational cotton planter.
Bioved 14 (1/2): 29–32.
Korayem, A.Y., Younis, S.M., Hemada,
A.M., 1986. Study of some factors
affecting the accuracy of corn
planters. Alex. J. Agric. Res. 32 (2):
27–46.
Kushwaha, R.L., Zhang, Z.X. 1998.
Evaluation of factors and current
approaches related to computerized
design of tillage tools: a review. J.
Terramech. 35 (2): 69–86.
Ma, F.-L., Li, S.-P., He, Y.-L., Liang, S., Hu,
S.-S. 2006. Knowledge acquisition
based on neural networks for
performance evaluation of sugarcane
harvester. In: Wang, J., Yi, Z., Zurada,
J.M., Lu, B.-L., Yin, H. (Eds.),
Advances in Neural Networks.
Springer- Verlag, Berlin/Heidelberg,
pp. 1270–1276.
Mayande, V.M., Srinivas, I., Adake, R.V.,
Sreenivasulu, Y. 2002. Investigations
on groundnut planting accuracy and
seed size using inclined plate planter.
Indian J. Dryland Agric. Res. Dev. 17
(2): 158–163.
Ojha, T.P. and Micheal, A.M. 2012.
Principles
of
Agricultural
Engineering. Jain brothers East Park
Road, Koral Bagh. New Delhi. Sixth
Edition.
Parmer, R.S., McCledon, R.W., Potter, W.D.
1996. Farm machinery selection using
simulation and genetic algorithms.
Trans. ASAE 39 (5): 1905–1909.
Santos, S.R., dos Neto, P.H.W., Fey, E.,
Wobeto, C. 2003. Influence of
soybean seed size in seeding
3514
Int.J.Curr.Microbiol.App.Sci (2018) 7(10): 3494-3515
processes. Rev. Bras. Eng. Agric.
Ambient 7 (1): 177–181 (in
Portuguese with English abstract).
Shrivastava, A.K., Jain, S.K., Dubey, A.K.,
Singh, V.C. 2003. Performance
evaluation of tractor drawn six row
inclined plate planter for oilseed and
pulses. JNKVV Res. J. 37: 72–75.
Singh, R.C., Singh, G., Sarswat, D.C. 2005.
Optimization
of
design
and
operational parameters of a pneumatic
seed metering device for planting
cotton seeds. Biosystem Engineering.
92 (4): 492-438.
Vai, M.M., Wu, S., Li, B., Prasad, S. 1998.
Reverse modeling of microwave
circuits with bidirectional neural
network models.
IEEE Trans.
Microwave Theory Tech. 46 (10):
1492–1494.
Wu, S., Vai, M.M. 1997. A massively parallel
reverse modeling approach for
semiconductor deices and circuits. In:
Proceedings of IEEE Conference on
Advanced Concepts in High Speed
Semiconductor Development and
Circuits, Ithaca, NY, pp. 201–209.
Yazgi, A., Degirmencioglu, A. 2007.
Optimization of the seed spacing
uniformity performance of a vacuumtype precision seeder using response
surface methodology. Biosyst. Eng. 97
(3): 347–356.
How to cite this article:
Manisha Sahu and Ajay Verma. 2018. Neural Network Prediction of Performance Parameters
of an Inclined Plate Seed Metering Mechanism and its Reverse Mapping for Rice.
Int.J.Curr.Microbiol.App.Sci. 7(10): 3494-3515. doi: />
3515