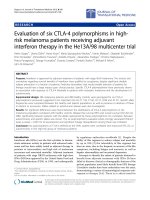
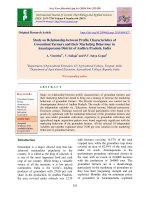
Evaluation of genetic diversity of Cercospora abelmoschi Infecting Okra in Guntur district, Andhra Pradesh, India
Bạn đang xem bản rút gọn của tài liệu. Xem và tải ngay bản đầy đủ của tài liệu tại đây (260.63 KB, 7 trang )
Int.J.Curr.Microbiol.App.Sci (2018) 7(11): 1925-1931
International Journal of Current Microbiology and Applied Sciences
ISSN: 2319-7706 Volume 7 Number 11 (2018)
Journal homepage:
Original Research Article
/>
Evaluation of Genetic Diversity of Cercospora abelmoschi Infecting Okra in
Guntur District, Andhra Pradesh, India
G. Amulya1*, V. Prasanna Kumari1, V. Manoj Kumar1 and Y. Ashoka Rani2
1
Department of Plant Pathology, 2Department of Crop physiology, Agricultural College,
Bapatla 522 101, A.P, India
*Corresponding author
ABSTRACT
Keywords
BamHI,
Cercospora, EcoRI,
Isolates, Okra,
Primers, Taq1,
Variability
Article Info
Accepted:
15 October 2018
Available Online:
10 November 2018
The present study was taken up in the Agricultural College, Bapatla during 2016-2017.
Cercospora infected leaves were collected during kharif 2016 from eight different okra
growing villages in Guntur district, Andhra Pradesh which were used for in planta
isolation of fungal DNA and amplified using universal primers ITS 1 and ITS 4. The 550
bp amplicon thus obtained was restricted with hexa cutters, EcoRI, BamHI and tetra cutter
Taq1 to find variability among Cercospora isolates. EcoRI found two restriction sites in all
isolates except the Yazali isolate while BamHI found single restriction site in all the
isolates with length polymorphism in Yazali isolate. Taq1 restriction indicated a high
degree of genetic diversity among the isolates and was represented by three different
banding patterns while in three isolates there were no restriction sites. Dendrogram
constructed from similarity coefficients showed that Yazali isolate separated into a group
upon digestion with EcoRI and BamHI while the Taq1 digestion of Yazali isolate clustered
with Thimmareddipalem isolate. The results revealed that the presence of notable genetic
variation in population sampled within the geographic region of Guntur district may be due
to variations in single nucleotide polymorphism.
Introduction
Okra, Abelmoschus esculentus (L.) Moench, is
an important warm season vegetable crop
grown mainly in the tropical or sub-tropical
regions during summer and rainy season
(Thomson and Kelly, 1957).Okra was known
to be originated from West Africa (Joshi et al.,
1974). In India, it is grown in 503.7 thousand
ha with a production of 5708 thousand M t
and 11.3 M t/ha productivity. In Andhra
Pradesh, it occupies an area of 18.6 thousand
ha with a production of 211.2 thousand M t
and productivity is 11.4 M t/ha (Ministry of
Agriculture and Farmers Welfare, Govt. of
India, 2014- 2015).
Okra crop suffers from number of biotic and
abiotic stresses. Among biotic factors, fungal
diseases are reported to pose serious problem
in okra cultivation (Jha and Dubey, 2000). In
India, two species of Cercospora viz., C.
malayensis Stev. And Solh. And C.
abelmoschi Ell. and Ev. were found to cause
leaf spots in okra. These species differ in
symptom production. Molecular phylogenetic
1925
Int.J.Curr.Microbiol.App.Sci (2018) 7(11): 1925-1931
techniques were used with the hope that they
could more readily elucidate the phylogenetic
relationships within the species. Hence,
present investigation was undertaken with the
objective to study the diversity of Cercospora
abelmoschi infecting okra in Guntur district
using ITS primers.
Materials and Methods
Collection of diseased samples and InPlanta isolation of fungal DNA
Cercospora infected leaves were collected
during kharif 2016 from eight different okra
growing villages in Guntur district, Andhra
Pradesh and were designated as described in
the Table 1. The samples were screened for
the diseased portion, required amount of leaf
was weighed, properly labeled, packed in
polythene bags and stored at -400C
temperature for further investigations. Plant
DNA was isolated by modified CTAB method
(Murray and Thompson, 1980). The
concentration of DNA was determined using
the Nano-Drop ND-1000 spectrophotometer
(Nano
Drop
Technologist).
In-planta
expression of pathogenic DNA was tested as
the technique avoids the usage of liquid
nitrogen, its simplicity, low cost, fast and safe
protocol.
PCR amplification with ITS primers
Amplification of Internal Transcribed Spacer
(ITS) region using universal primers
previously described by White et al. (1990).
Forward and reverse primers, viz., ITS1 (5’
TCCGTAGGTGAACCTGCGG 3’) and ITS 4
(5’
TCCTCCGCTTATTGATATGC
3’)
respectively, synthesized based on conserved
18S and 28S coding regions of the nuclear
rDNA were used. Amplification was carried
out with 25 μl reaction mixture containing 2.5
μl of 10X PCR buffer, 0.5 μl 10 mMdNTPs, 1
μl of each primer, 1.5 μl of 25 mM MgCl2, 0.5
units of Taq polymerase, 15 μl of water and
3μl of template DNA. Amplification was
performed in 0.2 ml thin walled PCR tubes
using a thermocycler (Biorad) programmed
for initial denaturation at 940C for 5 min,
followed by 35 cycles of denaturation at 940C
for 30 sec, annealing at 56.90C for 1 min,
primer extension at 720C for 1.5 min and a
final extension at 720C for 7 min and hold at
40C. Amplified products were analysed in 1%
agarose gel and the migration pattern of the
DNA fragments in the gel was recorded using
gel documentation system (Biorad, USA) in
an auto exposure mode.
Restriction Enzyme Analysis of ITS regions
Polymorphism was determined by digesting
the amplicon obtained using ITS primers with
three different restriction endonucleases, i.e.,
hexa basepair cutters - EcoRI, BamHI and
tetra basepair cutter - TaqI. The restriction
fragments
were
size
separated
by
electrophoresis on 2.0% agarose gel and were
viewed under UV light and phylogenetic
analysis was done using the Dendro-UPGMA
(Unweighted Pair Group Method with
Arithmetic mean) (Garcia-Vallve et al., 1999)
software. Restriction bands were analysed,
wherein each band with a different
electrophoretic mobility was assigned a
position number and based on the presence or
absence of the band it was named as binary
digits 1 or 0. Only reproducible bands were
considered for analysis. Bands common to all
isolates were incorporated into the analysis.
Based on the similarity coefficients, a
dendrogram was constructed by the
unweighted pair group method with arithmetic
mean (UPGMA) hierarchical clustering
algorithm.
Results and Discussions
The DNA extracted (Plate 1) from Cercospora
infected leaf samples were amplified and
1926
Int.J.Curr.Microbiol.App.Sci (2018) 7(11): 1925-1931
amplicon of 550 bp in all the samples (Plate 2)
confirmed that the quality of DNA extracted
using the protocol was suitable for the
purpose. No size variation was found among
the amplified ITS regions. The two hexa cutter
restriction endonucleases EcoRI and BamHI
tested, showed restriction sites in the ITS
region and revealed polymorphism in only one
isolate collected from Yazali. Seven isolates
tested with EcoRI enzyme produced three
digested products at 550, 450 and 200 bp
products (Plate 3). BamHI also gave similar
variation in the restriction site with Yazali
isolate where only one digested product at 450
bp was observed as against two in other
isolates (Plate 4).
Based on the dendrogram construction utility
software DendroUPGMA, the similarity
coefficients were transformed into distances
and clustering was done using the Unweighted
Pair Group Method with Arthmetic mean
(Garcia-Vallve et al., 1999). The dendrogram
constructed indicated that the Yazali isolate
differed in restriction digestion. EcoRI
restriction resulted in three fragments in all
seven isolates except the isolate collected from
Yazali due to difference in restriction sites
(Fig. 1). Restriction with BamHI exhibited
single restriction site in all seven isolates
except in isolate from Yazali which differed in
length polymorphism (Fig. 2).
Restriction with tetra base pair cutter Taq1
indicated a high degree of genetic diversity
among the isolates of okra collected from
different geographical locations in the study
which was represented by the differences in
banding pattern. Based on similarity
coefficients, two major clusters were formed
which further divided into four groups (Fig.
3). Bapatla 1 and Dhundivaripalem 3 isolates
had similar banding patterns with six
restriction sites that were clustered into a
group.
The
isolates
Nandirajuthota,
Dhundivaripalem 1 and Dhundivaripalem 2
did not have any restriction sites for tetra
cutter Taq1, thus were grouped together.
Isolate Bapatla 2 had only one restriction site
and was separately grouped whereas the
isolates Yazali, Thimmareddipalem had three
restriction sites and were in a group (Plate 5).
Table.1 Okra samples collected from different locations of Guntur district
S. No.
Place of collection
Sample designation
1
Bapatla
Bpt1
2
Bapatla
Bpt2
3
Nandirajuthotha
Nt
4
Dhundivaripalem
Dp1
5
Dhundivaripalem
Dp2
6
Dhundivaripalem
Dp3
7
Yazali
Yz
8
Thimmareddipalem
Tp
1927
Int.J.Curr.Microbiol.App.Sci (2018) 7(11): 1925-1931
Plate.1 Agarose gel electrophoresis showing DNA of Cercospora abelmoschi isolated from
infected leaves. Lanes 1-8 represent isolates Bpt1, Bpt2, Nt, Dp1, Dp2, Dp3,Yz, Tp. Lane M
indicates the molecular weight marker 1kb plus ladder
Plate.2 Agarose gel electrophoresis showing amplicon amplified by universal Internal
Transcribed Spacer (ITS) primers in eight isolates. Lanes 1-8 represent isolates Bpt1, Bpt2, Nt,
Dp1, Dp2, Dp3, Yz, Tp. Lane M indicates the molecular weight marker 1kb plus ladder
Plate.3 Restriction analysis of amplicons obtained from ITS primers with EcoRI. Lanes 1-8:
Digested products of ITS region from isolates Bpt1, Bpt2, Nt, Dp1, Dp2, Dp3,Yz, Tp. Lane M
indicates the molecular weight marker 1kb plus ladder
1928
Int.J.Curr.Microbiol.App.Sci (2018) 7(11): 1925-1931
Plate.4 Restriction analysis of amplicons obtained from ITS primers with BamHI. Lanes 1-8:
Digested products of ITS region from isolates Bpt1, Bpt2, Nt, Dp1, Dp2, Dp3,Yz, Tp. Lane M
indicates the molecular weight marker 1kb plus ladder
Plate.5 Restriction analysis of amplicons obtained from ITS primers with Taq1. Lanes 1-8:
Digested products of ITS region from isolates Bpt1, Bpt2, Nt, Dp1, Dp2, Dp3,Yz, Tp. Lane M
indicates the molecular weight marker 1kb plus ladder
Fig.1 Dendrogram showing clustering pattern of Cercospora isolates using EcoRI by UPGMA
method
1929
Int.J.Curr.Microbiol.App.Sci (2018) 7(11): 1925-1931
Fig.2 Dendrogram showing clustering pattern of Cercospora isolates using BamHI by UPGMA
method
Fig.3 Dendrogram showing clustering pattern of Cercospora isolates using Taq1 by UPGMA
method
The present results were in agreement with the
similar study conducted on ectomycorrhizal
fungi in Fennoscandia that showed intra specific
polymorphism in seven species. The
polymorphism was reported due to length
mutations, ranging from 5 to 15 bp in four of
the seven polymorphic species (Karen et al.,
1997). There are reports on host- specific
specialization
(formaespeciales)
of
C.
canescens from V. mungo (Kaushal et al., 1993)
and V. radiate (Chand et al., 2000). Genetic
heterogeneity previously has been observed for
other fungi like Ascochyta rabiei (Morjane et
al., 1994) and Rhynchosporium secalis
(Dermott et al., 1989). In case of A. rabiei,
population sampled from a single chickpea field
contained a large amount of subtle genetic
variation, with more than one A. rabiei
haplotype being present on single host plant
even with in single lesion.
In the present study, it is confirmed that
variability existed in Cercospora isolates
collected from Guntur district. The different
banding patterns with hexa and tetra cutters
revealed that polymorphism existed within the
isolates which may be due to variations in
single nucleotide resulting in variation in
restriction sites.
The present results were in agreement with the
similar study conducted on ectomycorrhizal
fungi in Fennoscandia that showed intra specific
polymorphism in seven species. The
polymorphism was reported due to length
mutations, ranging from 5 to 15 bp.
in four of the seven polymorphic species (Karen
et al., 1997). There are reports on host- specific
specialization
(formaespeciales)
of
C.
canescens from V. mungo (Kaushal et al., 1993)
and V. radiate (Chand et al., 2000). Genetic
heterogeneity previously has been observed for
other fungi like Ascochyta rabiei (Morjane et
al., 1994) and Rhynchosporium secalis
(Dermott et al., 1989). In case of A. rabiei,
1930
Int.J.Curr.Microbiol.App.Sci (2018) 7(11): 1925-1931
population sampled from a single chickpea field
contained a large amount of subtle genetic
variation, with more than one A. rabiei
haplotype being present on single host plant
even with in single lesion.
In the present study, it is confirmed that
variability existed in Cercospora isolates
collected from Guntur district. The different
banding patterns with hexa and tetra cutters
revealed that polymorphism existed within the
isolates which may be due to variations in
single nucleotide resulting in variation in
restriction sites.
References
Chand, R., Lal, M and Chaurasia, S. 2000.
Formaespecialis
in
Cercospora
canescens. In Proceedings of the
International Conference on Integrated
Plant
Disease
Management
for
Sustainable
Agriculture,
Indian
Phytopathological Society. 1: 164–165.
Dermott, M. J. M., Mc Donald, B. A., Allard, R.
W and Webster, R. K. 1989. Genetic
variability for pathogenicity, isozyme,
ribosomal DNA and colony color variants
in populations of Rhynchosporium
secalis. Genetics. 122: 561–565.
Garcia-Vallve, S., Palau, J and Romeu, A. 1999.
Horizontal gene transfer in glycosyl
hydrolases inferred from codon usage in
Escherichia coli and Bacillus subtilis.
Molecular Biology and Evolution. 16 (9):
1125-1134.
Jha, A.K and Dubey, S.G. 2000. Occurrence of
collar rot of (Abelmoschus esculentus) in
the plateau region of Bihar. Journal of
Research- Birsa Agricultural University.
12(1): 67-72.
Joshi, A.B., Gadwal, V.R and Hardas, M.W.
1974. Evolutionary studies in world
crops. In J.B. Hutchinson (ed.) - Diversity
and Change in the Indian Subcontinent,
Cambridge.99-110.
Karen, O., Hogberg, N., Jonsson, L and Nylund,
J. E. 1997. Inter- and intraspecific
variation in the ITS region of rDNA of
ectomycorrhizal fungi in Fennoscandia as
detected by endonuclease analysis. New
Phytologist. 136: 313–325.
Kaushal, R. P. and Singh, B. M.
1993.Pathogenic variability in leaf spot
and powdery mildew pathogens of
legumes. Indian Phytopathology. 46:
182–184.
Ministry of Agriculture and Farmers Welfare,
Govt. of India, 2014- 2015.Agricultural
Statistics at a Glance.204-209.Bawden,
F.C. 1999.Plant Diseases. Green World
publishers, Lucknow, India. 206.
Morjane, H., Geistlinger, J., Harrabi, M.,
Weising, K and Kahl, G. 1994.
Oligonucleotide fingerprinting detects
genetic diversity among Ascochyta rabiei
from a single chickpea field in Tunisia.
Current Genetics. 26: 191–197.
Murray, M.G and Thompson, W.F. 1980. Rapid
isolation of high molecular weight plant
DNA. Nucleic Acids Research. 8: 43214326.
Thomson, K.F and Kelly, C.W. 1957. Vegetable
Crops. McGraw Hill Book Co, Inc. USA.
164-169.
White, T.J., Bruns, T., Lee, S and Taylor, J.
1990.Amplification and direct sequencing
of fungal ribosomal RNA genes for
Phylogenetics. In M.A. Innis, D.H.
Gelfand, and J.J. Sninsky (eds.) - PCR
Protocols: A Guide to Methods and
Applications. Academic Press, New York.
Pp. 315–322.
How to cite this article:
Amulya, G., V. Prasanna Kumari, V. Manoj Kumar and Ashoka Rani, Y. 2018. Evaluation of
Genetic Diversity of Cercospora abelmoschi Infecting Okra in Guntur District, Andhra Pradesh,
Inda. Int.J.Curr.Microbiol.App.Sci. 7(11): 1925-1931.
doi: />
1931