Moderate drying and higher N increases the yield and water use efficiency of rice established through system of rice intensification (SRI) method
Bạn đang xem bản rút gọn của tài liệu. Xem và tải ngay bản đầy đủ của tài liệu tại đây (336.04 KB, 10 trang )
Int.J.Curr.Microbiol.App.Sci (2018) 7(12): 809-818
International Journal of Current Microbiology and Applied Sciences
ISSN: 2319-7706 Volume 7 Number 12 (2018)
Journal homepage:
Original Research Article
/>
Moderate Drying and Higher N Increases the Yield and
Water Use Efficiency of Rice Established Through
System of Rice Intensification (SRI) Method
Ashaq Hussain1*, Aabid Hussain Lone1, M. Anwar Bhat2, Manzoor A. Ganai1, Latief
Ahmad3, S. Sheeraz Mehdi1 and I.A. Jehangir1
1
3
Mountain Research Centre for Field Crops, 2Dryland Agriculture Research Station,
Division of Agronomy (AFMU Unit), Faculty of Agriculture, Shere Kashmir University of
Agricultural Sciences and Technology of Kashmir, Budgam, J&K, India, 190 007
*Corresponding author
ABSTRACT
Keywords
Nitrogen, Irrigation
water saving, Rice,
System of rice
intensification,
Water productivity
Article Info
Accepted:
10 November 2018
Available Online:
10 December 2018
Field experiments were conducted during 2015 & 2016 at Mountain Research Centre for Field
Crops, Khudwani, SKUAST-Kashmir, India. Our objective was to measure the impact of
alternative water management practices and varying N levels on water productivity,
physiology, growth and yield of rice. Treatments comprised of three irrigation regimes;
Submerged conditions (I1); Irrigation at 3 days after disappearance of ponded water (I2);
Irrigation at 6 days after the disappearance of ponded water (I3) in main plots and four nitrogen
doses viz., 0 kg/ha (N0); 80 kg/ha (N1); 100 kg/ha (N2); 120/kg ha (N3) in subplots. Results
revealed that with I2 water management practice it is possible to simultaneously increase the
yield and decrease the water requirements of irrigated rice significantly. I2 increased the grain
yield by about 6% and 16% as compared to I1 and I3, respectively. Continuous submergence
resulted in significant yield penalty and considerable wastage of water while as I 3 condition
created acute moisture deficit in the soil which finally translated into poor crop stand. The
benefits of water saving in I3 condition were outweighed by significant decline in physiological
performance, growth and yield of rice. The growth and yield of crop increased as the N dose
was increased from N0 to N3. The yield gain in N1, N2 and N3 was 48%, 60% and 75% as
compared to N0.
Introduction
The food security of Asia largely depends
upon the irrigated rice (Oryza sativa L.).
Flood-irrigated rice consumes more than 45%
of total fresh water used (Barker et al., 1999).
However, owing to immense competition from
urban and industrial sectors, the freshwater for
irrigation is becoming rapidly scarce (Bouman
and Tuong, 2001). It is predicted that by 2025,
15 million ha of Asia’s irrigated rice area may
experience ―physical water scarcity‖ (Tuong
and Bouman 2003). This puts the
sustainability of irrigated rice production at a
huge risk (Postel, 1997). Hence, adoption of a
rice cultivation technology that consumes less
water while sustaining or ideally increasing
the productivity has become indispensible
809
Int.J.Curr.Microbiol.App.Sci (2018) 7(12): 809-818
(Yang and Zhang 2010). This would provide
farmers with the much needed motivation to
reduce their irrigation rates.The system of rice
intensification (SRI) seems to be a potential
approach to increase rice production with
reduced water demand, thus improving both
water use efficiency and water productivity
(Uphoff, 2012). There are reports of increase
of 25–50 %, or more in the yields of irrigated
rice with SRI practices, while reducing water
requirements (Thakur et al., 2011). SRI
represents a paradigm shift rather than a fixed
technology and allows modifications and
refinements in its components to best suit the
local conditions.
Rice requires high doses of nitrogen for proper
growth and development. The steep increase
in the N application rates adds to the costs of
production and thereby lowers net farm
income and also raises environmental
concerns
over
groundwater
pollution
(Aparicio et al., 2008) which eventually
undermines the sustainability of rice based
cropping systems. This makes it important to
evaluate the optimum amounts of N
application.
In this study we raised the crop as per the SRI
methodology except for the irrigation and N
management components.
The present studt objective was to measure the
impact of three different irrigation regimes
and varying N levels under temperate
conditions of Kashmir on water productivity,
crop physiology, growth parameters (both
above and below ground) and yield
components of rice. This could help to
determine the scope of reductions in the
amount of water required for efficient paddy
rice production as compared to flood irrigation
practice and possible refinements in the Nfertilizer applications under varied water
regimes.
Materials and Methods
The experiment was conducted during Kharif
(May to September) seasons of 2015 and 2016
at Mountain Research Centre for Field Crops
Khudwani, SKUAST-Kashmir, India. The
centre is located 34◦ N latitude, 74◦ E longitude
and 1,560 m above the mean sea-level. The
amount of rainfall recorded during crop
growing seasons of 2015 and 2016 was 644
mm and 242 mm respectively. The
experimental field was silty clay loam in
texture and neutral in pH (7.1). The soil was
low in nitrogen (122 mg N/kg soil) and
medium in phosphorus (10.1mg P/kg soil) and
potassium (128 mg K/kg soil). Treatments
comprised of three irrigation regimes; flooded
conditions (I1), irrigation at 3 days after
disappearance of ponded water (3DAPW) (I2)
and irrigation at 6 days after the disappearance
of ponded water (6DAPW) (I3) in main plots
and four nitrogen levels viz., 0 kg/ha (N0), 80
kg/ha (N1), 100 kg/ha (N2) and 120 kg/ha (N3)
in subplots, tested in a split-plot design and
replicated thrice. In plots under I2 and I3 the
irrigation water of 5 cm was applied to fields
to restore flooded condition respectively after
three and six days have passed since the
disappearance of ponded water. The mean
depth of irrigation water in each plot was
measured at 4 selected spots after each event
of irrigation with measuring rod. Seventeen
day old seedlings were transplanted at a
spacing of 25 cm× 25 cm. For this purpose
bricks at four spots in each plot were fixed
into the soil, keeping their upper surface
levelled with the soil surface. Drainage was
conducted on two occasions during 2015 when
heavy rains resulted in pounding. The
fertilizers used were urea for N,
superphosphate for P and muriate of potash
for K. Rotary weeder was used for weed
management. At full maturity, rice crop was
harvested manually. Grain and straw yields
were recorded from a net area of 2 m2 from
the centre of each experimental plot. Grain
810
Int.J.Curr.Microbiol.App.Sci (2018) 7(12): 809-818
yield was adjusted to 14% moisture content
and straw yield was expressed on oven dry
weight basis. Rainfall data recorded at the
meteorological observatory of Qazigund,
(Distt. Anantnag, J & K) were used for
calculation of water use. The other parameters
were calculated as given below:
Irrigation water use (mm) = Sum of mean
depth of each irrigation
Total water use (mm) = Irrigation water use
(mm) + Rain fall (mm)
Nutrient uptake= nutrient concentration ×
yield
Water productivity (kg/ha mm) = Grain yield
(kg/ha) ÷ Water use (m3)
Among the growth parameters; tiller/m2, leaf
area index, light interception, root dry weight
and root volume were measured and among
the yield parameters; panicles/m2, filled grains
per panicle and 1000 grain weight were
recorded. Mineral N (NH4+ and NO3--N)
concentration in 2 M KCl extracts was
measured by micro-Kjeldahl distillation
method (Keeney and Nelson 1982).
Photosynthetic rate (Pn; µmol CO2/ m/2/s) and
transpiration rate (TR; mmol H2O/m2/s) were
measured in flag leaf at flowering stage using
portable photosynthesis system (Model PP
Systems, TPS-2).
The data obtained was subjected to analysis of
variance using R software (version 3.2.0;
Developer: R Core Team, University of
Auckland, New Zealand). Significantly
different treatment means were separated
using Fisher’s protected least significant
difference (LSD) test (Steel et al., 1997).
levels also significantly affected rice growth
parameters. Data pooled over two years
revealed that I2 (3DAPW) produced 6% and
12% higher tiller/m2 as compared to I1(flooded
condition) and I3 (6DAPW) respectively. The
leaf area index (LAI) of I2 was at par with I1
but significantly (11%) higher than I3. N1, N2
and N3 increased tillering by about 15, 21 and
25%, respectively over N0. LAI in N0 was
respectively reduced by 21%, 36% and 44% as
compared to N1, N2 and N3. I3 intercepted 85%
of PAR whereas I1 and I2 intercepted 89% and
91% of the PAR, respectively. Increasing
levels of N resulted in significantly higher
PAR interception. As N levels were increased
from N0 to N1, N2 and N3, PAR interception
was 82, 88, 89 and 92.7%, respectively. Plants
grown under I2 irrigation regime produced
highest root dry weight and root volume. Root
dry weight was reduced by about 6% and 13%
respectively in I1 and I3. Root volume was
decreased by 6% and 8% respectively in I1 and
I3 as compared to I2.
Soil mineral nitrogen
Irrigation regimes had a significant effect on
mineral N content (Table 1). Highest NH4+ N
content was found under submerged irrigation
regime (I1) followed by I2 and I3. The lowest
NO3- N content was observed in I1 while as I2
and I3 were at par with each other. Increasing
levels of N resulted in a significant increase in
mineral-N. NH4+ N was higher by 4%, 6% and
9%, respectively in N1, N2 and N3 as
compared to N0. The corresponding increase
in NO3- N content was about 48%, 114% and
164%.
Physiological parameters
Results and Discussion
Growth parameters
All the growth parameters showed significant
response to changes made in water
management practices (Table 1). Nitrogen
The rate of photosynthesis was highest in I2
followed by I1 and I3 (Table 1). Photosynthetic
rate among N levels was in the order of
N3>N2=N1>N0. The transpiration rate under I1
was significantly (P≤0.05) higher than I2 and
I3. I1 and I2 registered on par SPAD values but
811
Int.J.Curr.Microbiol.App.Sci (2018) 7(12): 809-818
both higher SPAD values as compared to I3.
Nitrogen being an integral part of chlorophyll
had a profound effect on SPAD values. On an
average N1, N2 and N3 resulted in an increase
in SPAD values by 27.7, 34.0 and 41.0% over
N0. Water productivity was found significantly
higher under I3 (5.85 kg/ ha mm) compared
with I2 (5.23 kg/ha mm) and I3 (3.96 kg/ha
mm). Total water (rainfall + irrigation)
utilization was highest under I1 followed by I2
and I3. Thus, there was a saving of 20% water
under I2 and 38% under I3 compared to I1.
Yield attributes and yield
I2 resulted in about 12% and 5% increase in
panicles/m2 over I3 and I1 respectively (Table
2). Increasing levels of N from N1, N2 to N3
increased panicles/m2 by 16, 26 and 30%
respectively over N0. Irrigation level I3
significantly reduced the number of
grains/panicle by 7% while as I1 and I2 were at
par with each. N1, N2 and N3 significantly
increased number of grains by 16.7, 24.0 and
37 % respectivelyover N0. Irrigation regimes
did not affect 1000 grain weight. N1, N2 and
N3 increased 1000 grain weight by about 7, 10
and 14% respectively. Grain and straw yields
were also significantly affected by irrigation
regimes and nitrogen levels. The reduction in
grain yield in I1 and I3 was to the tune of 6%
and 16%, respectively as compared to I2. The
increase in grain yield in N1, N2 and N3 was of
the order of 48, 60 and 75% over N0. Straw
yield in I2 was 8% and 15% higher than I1 and
I3 respectively. On an average N1, N2 and N3
resulted in increase of 34, 40 and 54% in straw
yield over N0.
Table.1 Effect of irrigation regimes and nitrogen levels on plant growth and physiological
parameters
Tillers
/m2
LA
I
PAR
intercepted
(%)
SPAD
Root
dry
weight
(g/m)
Root
volume
(ml/m)
Soil
NH4+ N
(mg/
kg)
Soil
NO3- N
(mg/kg)
Photosynthetic
rate
(Pn)
(μ mol/ m2/s)
Transpiration
rate (TR)
(mmol/m2/s)
Irrigation levels
I1
383
4.32
89.4
34.7
286
1177
13.58
9.21
21.27
7.23
I2
406
4.37
91.8
35.6
305
1253
11.65
10.34
23.49
6.60
I3
362
3.92
85.3
32.1
270
1157
10.13
10.83
20.82
5.94
SE m±
6.75
0.09
1.64
0.62
23.65
0.50
0.45
0.72
0.16
LSD (5%)
17.27
0.23
3.64
1.58
12.35
60.54
1.29
1.16
1.85
0.41
N0
335
3.30
82.2
27.1
232
1078
7.35
5.84
20.63
6.42
N1
384
4.01
88.0
34.6
259
1163
10.12
8.65
22.17
6.66
N2
404
4.49
89.2
36.4
278
1193
11.70
12.38
21.92
6.89
N3
415
4.74
92.7
38.3
292
1232
13.94
15.46
24.46
7.97
SE m±
7.81
0.12
1.54
0.61
5.64
20.87
0.86
0.76
0.60
0.13
20.15
0.31
3.98
1.57
14.55
53.84
2.22
1.95
1.55
0.34
4.82
Nitrogen levels
LSD (5%)
812
Int.J.Curr.Microbiol.App.Sci (2018) 7(12): 809-818
Table.2 Effect of irrigation regimes and nitrogen levels on rice yield
Panicles/m2
Grains/panicle
1000 grain
weight (g)
Grain yield
Straw yield
(t/ ha)
(t/ ha)
Irrigation levels
I1
365
79.8
25.52
6.18
7.94
I2
384
80.4
25.83
6.50
8.58
I3
342
74.0
25.31
5.63
7.44
SE m±
6.52
1.43
0.60
0.12
0.11
LSD (5%)
16.63
3.64
NS
0.30
0.27
N0
310
65.2
23.73
4.08
5.94
N1
361
76.1
25.31
6.04
7.90
N2
391
81.3
26.15
6.64
8.29
N3
404
89.4
27.09
7.26
9.15
SE m±
7.17
1.58
0.50
0.14
0.17
LSD (5%)
18.51
4.07
1.29
0.36
0.43
Nitrogen levels
Table.3 Effect of irrigation regimes and nitrogen levels on N, P and K (kg/ha) uptake and
nitrogen recovery efficiency (%) in rice under SRI method
Irrigation levels
I1
I2
I3
SE m±
LSD (5%)
Nitrogen levels
N0
N1
N2
N3
SE m±
LSD (5%)
N
REN (%)
P
K
111.9
108.9
102.2
2.16
50.5
52.3
47.8
28.8
30.0
26.4
132.3
135.1
123.8
-
0.59
2.07
5.52
-
1.5
5.29
69.1
105.4
120
135.1
2.10
44.9
51.0
54.6
19.8
28.7
30.2
34.8
95.9
132.6
138.2
155
-
0.58
2.88
5.42
-
1.49
7.44
813
Int.J.Curr.Microbiol.App.Sci (2018) 7(12): 809-818
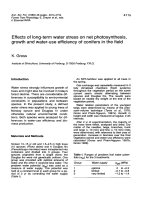
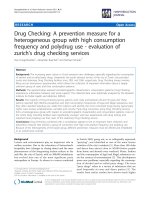
Fig.1 Relationship of physiological parameters and grain yield of rice as affected by irrigation
regimes and nitrogen levels
814
Int.J.Curr.Microbiol.App.Sci (2018) 7(12): 809-818
Table.4 Effect of irrigation regimes on water productivity and water saving
Irrigation
regimes
No. of
irrigations
Irrigation
Rain
(mm)
Total water
use (mm)
Water
saving
(%)
Water
productivity
(kg/m3)
2015
2016
2015
2016
2015
2016
2015
2016
2015
2016
2015
2016
I1
26
30
1300
1500
633
285
1933
1785
-
-
0.32
0.34
I2
13
17
650
850
633
285
1283
1135
33.6
36.4
0.49
0.54
I3
9
10
450
500
633
285
1083
785
44.0
56.0
0.53
0.70
significantly reduced in I3. On averaged there
was increase of 38, 44 and 61% increase in K
uptake at N1, N2 and N3 over N0, respectively.
The N recovery efficiency decreased at I2 and
I3.
Relationship of growth and physiological
parameters with grain yield
Coefficients worked out between the growth
parameters and yield demonstrated a
signification and positive correlation (Fig. 1).
The correlation coefficients recorded between
the grain yield and tillers/m2, grain yield and
LAI, grain yield and PAR intercepted, grain
yield and root dry weight, grain yield and
SPAD were 0.94, 0.97, 0.89, 0.73 and 0.99.
This indicates that the grain yield is actually
dependent on these growth and physiological
parameters.
Water use and water productivity
The no of irrigations required in I2 and I3 was
far lesser than the I1 irrigation regime (Table
4). The no of irrigations and irrigation water
applied during 2015 was lower in 2015 than
2016. The rain received during the cropping
season in 2015 was 633 and 285 mm in 2016.
Total water use in 2016 was lower than 2015
that resulted in higher water saving in 2016.
Water saving in I2 ranged between 33 to 36%
where as it ranged between 44 to 56% in I3
over I1. Intermittent irrigation in I2 and I3
resulted in considerably higher water
productivity over I3.
Nutrient uptake and N use efficiency
I1 and I2 had at par N uptake but there was
decrease of about 9% in I3 (Table 3). Since N
has strong on dry matter accumulation, it
significantly affected N, P and K uptake. On
an average, N uptake increased by 53, 73 and
99% in N1, N2 and N3 over N0, respectively.
Similarly P uptake was at par in I1 and I2 but
decreased significantly in I3. Data averaged
over two years revealed that I3 resulted in
about 10% reduction in P uptake. Nitrogen
stimulates the growth of both above and
below ground plant parts and therefore
influenced the uptake and partitioning of
other nutrients. The total P uptake increased
by 45, 52 and 76% at N1, N2 and N3,
respectively. Likewise K uptake was also
significantly affected by irrigation regimes, I1
and I2 recorded at par K uptake but the same
It was observed a significant influence of
different water management practices and N
levels on plant growth, physiology, yield,
water productivity and soil mineral nitrogen
under temperate conditions of Kashmir.
However no significant interaction effects
between irrigation regimes and nitrogen levels
was noticed. Under aerobic environment,
nitrogen is transformed to nitrate by the
process of nitrification and that is why in I2
and I3 higher amounts on nitrate N were
observed.
The
significantly
superior
performance was observed under 3DAPW
treatment as compared to continuous
815
Int.J.Curr.Microbiol.App.Sci (2018) 7(12): 809-818
(LAI) and more number of tillers/m2. The
higher light utilization capacity and
photosynthetic rate of SRI plants was also
reported by Thakur et al., (2011. The
improved physiological performance in I2
(3DAPW) treatment could be due to greater
activity and development of root system
which increases the transport of cytokinins to
leaves via xylem for maintenance of higher
photosynthetic rate (San-oh et al., 2004).
Yield advantage under 3DAPW practice can
be attributed to better plant phenotypes
(greater root and shoot growth) and improved
physiological performance during the
flowering stage of crop growth. This finally
translated into significantly higher grain and
straw yield. The greater remobilization of
carbon reserves from vegetative parts to
grains caused due to improved root and shoot
growth could also be a reason for higher grain
yield (Zhang et al., 2008). The highest water
productivity was obtained under I3 (6DAPW)
treatment followed by I2 (3DAPW) and I1
(continuous submergence) treatment. Further
I2 and I3 resulted in water saving of 20% and
38% respectively. However, significant
penalty in terms of plant growth and yield in
6DAPW treatment out-weighs the benefits of
its water savings. It is worth mentioning that
when the region (Jammu & Kashmir) already
has a deficit of 0.6 million tonnes (25.0%) of
rice, yield of rice (being the staple food),
cannot be sacrificed at the cost of water
saving. On the other hand the excessive
supply
of
water
under
continuous
submergence conditions far exceeds the needs
of rice plant and goes as wastage (Hidayati et
al., 2016). This assumes significance as
increasing water crisis due to global climate
change scenario threatens the sustainability of
irrigated rice production (Postel, 1997).
submergence. Plants grown under 6DAPW
treatment showed lowest growth. We presume
that severe moisture stress under 6DAPW
treatment reduced growth parameters and
physiological
performance
which
consequently lead to significant decline in
grain and straw yield. Further continuous
submergence also hampered the normal plant
growth to a significant extent. Kima et al.,
(2014) reported that continuous submergence
is not required to produce optimum rice yields
if sufficient water is supplied at critical
growth stages. Maintenance of soil in moist,
non-flooded condition offers an opportunity
for rice plant to develop larger root systems
(Mishra and Salokhe, 2011). Continuous
submergence creates hypoxic conditions and
lowers redox potential of soil which adversely
affect development and activity of roots
(Thakur et al., 2011). The plants grown under
such conditions show a higher percentage of
decayed roots, more vulnerability to drought
stress
and
attenuated
physiological
performance (Kar et al., 1974). Due to
alternate wetting and drying sufficient oxygen
is supplied to the root system. This inhibits
soil nitrogen immobilization and accelerates
oxidation of soil organic matter which
consequently improves the soil fertility to
favour rice growth (Bouman, 2007). Nguyen
et al., 2009 reported that leaf elongation
increases significantly when soil is kept just
saturated and not flooded. We attribute higher
LAI observed under 3DAPW treatment to
higher number of tillers m-2 and greater leaf
size. Earlier Tadesse et al., (2013) reported
that continuous submergence reduces leaf
area index, tiller count and crop growth rate.
The relatively higher weight and volume of
roots observed under 3DAPW treatment can
be regarded as a plant adoption strategy to
accrue water and nutrient absorption capacity
(Kima et al., 2014; Ascha et al., 2005). The
greater interception of photosynthetically
active radiation (PAR) in 3DAPW treatment
could be related to higher leaf area index
In the present study we observed the best
response in terms of growth, physiology,
water productivity and yield at N3 (120 kg)
rate of N application. However, plant
816
Int.J.Curr.Microbiol.App.Sci (2018) 7(12): 809-818
response was on an increasing trend even at
the highest rate (120 kg/ha). A significant
effect of irrigation regimes was recorded on
N, P and K plant uptake. I1 and I2 had at par
N, P and K uptake but significantly higher
that than I3. Lower grain and straw yield
contributed to lower N, P and K uptake in I3
level of irrigation. Increased level of N, P and
K uptake at higher N level is attributed to
higher biomass production at higher N levels.
N recovery efficiency decreased slightly in I2
and I3. Higher nitrification rates and lower
grain and straw yield in I2 and I3 resulted in
lower N recovery. However, relatively higher
N recovery efficiency was recorded at higher
N levels. Total water used during 2016 was
lower than that of 2015 that resulted in higher
water productivity. Highest water productivity
was recorded in I3 due to longer drying period
and reduced water requirement. However
there was a significant reduction in the grain
yield in I3 and there not economically viable.
a
long-term
experiment
under
supplementary irrigation in humid
Argentina. Agr Water Manage 95 (12):
1361–1372.
Ascha, F., Dingkuhn, M., Sow, A. and
Audebert, A. 2005. Drought-induced
changes in rooting patterns and
assimilate partitioning between root and
shoot in upland rice. Field Crops Res
93: 223–236.
Barker, R., Dawe, D., Tuong, T. P., Bhuiyan
S. I. and Guerra, L. C. 1999. The
outlook for water resources in the year
2020: challenges for research on water
management in rice production. In:
Assessment and Orientation towards the
21st Century. Proceedings of the 19th
Session of the International Rice
Commission, 7–9 September 1998,
Cairo, Egypt. Food and Agriculture
Organization, pp. 96–109.
Bouman, B. A. M. and Tuong, T.P. 2001.
Field water management to save water
and increase productivity in lowland
irrigated rice. Agric Water Manage
49:11–30.
Bouman, B. A. 2007. Conceptual framework
for the improvement of crop water
productivity at different spatial scales.
Agric Syst 93: 43–60.
Hidayati N, Triadiati and Anas, I. 2016.
Photosynthesis and transpiration rates of
rice cultivated under the system of rice
intensification and the effects on growth
and yield. HAYATI Journal of Biosci
xxx: 1-6.
Kar, S., Varade, S. B., Subramanyam, T. K
and Ghildyal, B. P. 1974. Nature and
growth pattern of rice root system under
submerged and unsaturated conditions.
Riso (Italy) 23:173–179.
Keeney, D. R. and Nelson, D. W. 1982.
Nitrogen—Inorganic
forms.
In:
Methods of soil analysis. Part 2 (Eds.
A.L. Page et al.). Chemical and
microbiological properties. 2nd ed.
In conclusion, this study demonstrates that
with a certain water management practice it is
possible to concurrently achieve the dual
target of increasing rice yield and decreasing
the water requirements for irrigated rice. The
irrigation regime I2 i.e irrigation 3 days after
the disappearance of ponded water, results in
highest grain yield. Although I3 resulted in
highest water productivity but the same was
achieved at the cost of grain yield. Among the
N levels grain yield increased significantly
upto N3 i.e 120 kg N/ha.
Acknowledgement
The authors are grateful to University Grants
Commission, New Delhi (Govt. of India) for
funding the research project.
References
Aparicio, V. J. L., Costa, J. L. and Zamora,
M. 2008. Nitrate leaching assessment in
817
Int.J.Curr.Microbiol.App.Sci (2018) 7(12): 809-818
Agron. Monogr. 9. ASA and SSSA,
Madison, WI. p. 642–698.
Kima, A. S., Chung, W. G., Wang, Y. M. and
Traore, S. 2014. Evaluating water
depths for high water productivity in
irrigated lowland rice field by
employing alternate wetting and drying
technique under tropical climate
conditions, southern Taiwan. Paddy
Water Environ 13: 379–389.
Postel, S. 1997. Last Oasis: Facing Water
Scarcity. Norton and Company, New
York, p. 239
Mishra, A., Salokhe, V. M. 2010. The effects
of planting pattern and water regime on
root morphology physiology and grain
yield of rice. J. Agron. and Crop Sci
196:368–378.
San-oh, Y., Mano, Y., Ookawa T, and
Hirasawa T. 2004. Comparison of dry
matter production and associated
characteristics between direct sown and
transplanted rice plants in a submerged
paddy field and relationships to planting
patterns. Field Crops Res 87:43–58.
Steel, R. G. D, Torrie, J. H. and Dickey, D. A.
1997. Principles and procedures of
statistics: a bio–metrical approach, 3rd
edn. McGraw Hill Book Co., Inc., New
York.
Tadesse, T., N. Dechassa, W. Bayu, and S.
Gebeyehu. 2013. Effects of farmyard
manure
and
inorganic
fertilizer
application on soil physio-chemical
properties and nutrient balance in rainfed lowland rice ecosystem. Am. J.
Plant Sci., 04: 309–316.
Thakur, A. K., Rath, S., Patil D. and Kumar
A. 2011. Effects on rice plant
morphology and physiology of water
and associated management practices of
the system of rice intensification and
their implications for crop performance.
Paddy Water Environ 9: 13–24.
Tuong, T. P. and Bouman, B. A. M. 2003.
Rice production in water-scarce
environments. In: Proceedings of the
Water Productivity Workshop, 12–14
November 2001, Colombo, Sri Lanka.
International
Water
Management
Institute, Colombo, Sri Lanka.
Uphoff, N. 2012. Supporting food security in
the 21st century through resourceconserving increases in agricultural
productivity. Agric Food Security, 1:18
Yang, J. and Zhang, J. 2010. Crop
management techniques to enhance
harvest index in rice. J Exp Bot
61:3177–3189
Zhang, Z., Zhang, S., Yang, J. and Zhang, J.
2008. Yield, grain quality and water use
efficiency of rice under non-flooded
mulching cultivation. Field Crops Res,
108:71-81.
How to cite this article:
Ashaq Hussain, Aabid Hussain Lone, M. Anwar Bhat, Manzoor A. Ganai, Latief Ahmad, S.
Sheeraz Mehdi and Jehangir, I.A. 2018. Moderate Drying and Higher N Increases the Yield and
Water Use Efficiency of Rice Established Through System of Rice Intensification (SRI)
Method. Int.J.Curr.Microbiol.App.Sci. 7(12): 809-818.
doi: />
818