Physico-chemical analysis of groundwater samples in Karur district, Tamil Nadu, India
Bạn đang xem bản rút gọn của tài liệu. Xem và tải ngay bản đầy đủ của tài liệu tại đây (627.91 KB, 15 trang )
Int.J.Curr.Microbiol.App.Sci (2018) 7(10): 3296-3310
International Journal of Current Microbiology and Applied Sciences
ISSN: 2319-7706 Volume 7 Number 10 (2018)
Journal homepage:
Original Research Article
/>
Physico-Chemical Analysis of Groundwater Samples in Karur District,
Tamil Nadu, India
Nimmi Kuruppath1*, A. Raviraj2, Balaji Kannan3 and K.M. Sellamuthu4
1
Department of Soil and Water Conservation Engineering, Agricultural Engineering College
& Research Institute, 2Department of Soil and Water Conservation Engineering, Water
Technology Centre, 3Department of Remote Sensing and GIS, 4Department of Soil Science
and Agricultural Chemistry, Tamil Nadu Agricultural University, Coimbatore, India
*Corresponding author
ABSTRACT
Keywords
Physico-Chemical
Analysis, Groundwater,
pH, Electrical
Conductivity (EC)
Article Info
Accepted:
24 September 2018
Available Online:
10 October 2018
Due to industrialization and urbanization the problem of providing good quality water for
drinking and irrigation has become very critical now in Karur district. Hence, in this study,
emphasis has been given to water quality for drinking and irrigation in Karur district. In
order to assess the groundwater quality, samples were collected from Aravakurichi and K.
Paramathi block and analysis for pH, Electrical Conductivity (EC), major cations like
calcium, magnesium, sodium, potassium and anions like chloride, sulphate, carbonates and
bicarbonates were done in the laboratory using the standard methods given by the
American Public Health Association (APHA, 2005). By using the analyzed data, the
chemical indices Sodium Adsorption Ratio (SAR) were calculated. It is found that
majority of the locations in both the blocks have high levels of calcium, magnesium,
chloride and sulphate concentration, while all other were within the permissible limit for
drinking. About 79.9% of area is having EC ranging from 0.75-2.25 dS m-1, which is
classified under doubtful class by USSL for irrigation. Water samples were found suitable
for irrigation with respect to SAR for both the blocks.
Introduction
In addition to over exploitation and water
level decline, groundwater pollution is a major
concern in several regions of India.
Nowadays, dumping of industrial and
domestic waste pose serious threat to
groundwater quality and may reduce the water
availability for irrigation, domestic and
industrial uses. Groundwater quality is the
suitability of groundwater for a certain
purpose. In the present study, it can be defined
as the suitability of groundwater for human
consumption and irrigation. This suitability
depends mostly on the chemical composition
of groundwater. As long as groundwater
quality
is
determined
by
chemical
composition, it can be mapped by showing the
3296
Int.J.Curr.Microbiol.App.Sci (2018) 7(10): 3296-3310
latter in relation to permissible limits for
human consumption. The correlation of
groundwater chemistry with hydrologic and
geologic environments also gives valuable
information to understand the effect of
subsurface hydro geochemical processes and
to properly manage aquifer systems.
Groundwater is the major source of drinking
water in Karur district, Tamil Nadu, India.
Due to industrialization and urbanization the
problem of providing good quality water for
drinking and irrigation has become very
critical now in Karur district. Hence, in this
study, emphasis has been given to water
quality studies, which is one of the important
issues in groundwater management in Karur
district. Quality variation of groundwater in an
area is mainly a function of physical and
chemical
parameters.
Geographical
Information System is an effective tool for
relating and integrating vast volumes of
different data types obtained from different
sources and compiled on different scales.
Thus, in the present study, an attempt has been
made to understand the spatial variation of
groundwater quality and also its suitability for
irrigation using Geographical Information
System techniques.
Materials and Methods
Sample collection and physico-chemical
analysis
The present study focused on analysis of
groundwater in Aravakurichi and K.
Paramathi blocks of Karur district, Tamil
Nadu. The samples were collected from
various locations randomly in 1 litre plastic
bottles. The collected groundwater samples
have been analyzed using standard methods
given by American Public Health Association
(APHA). The details of analytical methods
followed and mapping of parameters using
GIS have been enumerated in this chapter.
The tasks can basically be divided in to the
following categories
Collection of water samples and physicochemical analysis.
Determination of EC, SAR and classify the
groundwater for irrigation suitability as per
US Salinity Laboratory of the Department of
Agriculture.
Application of GIS software in developing
thematic maps.
Sampling stations
Eight samples from Aravakurichi block and
ten samples from K. Paramathi block were
collected for the present study and are listed in
the Table 1. Study Area with sampling stations
is shown in Figure 1.
Water quality parameters
The groundwater samples were analyzed for
ten water quality parameters such as pH,
Electrical Conductivity, Calcium, Magnesium,
Sodium, Potassium, Chloride, Sulphate,
Carbonate and Bicarbonate. By using the
analyzed data, the chemical indices viz.,
Sodium Adsorption Ratio (SAR) is calculated.
Water quality parameters were analysed as per
standard methods given by APHA. The results
were analyzed with the Bureau of Indian
Standard (BIS) for potability and US Salinity
Laboratory (USSL) for irrigation suitability.
Physico- chemical analysis
Samples are analyzed in the laboratory by
using standard methods of analysis (APHA,
1998). High purity (A.R. Grade) chemicals
and double distilled water is used for
preparing standard solutions for analysis.
Various physical parameters like pH and EC
are determined on the spot with the help of
3297
Int.J.Curr.Microbiol.App.Sci (2018) 7(10): 3296-3310
digital portable pH meter and Conductivity
meter. The chloride ions are determined by
titrating the water samples against a standard
solution of AgNO3 using potassium chromate
as an indicator. Calcium (Ca2+), Magnesium
(Mg2+), Carbonate (CO32-) and Bicarbonate
(HCO3-) are also determined by volumetric
titration methods. While Sodium (Na+) and
Potassium are determined by Flame
photometry as recommended by APHA.
Sulphates (SO4-) are estimated by Turbidity
method using spectrophotometer (Kristina
Furn (2003), Sivakumar et al., (2010),
Krishnaraj et al., (2013).
Global Positioning System (GPS) data
collection
Latitude and Longitude data for all selected
stations in the study area have been recorded
with Global Positioning System (GPS).
Irrigation water suitability as per USSL
classification
suitability of water for irrigation as per the
criteria suggested by the US Salinity
Laboratory of the Department of Agriculture.
The classification of water as per USSL is
presented in Table 2 to 4. The spatial
distribution maps for EC and SAR are
generated on the basis of different categories
of groundwater samples, using ArcGIS 10.1
software depicting the places of Saline and
Alkali waters in the blocks.
Parameters selected and their calculation
Parameters selected for the present study are
EC and SAR. From the analysed data, Sodium
Absorption ratio (SAR) is calculated by the
following= equations. +√++ +++ / 2
(All values of cations and anions are in me
L-1)
Significance of selected parameters for
Irrigation
Electrical Conductivity (EC)
Due to urbanization and industrialization, the
groundwater is being polluted in several major
cities of the country. The groundwater
resources are often over exploited to meet the
increasing demand by the people. Sometimes
groundwater contains various minerals and
salts in solution at elevated concentrations
posing danger to the human conception or
utility. The open well or tube well waters are
expected to contain more dissolved salts of the
sodium, calcium and magnesium and their use
in irrigation results in the increase of the
salinity of the soil and thereby the loss of
fertility. Further, the presence of accumulated
amounts of high concentration of carbonate
and bi-carbonates of alkali or alkaline earth
metals, turns to be responsible for the
dispersion of soil particles that ultimately
reduces porosity of the soil and thereby the
loss of fertility. In the present study, the
collected water samples were classified on
The most influencing water quality guideline
on crop productivity is the salinity hazard as
measured by electrical conductivity (EC). The
primary effect of high EC water on crop
productivity is the inability of the plant to
compete with ions in the soil solution for
water. The higher the EC, the less water is
available to plants, even though the soil may
appear wet, because plants can only transpire
“pure” water, usable plant water in the soil
solution decreases dramatically as EC
increases. Classification of groundwater based
on salinity hazard is presented in Table 2.
Sodium Adsorption Ratio (SAR)
Excessive amount of salt in general and
sodium in particular affect the soil
permeability, soil structure and create toxic
condition for plants. Sodium in irrigation
3298
Int.J.Curr.Microbiol.App.Sci (2018) 7(10): 3296-3310
water is generally taken up by the clay soil in
return of calcium and magnesium due to ion
exchange. It leads to the development of alkali
soil, which has unfavourable structure and
resists aeration. To quantify this effect an
empirical parameter termed as SAR is used.
The sodium hazard classes based on USSL
classification is given in Table 3. Based on
SAR values, water can be classified as
excellent (10), good (10-18), doubtful (18-26),
and unsuitable (>26).
Application of GIS in developing thematic
maps Creation of data base
The physico-chemical parameters such as pH,
chloride, calcium, magnesium, sodium,
potassium, sulphate, EC and SAR of
groundwater were analyzed using standard
procedures and a database was prepared on
excel. The database was then inserted into
ArcGIS 10.1 software for creating spatial
distribution map.
analyzed for ten water quality parameters.
pH
The range of pH is from 6.98 to 8.10 in K.
Paramathi block and 7.37 to 7.97 in
Aravakurichi block.
The average pH is 7.65 and 7.75 in K.
Paramathi block and Aravakurichi block
respectively. Most of the stations in the study
area show neutral range of pH values.
EC
EC value ranges from 0.71 dS m-1 to 3.01 dS
m-1 in K. Paramathi block and 0.65 dS m-1 to
4.42 dS m-1 in Aravakurichi block. The
average EC is 1.59 dS m-1 and 2.13 dS m-1 for
K. Paramathi block and Aravakurichi block
respectively.
Calcium
Calcium in the K. Paramathi sampling stations
ranges from 51.30 to 307.80 mg L-1 and
102.60 to 432.84 mg L-1 in Aravakurichi.
Generation of maps
Raster interpolation technique, Inverse
distance weighted (IDW) of spatial analyst
module were used to generate the thematic
map. Sampling locations in excel were
imported into the base map as point layer and
the thematic maps were generated using IDW,
the output was then reclassified and mapped
according to the permissible limits.
Magnesium
Magnesium in the sampling stations in K.
Paramathi ranges from 52.01 mg L-1 to 463.98
mg L-1 and in Aravakurichi the minimum
concentration of 42.19 mg L-1 is found in
Eurumarpatti village and maximum of 315.65
mg L-1 in Pallapatti village.
Results and Discussions
Sodium
Assessment of groundwater quality
Physiochemical analysis
This chapter elaborates the physiochemical
characteristics in the selected locations,
suitability for irrigation etc. Water samples
collected during the year 2015 have been
Sodium concentration in K. Paramathi block
ranges from 28 mg L-1 to 150 mg L-1.
Eurumarpatti village of Aravakurichi block
has less sodium concentration of 65.69 mg L-1
and maximum concentration is (165.0 mg L-1)
at Pallapatti village.
3299
Int.J.Curr.Microbiol.App.Sci (2018) 7(10): 3296-3310
Carbonates
In K. Paramathi, carbonate concentration
ranged from zero to 192.02 mg L-1. Most of
the locations in Aravakurichi block have zero
carbonate concentration and maximum
concentration is 96.01 mg L-1 in Santhapadi
(b).
east (645.49 mg L-1). The range of pH for all
the stations is within the permissible limit of
6.5 to 8.5. It is found that majority of the
locations in both the blocks have high levels
of calcium, magnesium, chloride and sulphate
concentration. The list of sample locations
exceeding permissible values for potability
with reference to pH, Calcium, Magnesium,
Chloride and Sulphates are given in Table 4.
Chloride
The chloride value is minimum (56.72 mg L-1)
in Kodanthur village and maximum (709.06
mg L-1) in Vairamadai of K. Paramathi block.
While in Aravakurichi block the minimum
concentration of 85.08 mg L-1 is recorded at
Eurumapatti
village
and
maximum
-1
concentration of 893.41 mg L is recorded at
Pungambadi east. Chloride concentration in
most of the sample were found more than the
desirable level (250 mg L-1) stipulated by BIS
for potability, yet these values are well below
the maximum permissible limit (1000 mg L-1).
Bicarbonates
In
K.
Paramathi
block
bicarbonate
concentration ranged from 73.21 mg L-1 to
268.47 mg L-1. Aravakurichi block have
bicarbonate concentration ranging from 73.21
mg L-1 to 244.06 mg L-1.
Irrigation suitability
The important factors that influence the
irrigation water quality are salt and sodium
concentrations as represented by Electrical
Conductivity (EC) and Sodium Adsorption
Ratio (SAR). Excessive amount of salt in
general and sodium in particular affect the soil
permeability, soil structure and create toxic
(Table 5).
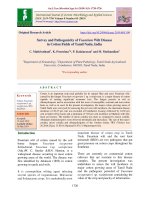
Sendamangalam Santhapadi showed high
salinity with respect to EC. Only Kodanthur
and Eurumarpatti are under medium salinity.
As per irrigation classification by USSL most
of the locations are classified under doubtful
class and four location samples are unsuitable
for irrigation. Kodanthur and Eurumarpatti
villages of K. Paramathi and Aravakuichi
block respectively area classified as good. The
classification of groundwater as per USSL for
irrigation is presented in Table 6.
Potassium
Minimum potassium concentration (3.05 mg
L-1) is found in surface water source in
Rajapuram village of K. Paramathi block and
maximum
is
71.71
mg
L-1
in
Chinnadarapuram.
Sulphate
Sulphate concentration in K. Paramathi block
ranges from 142.99 mg L-1 to 778.97 mg L-1
and in Aravakurichi block minimum
concentration of 26.99 mg L-1 is recorded in
Pallapatti village and maximum at Pungambai
Sodium Adsorption Ratio (SAR) and its
significance
Excessive amount of salt in general and
sodium in particular affect the soil
permeability, soil structure and create toxic
condition for plants. The classification of
groundwater with respect to SAR as per USSL
irrigation suitability is presented in Table 7.
All the eighteen stations, in both the blocks
are categorised under S1 class that indicates
excellent irrigation quality with respect to
SAR.
3300
Int.J.Curr.Microbiol.App.Sci (2018) 7(10): 3296-3310
Thematic maps
parameters
of
physico-chemical
Thematic maps for potability
Thematic maps of pH, calcium, chloride,
magnesium, sodium, potassium and sulphate
were prepared using Inverse Distance
Weighted (IDW) tool in ArcGIS 10.1
software. These maps were classified based on
the permissible limit for potability and
mapped. The percentage distribution for each
of the parameters is also calculated.
pH
All the locations are having normal pH range
of 6.5-8.5. For mapping purpose pH was
reclassified into three classes viz., 7.3 to 7.6,
7.6 to 7.7 and 7.7 Figure 2 shows the spatial
distribution of pH for the study area.
Calcium
Calcium is reclassified into three classes <75
mg L-1, 75-200 mg L-1 and >200 mg L-1 and
mapped as shown in Figure 3. About 61% of
the area was found to have a concentration
range of 75-200 mg L-1, which covers almost
Aravakurichi block. Only 5.3% of the area is
within the desirable value of 75 mg L-1. The
rest of the area (38%) is having concentration
>200 mg L-1.
Chloride
Most of the area (78%) had chloride in the
range of 250-600 mg L-1 followed by <250 mg
L-1 of 13.5%, 8.24% of area is having
concentration of >600 mg L-1.Figure 4 shows
the spatial distribution of chloride.
Magnesium
The concentration of magnesium was found to
be more than the permissible limits (30 mg
L-1) in all the locations. About 6.36% of area
is having magnesium concentration in the
range 45-100 mg L-1. 93% of the area is
having very high concentration more than
maximum permissible value of 100 mg L-1.
Figure 5 shows the spatial distribution of
magnesium.
Sodium
Sodium concentration in study areas shows
variations from 28 mg L-1 to 165 mg L-1. It is
reclassified into three classes namely <50 mg
L-1, 50-100 mg L-1 and >100 mg L-1 (Figure
6).
All locations were within the permissible
limits (200 mg L-1).
Potassium
Potassium is classified into three classes viz.,
<20 mg L-1, 20-40 mg L-1 and >40 mg L-1 as
shown in Figure 7. About 56.33% of the area
is having concentration < 20 mg L-1, 29.72%
of area under 20-40 mg L-1 and >40 mg L-1
concentration is covered by 13.94% of the
area.
Sulphates
The concentration of sulphate was found to be
more than the permissible limits (200 mg L-1)
in all the locations except Pallapatti,
Nagamballi and Kodanthur. Sulphate is
classified into four classes namely <200 mg
L-1, 200-400 mg L-1, 400-600 mg L-1 and >600
mg L-1 (Figure 8).
About 70% of the area is having concentration
200-400 mg L-1 and 24.9% with 400-600 mg
L-1. Two locations Pungambadi (E) and
Vairamadai in Aravakurichi and K. Paramathi
block respectively is having very high
concentration of sulphate (>600 mg L-1).
3301
Int.J.Curr.Microbiol.App.Sci (2018) 7(10): 3296-3310
Table.1 Selected sampling stations in Aravakurichi and K. Paramathi block
Sr. No
Block
Village
Well type
Latitude
Longitude
1
2
3
4
5
6
7
K.Paramathi
K.Paramathi
K.Paramathi
K.Paramathi
K.Paramathi
K.Paramathi
K.Paramathi
Bore well
Bore well
Bore well
Bore well
Bore well
Bore well
Surface water
10.95
10.93
10.94
10.93
11.00
11.01
10.85
77.96
77.83
77.78
77.79
77.79
77.92
77.84
8
K.Paramathi
Bore well
10.85
77.85
9
10
11
12
13
14
15
16
17
18
K.Paramathi
K.Paramathi
Aravakurichi
Aravakurichi
Aravakurichi
Aravakurichi
Aravakurichi
Aravakurichi
Aravakurichi
Aravakurichi
Puthukkanalli
Thennilai
Vairamadai
Kodanthur
Poondipalayam
Kuppam
Chinnadharapuram
(a)
Chinnadharapuram
(b)
Rajapuram (a)
Rajapuram (b)
Nagamballi
Kodaiyur
Pungambadi (E)
Pallapatti
Eurumarpatti
Sendamangalam
Santhapadi (a)
Santhapadi (b)
Bore well
Open well
Bore well
Bore well
Bore well
Bore well
Bore well
Open well
Bore well
Open well
10.81
10.81
10.81
10.88
10.76
10.72
10.71
10.68
10.75
10.78
77.88
77.88
77.92
77.98
77.96
77.90
77.96
77.85
77.83
77.82
Table.2 Salinity hazard classes based on USSL classification
Salinity hazard class
C1
C2
C3
C4
EC (micromhos cm-1)
100-250
250-750
750-2250
>2250
Remark
Low
Medium
High
Very high
Table.3 Sodium hazard classes based on USSL classification
Sodium Hazard class
SAR
Remark
S1
S2
S3
S4
<10
10-18
18-26
>26
Low
Medium
High
Very high
3302
Int.J.Curr.Microbiol.App.Sci (2018) 7(10): 3296-3310
Table.4 List of the stations exceeding permissible values for potability as per BIS
Parameter
Permissible limit
Remark
Areas exceeding permissible values for potability
pH
6.5 to 8.5
Beyond this range the water
Will affect
the mucous
membrane and / or water
Nil
supply system
Encrustation in water supply
75 mg L-1
Calcium as Ca
Magnesium as Mg
structure and adverse effects
on domestic use
30 mg L-1
-
250 mg L-1
Beyond
this
limit
corrosion and palatability are
Chloride as Cl
Puthukkanalli,
Thennilai,
Sendamangalam,
Pallapatti, Rajapuram,
Poondipalayam,
Kuppam, Vairamadai, Nagamballi, Pungambadi(E)
Santhapadi,
All locations
effected
Beyond
intentional
Sulphate as SO4
Eurumarpatti,
Santhapadi,
Chinnadarapuram,
Kodaiyur,
this
tats,
causes
gastro
irritation
when
200 mg L-1
magnesium
present
or sodium are
Chinnadarapuram,
Kuppam,
Sendamangalam,Chinnadharapuram
Rajapuram,
Santhapadi,
Rajapuram,
Vairamadai, Pallapatti, Nagamballi, Pungambadi(E)
Eurumarpatti,
Rajapuram,
Puthukkanalli,
Thennilai,
Sendamangalam
Santhapadi,
Chinnadharapuram, Kodaiyur,
Rajapuram,
Santhapadi, Kuppam,
Poondipalayam,
Pungambadi(E),
Vairamadai
(Source: Maruthi, 2013)
Table.5 Salient features of groundwater samples for irrigation suitability for K. Paramathi and
Aravakurichi block
Sr. No
Village
pH
SAR
EC
-1
dS m
1
2
3
4
5
6
7
8
9
10
11
12
13
14
15
16
17
18
K. Paramathi block
Puthukkanalli
Thennilai
Vairamadai
Kodanthur
Poondipalayam
Kuppam
Chinnadharapuram (a)
Chinnadharapuram (b)
Rajapuram (a)
Rajapuram (b)
Aravakurichi block
Nagamballi
Kodaiyur
Pungambadi (East)
Pallapatti
Eurumarpatti
Sendamangalam
Santhapadi (a)
Santhapadi (b)
3303
7.72
7.49
7.55
7.30
7.80
8.10
7.73
7.82
6.98
7.97
3.24
3.29
1.09
0.72
1.41
2.63
1.85
2.85
2.64
2.51
1.36
1.13
3.01
0.71
1.15
1.56
2.06
1.27
1.54
2.06
7.93
7.63
7.69
7.37
7.75
7.92
7.97
7.77
1.48
2.33
1.98
2.12
1.94
2.31
1.95
2.36
4.42
1.30
3.28
3.06
0.65
1.50
1.65
1.16
Int.J.Curr.Microbiol.App.Sci (2018) 7(10): 3296-3310
Table.6 Salinity hazard classification based on USSL classification
Sr. No
Village
EC dS m
-1
Classification
K.Paramathi block
Puthukkanalli
Thennilai
Vairamadai
Kodanthur
Poondipalayam
Kuppam
Chinnadharapuram (a)
Chinnadharapuram (b)
Rajapuram (a)
Rajapuram (b)
1
2
3
4
5
6
7
8
9
10
1.37
1.13
3.01
0.71
1.15
1.56
2.06
1.27
1.54
2.06
C3
C3
C4
C2
C3
C3
C3
C3
C3
C3
Aravakurichi block
11
12
13
14
15
16
17
18
Nagamballi
Kodaiyur
Pungambadi (East)
Pallapatti
Eurumarpatti
Sendamangalam
Santhapadi (a)
Santhapadi (b)
4.42
1.30
3.28
3.06
0.65
1.50
1.69
1.16
C4
C3
C4
C4
C2
C3
C3
C3
Table.7 Classification of Groundwater as per Sodium Adsorption Ratio (SAR)
Sr. No
Village
SAR
Classification
3.24
3.29
1.09
0.72
1.41
2.63
1.85
2.85
2.64
2.51
S1
S1
S1
S1
S1
S1
S1
S1
S1
S1
K.Paramathi block
Puthukkanalli
Thennilai
Vairamadai
Kodanthur
Poondipalayam
Kuppam
Chinnadharapuram (a)
Chinnadharapuram (b)
Rajapuram (a)
Rajapuram (b)
1
2
3
4
5
6
7
8
9
10
Aravakurichi block
11
Nagamballi
1.48
S1
12
13
14
15
16
17
18
Kodaiyur
Pungambadi (East)
Pallapatti
Eurumarpatti
Sendamangalam
Santhapadi (a)
Santhapadi (b)
2.33
1.98
2.12
1.94
2.31
1.95
2.36
S1
S1
S1
S1
S1
S1
S1
3304
Int.J.Curr.Microbiol.App.Sci (2018) 7(10): 3296-3310
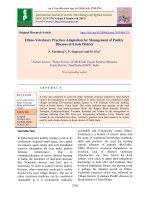
Fig.1 Water sample location map
Fig.2 Thiessen polygon map showing the rain gauge stations and observation wells in
Aravakurichi and K. Paramathi block
3305
Int.J.Curr.Microbiol.App.Sci (2018) 7(10): 3296-3310
Fig.3 Water sample location map
Fig.4 Thematic map of Sodium
Concentration in water
Fig.5 Thematic map of Potassium
Concentration in water
3306
Int.J.Curr.Microbiol.App.Sci (2018) 7(10): 3296-3310
Fig.6 Thematic map of sulphate concentration in water
Fig.7 Thematic map of EC Figure 4.30 Thematic map of SAR
3307
Int.J.Curr.Microbiol.App.Sci (2018) 7(10): 3296-3310
Fig.8 Thematic map of pH
Concentration in water
Fig.9 Thematic map of Chloride
Concentration in water
Fig.10 Thematic map of Calcium concentration in water Figure 11 Thematic map of Magnesium
concentration in water
3308
Int.J.Curr.Microbiol.App.Sci (2018) 7(10): 3296-3310
Thematic maps for irrigation suitability (EC
and SAR)
All the locations are having pH within the
permissible limit (6.5-8.5).
The thematic maps for spatial distribution are
generated on the basis of different categories of
groundwater samples, depicting the places of
Saline and Alkali waters in the blocks. The
prepared thematic maps of Aravakurichi and K.
Paramathi blocks for EC and SAR are shown in
Figures 9 and 10.
Most of the locations are under high salinity
category, whereas a few locations like
Vairamadai, Pallapatti Pungambadi (East),
Nagamballi have very high salinity.
Conductivity, Calcium, Magnesium, Sodium,
Potassium, Chloride, Sulphates, Carbonate and
Bicarbonate.
To determination EC, SAR and classify the
groundwater for irrigation suitability as per USS
(iii) to generate various thematic maps of water
quality parameters using Remote Sensing and
Geographical Information system. Eight
samples from Aravakurichi block and ten
samples from K. Paramathi block were selected
for the present study. Latitude and Longitude
values for all locations were measured with
Global Positioning System (GPS) and plotted in
the base map. The collected groundwater
samples have been analyzed in Water
Technology Centre Laboratory, Tamil Nadu
Agricultural University using standard methods
given by American Public Health Association
(APHA). Samples were also classified
representing salinity and alkalinity as per the
criteria suggested by the US Salinity
Laboratory. Finally ArcGIS10.1 software has
been used for generating thematic maps for
various water quality parameters, SAR map.
The results derived from the groundwater
quality are summarised and given below
The final output has been given in the spatial
representation of groundwater quality in the
study area. The analysis indicates that the
groundwater of the study area needs some
degree of treatment before consumption. The
study helps to understand the quality of water as
well as to develop suitable management
practices to protect the groundwater sources.
It is found that majority of the locations in both
the blocks have high levels of calcium,
magnesium,
chloride
and
sulphate
concentration.
Chloride concentration in most of the sample
was found to be more than desirable level (250
mg L-1) stipulated by BIS.
Most of the area (78%) had chloride in the
range of 250-600 mg L-1 followed by <250 mg
L-1 of 13.5%, 8.24% of area is having
concentration of >600 mg L-1.
EC Calcium concentration of 75-200 mg L1covered about 61% of Electrical Conductivity
(EC) is classified into four categories the area,
which covers almost Aravakurichi block. Only
5.3% of namely, <0.75, 0.75-2.25 and >2.25 dS
m-1. About 79.9% of area the area is within the
desirable value of 75 mg L-1.The rest of the is
having EC ranging from 0.75-2.25 dS m-1,
which is classified area (38%) is having
concentration >200 mg L-1 under C3 class by
USSL as per salinity hazard class.
SAR
Sodium Adsorption Ratio (SAR) is within the
permissible limit, and is classified under S1
class as per USSL. It is mapped based on three
classes viz., 0.7-1.5 (6.68%), 1.5-2.4 (72.08%)
and 2.4-3.2 (21.22%).
Assessment of groundwater quality
Groundwater is the major source of drinking
water in Karur district, Tamil Nadu, India. Due
to industrialization and urbanization the
problem of providing good quality water for
drinking and irrigation has become very critical
3309
Int.J.Curr.Microbiol.App.Sci (2018) 7(10): 3296-3310
now in Karur district. The present study was an
attempt to study the current groundwater quality
of the two blocks, Aravakurichi and K.
Paramathi of Karur district. The objectives of
the study were (i) to analyze ten water quality
parameters such as pH, Electrical
About 6.36% of area is having magnesium
concentration in the range 45-100 mg L-1. 93%
of the area is having very high concentration
more than maximum permissible value of 100
mg LThe concentration of sulphate was found to be
more than the permissible limits (200 mg L-1) in
all the locations except Pallapatti, Nagamballi
and Kodanthur. About 70% of the area is
having concentration 200-400 mg L-1 and
24.9% with 400-600 mg L-1. Two locations
Pungambadi
(E)
and
Vairamadai
in
Aravakurichi and K. Paramathi block
respectively were found to have very high
concentration of sulphate (>600 mg L-1). About
79.9% of area is having EC ranging from 0.752.25 dS m-1, which is classified under C3 class
by USSL as per salinity hazard class.
Sodium Adsorption Ratio (SAR) is within the
permissible limit, and is classified under S1
class as per USSL.
References
APHA. 1985. Standard methods for the
examination of water and wastewater.
American Public Health Association,
New York. U.S.A.
BIS. 2003. Indian standards specifications for
drinking water, IS: 10500, Bureau of
Indian Standards, New Delhi.
Central Ground Water Board (CGWB), (2009),
Annual report, Tamil Nadu.
Fiedler, F.R. 2003. Simple, Practical method for
determining station weights using
Thiessan Polygons and Isohytel maps.
Journal of Hydrologic Engineering.
ASCE. July/August, 219-221.
Groundwater
Resource
Estimation
Methodology. 2009. Report of the
Groundwater
Resource
Estimation
Committee. Ministry of Water Resources.
Govt. of India, 23-24.
Groundwater year book India 2010-2011,
Central Ground Water Board, Ministry of
Water Resources, Government of India,
CGWB. (2011)
Krishnaraj, S., Sanjiv Kumar and K.P. Elango.
2013. Assessment of groundwater quality
in Karur block of Tamil Nadu using
multivariate techniques: A case study. J.
Envt. Science, Toxicology and Food
Technology. 6(1):36-41.
Kristina Furn. 2003. Effects of dyeing and
bleaching industries on the area around
the Orathupalayam Dam in Southern
India. UG Thesis. ISSN 1401-5765.2004
Maruthi Devi., 2013. Assessment of
groundwater quality and its suitability for
drinking and irrigation purposes of
Prakasam district, Andhra Pradesh, India.
Ph D thesis (unpublished), Andhra
University,
Department
of
Civil
Engineering, Visakapatanam.
Sivakumar, V., M. Asaithambi, N. Jayakumar
and P. Sivakumar. 2010. Assessment of
the Contamination from the Tanneries
and Dyeing Industries on to Kalingarayan
Canal of Tamilnadu. International
Journal of Chem. Tech. Research, 2(2):
774-779.
How to cite this article:
Nimmi Kuruppath, A. Raviraj, Balaji Kannan and Sellamuthu, K.M. 2018. Physico-Chemical
Analysis
of Groundwater
Samples
in Karur
District, Tamil
Nadu,
India.
Int.J.Curr.Microbiol.App.Sci. 7(10): 3296-3310. doi: />
3310