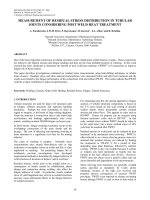
Efficiency measurement of bus routes in Hanoi city: An application of data envelopment analysis (DEA)
Bạn đang xem bản rút gọn của tài liệu. Xem và tải ngay bản đầy đủ của tài liệu tại đây (416.1 KB, 12 trang )
Transport and Communications Science Journal, Vol. 71, Issue 4 (05/2020), 368-379
Transport and Communications Science Journal
EFFICIENCY MEASUREMENT OF BUS ROUTES IN HANOI
CITY: AN APPLICATION OF DATA ENVELOPMENT ANALYSIS
(DEA)
Tran Khac Duong*, Do Quoc Cuong
University of Transport and Communications, No 3 Cau Giay Street, Hanoi, Vietnam
ARTICLE INFO
TYPE: Research Article
Received: 9/3/2020
Revised: 15/4/2020
Accepted: 17/4/2020
Published online: 28/5/2020
/>*
Corresponding author
Email:
Abstract. Efficiency analysis of bus transit at the route level is critical to understand the
existing performance of individual routes within a bus system and identify operational
problems as well as effectively optimise their performance. This article applies the Data
Envelopment Analysis (DEA) model to examine the performance of 38 bus routes in Hanoi,
Vietnam. The results indicated the best and the inefficient bus routes within the given sample
and identified the internal sources of inefficiency, including: number of stops and vehicles.
The findings provide bus agencies in the case study with additional and useful information for
decision making.
Keywords: Data envelopment analysis (DEA), bus performance evaluation, technical
efficiency, operational effectiveness, decision making unit (DMU)
© 2020 University of Transport and Communications
1. INTRODUCTION
Transit agencies aim to continuously optimise their performance and improve the quality
of service in order to increase transit ridership effectively [1, 2]. Measuring the performance
of individual routes within a transit system plays a critical role in identifying problems in
system design, operation and control, and in seeking means to increase ridership effectively.
However, measuring the performance of individual transit routes is complex because multiple
objectives (related to the operators, users, and community), and multiple input and output
variables, exist [3]. The complexity of transit performance led to the development of a
368
Transport and Communications Science Journal, Vol. 71, Issue 4 (05/2020), 368-379
framework by Fielding et al. [4] for transit system performance measurement. This
framework consists of three dimensions; technical efficiency, operational effectiveness, and
service effectiveness (refer to section 2). This framework allows one to compare the
performance of different transit systems for a particular performance concept (such as vehicle
efficiency, fuel efficiency, and operational safety) by using single ratios of service output and
service input. This traditional approach cannot provide a single overall measure for transit
performance evaluation [5]. The issue is addressed by using the Data Envelopment Analysis
(DEA) approach, which allows one to compare the performance of different transit routes
(which is considered as production units) within a transit system by building up the
production frontier directly from an actual dataset and generating the efficiency scores for
individual routes [1-3, 6]. In large urban areas of Vietnam (such as Hanoi and Ho Chi Minh
city), there has been very little work quantitatively examining the performance of transit
routes. Furthermore, there have been no studies, as far as We are aware, using the DEA for
transit route performance evaluation.
This article employs the DEA model to measure the performance of individual bus routes
in Hanoi, Vietnam, considering them as sub-units of a transit system. The scientific
contributions of this article provide: (1) empirical understanding of bus route performance in a
case study of Hanoi using the DEA model; and (2) identification of internal sources of
inefficiency of given bus routes.
The article is structured as follows: Section 2 presents the review of the literature. Section
3 presents the proposed methodology, followed by the details on the dataset used for
empirical analysis, discussion on the results and recommendations in section 4. Finally, the
paper is concluded in section 5.
2. LITERATURE REVIEW
2.1. Transit performance concepts
Fielding et al. [4] have distinguished transit performance into three concepts: technical
efficiency, operational effectiveness, and service effectiveness.
Technical efficiency represents the process through which service inputs are transformed
into outputs. This means that a transit agency invests capital in vehicles, fuel, information
systems, employees, maintenance, and other costs (service inputs). This investment produces
a certain service for a community such as vehicle-km, seat-km, and seat-hours (service
outputs). An agency is considered efficient if it can reduce the inputs to produce a fixed
amount of outputs or increase the outputs while using similar or fewer inputs.
Operational effectiveness indicates the relationship between service inputs and consumed
service. A transit agency spends money to offer its service, and a number of passengers (per
day or week) consume its service. The transit agency will achieve higher operational
effectiveness, if it increases ridership without increasing total cost of producing the services.
Service effectiveness examines the relationship between produced outputs and consumed
service or how well a service offered by operators is consumed by a community [2]. This
means that not all of the services offered (measured by vehicle-km, seat-km, and/or seathours) would be used by a community. If it attracts more passengers without increasing
service or reduces service but still serves a similar number of passengers, it will be more
effective.
369
Transport and Communications Science Journal, Vol. 71, Issue 4 (05/2020), 368-379
2.2. Bus performance measurement
There are three main approaches to measure the performance of the bus system:
• Comparative Analysis (CA);
• Stochastic Frontier Analysis (SFA); and
• Data Envelopment Analysis (DEA)
The early approach applied for bus performance measurement is known as comparative
analysis. This approach normally uses different key performance indicators (KPIs) to compare
the performance of different bus systems with regard to different performance concepts, such
as labour efficiency, vehicle efficiency, fuel efficiency, operating safety, and service
consumption per expense. KPIs are defined as ratios of bus service outputs to service inputs
(revenue vehicle hours per operating expense or passenger trips per revenue vehicle hour).
Fielding et al. [7] defined a wide range of KPIs for comparing the performance of bus
systems. Vuchic [8] provided efficiency ratios (output quantity produced per resource
quantity expended) and utilisation (a ratio of demand to supply) to measure the performance
of a transit system. The Transit Cooperative Research Program Report 88 [9] provided a
process for developing a performance-measurement program, including both traditional and
non-traditional performance indicators.
The CA approach is easy to apply for comparing the performance of bus at the route and
system levels, but for a particular performance concept/indicator. The comparison,
implemented for each KPI separately, leads to different levels of efficiency of one bus system
for different KPIs. This approach, therefore, cannot provide a single overall measure of bus
performance [5].
The latter two approaches, SFA and DEA, are frontier methods, which build up the
frontier production function for evaluating the efficiency level of a set of production units
with multiple inputs and outputs. SFA (a parametric approach introduced independently by
Aigner et al. [10] and Meeusen and van Den Broeck [11]) uses econometric techniques, while
DEA (a non-parametric approach) employs mathematical programming techniques for the
frontier production function estimation. The advantage of the DEA approach is that it does not
require a functional form to estimate the frontier production function. Thus, the DEA
approach was widely used by researchers in transit sector in general and for bus performance
measurement in particular.
2.3. Application of the DEA for bus performance evaluation
The application of DEA models in measuring the bus performance can be divided into
two levels: (1) system; and (2) route level. At the system level, different bus systems within
an area or in different nations are compared with each other, while at the route level bus
routes within a system would be compared to identify the best practices (benchmarks) and
inefficient routes. Comparing the performance of different bus systems plays a key role in
determining the average operational efficiency of a transit system and problems related to the
operation of the whole system, but cannot explore the problems related to the internal
activities of each bus route. On the other hand, the performance evaluation of individual bus
routes within a system substantially provides bus agencies with opportunity to understand its
internal activities [6, 12], and then investigate the internal sources of inefficiency.
370
Transport and Communications Science Journal, Vol. 71, Issue 4 (05/2020), 368-379
Chu and Fielding et al. [5] were pioneers in applying DEA models to measure the
efficiency and effectiveness of public transit agencies in the United States (USA). The output
data for efficiency and effectiveness assessment were annual revenue vehicle hours and
annual unlinked passenger trips respectively. Based on the results of analysis, the authors
reinforced the notion of Hatry [13] that in public agencies, efficiency should be evaluated
separately from effectiveness.
Regarding the existing DEA literature on the field, most studies compare the performance
of different bus systems (bus agencies) [5, 14-19], and a few studies focus on the performance
of bus routes within a system. Sheth et al. [3] expanded the network DEA model of Färe and
Grosskopf [20] to assess the performance of 60 different bus routes within a transit network in
Virginia, USA. In this study, all variables related to the service provider, the users, and the
community were used to compute the DEA efficiency scores. Results obtained help to rank
the performance of these 60 bus routes and capture the relationship among the provider, the
users, and the external and environmental variables related to the urban transit performance.
Barnum et al. [6] employed the DEA model to analyse 46 bus routes of a US transit agency
using weekday data. In the first stage, raw efficiency scores of individual bus routes were
computed by a DEA model without considering the environmental variables. Then in the
second stage, two environmental variables (population density, population), that are beyond
the control of the transit agency, were used to adjust the DEA outputs (Riders and OTP). Then
the adjusted DEA efficiency scores of DMUs are calculated. The results indicated that after
adjusting the raw DEA scores, 20 bus routes became more efficient, 12 did not change, and 14
became less efficient. Lao et al. [1] combined the DEA model and geographic information
system (GIS) to measure the performance of bus lines in a transit system. In this study, GIS
was used to generate the input data for the spatial effectiveness DEA model and visualise the
distribution of bus stops and routes. On the basis of operational efficiency and spatial
effectiveness scores of 24 fixed bus routes, this research ranked the performance of individual
bus routes and demonstrated that GIS can help to analyse the spatial variation of efficiency
and effectiveness against demographic settings. More recently, 60 individual bus lines within
a transit network in Thessaloniki, Greece were examined by a DEA model [2]. For model 1
and 2, input variables included trip length, span of service, and vehicles, while output
variables were revenue seat-km for efficiency measure (model 1) and passengers for
operational effectiveness assessment (model 2). Model 3 aimed at measuring combined
effectiveness (revenue vehicle-km and vehicles are inputs and passengers is output). Along
with calculating the efficiency and effectiveness scores for the three above models, this study
also employed bootstrapping techniques to check robustness of DEA results for models 1 and
2. This sensitivity analysis explained that it is more reliable when correcting obtained scores
for bias.
3. METHODOLOGY
3.1. Data Envelopment Analysis (DEA) model
Data envelopment analysis (DEA) was developed by Charnes, Cooper, and Rhodes
(CCR) in 1978 [21] and later modified by Banker, Charnes and Cooper (BCC) in 1984 [22] .
It builds upon the frontier efficiency concept first elucidated in Farrell [23]. DEA is a nonparametric and empirical modelling based on linear programming and optimization. It is used
widely to measure relative efficiencies of production units (termed as Decision making units,
DMUs) with multi-inputs and multi-outputs.
371
Transport and Communications Science Journal, Vol. 71, Issue 4 (05/2020), 368-379
The modelling process of DEA includes: a) identification of the production frontier (or
isoquant) of a set of comparable DMUs. Within a set of comparable DMUs, those exhibiting
the best use of inputs to produce outputs are identified, and would form an efficient frontier;
and b) measures the efficiency level of each DMU by comparing its production function with
the production frontier [24].
The CCR model measures efficiency of a DMU relative to a reference technology
exhibiting constant returns to scale (CRS) whereas the BCC model exhibits variable
(increasing, constant, or decreasing) returns to scale (VRS) at different points on the
production frontier. Regarding bus performance, due to the constraint of capacity (for instance
bus station capacity) and operating vehicle speed (because of schedule travel time), the output
(passengers) might not have a constant increase when increasing the inputs (bus size, service
frequency etc.). Therefore, the constant return to scale is not always existent. This article,
thus, employs BCC-DEA model for empirical analysis.
3.2. BCC-DEA model
Suppose that each DMUj (j=1…n) uses m inputs xij (i=1…m) to generate s outputs yrj
(r=1…s), and the vi, ur are the variable weights of inputs and outputs, respectively.
This method uses the known inputs and outputs of all DMUs in the given set of data to
determine the efficiency of one member DMUj (j=1…n), which is assigned as DMU0. The
efficiency of DMU0 is obtained by solving the following fractional programming problem n
times, each DMU once.
max ℎ0 =
Subject to:
∑𝑠𝑟=1 𝑢𝑟 𝑦𝑟0 −𝑢0
∑𝑠𝑟=1 𝑢𝑟 𝑦𝑟𝑗 −𝑢0
∑𝑚
𝑖=1 𝑣𝑖 𝑥𝑖𝑗
(1)
∑𝑚
𝑖=1 𝑣𝑖 𝑥𝑖0
≤ 1;
𝑢𝑟 , 𝑣𝑖 ≥ 𝜀 > 0;
𝑗 = 1, … , 𝑛
𝑟 = 1, … , 𝑠;
𝑖 = 1, … , 𝑚.
𝑢0 𝑓𝑟𝑒𝑒 𝑖𝑛 𝑠𝑖𝑔𝑛
Where ε is a “non-Archimedian infinitesimal”, which is smaller than any positive real
number such that all variables are constrained to positive values.
The objective is to obtain the input and output weights vi, ur as variables that maximize
the ratio of DMU0, the DMU being evaluated. The value of h0 obtained from this formulation
represents the efficiency score of DMU0. The constraints mean that h0*, being the optimal
value of h0, should not exceed 1 for all DMUs. In the case h0*=1, this DMU is situated on the
efficiency frontier [25].
To solve this problem, the theory of Charnes et al. [26] is applied to convert this
fractional programming problem to the linear programming (LP) model with the changes of
𝑚
variables 𝑡(∑𝑖=1 𝑣𝑖 𝑥𝑖0 ) = 1 ; 𝜇𝑟 = 𝑡𝑢𝑟 and 𝜗𝑖 = 𝑡𝑣𝑖 . The above problem is replaced by the
following equivalent:
max ℎ0 = ∑𝑠𝑟=1 𝜇𝑟 𝑦𝑟0 − 𝜇0
Subject to:
(2)
∑𝑚
𝑖=1 𝜗𝑖 𝑥𝑖0 = 1
∑𝑠𝑟=1 𝜇𝑟 𝑦𝑟𝑗 − 𝜇0 − ∑
𝜇𝑟 , 𝜗𝑖 ≥ 𝜀 > 0;
𝑚
𝑖=1
𝜗𝑖 𝑥𝑖𝑗 ≤ 0
𝑟 = 1, … , 𝑠;
372
𝑗 = 1, … , 𝑛
𝑖 = 1, … , 𝑚
𝜇0 𝑓𝑟𝑒𝑒
Transport and Communications Science Journal, Vol. 71, Issue 4 (05/2020), 368-379
In the case of output-oriented model, the dual problem can be expressed as follows:
𝑚
max 𝜑 − 𝜀(∑𝑠𝑟=1 𝑠𝑟+ + ∑𝑖=1 𝑠𝑖− )
𝑛
Subject to:
∑
𝑗=1
𝜆𝑗 𝑥𝑖𝑗 + 𝑠𝑖− = 𝑥𝑖0
𝑖 = 1, … , 𝑚
𝜆𝑗 𝑦𝑟𝑗 − 𝑠𝑟+ = 𝜑𝑦𝑟0
𝑟 = 1, … , 𝑠;
𝑛
∑
𝑗=1
𝑛
∑
𝑗=1
(3)
𝜆𝑗 = 1
𝜆𝑗 , 𝑠𝑖+ , 𝑠𝑖− ≥ 0, 𝑎𝑙𝑙 𝑟, 𝑖, 𝑗
𝜑 𝑓𝑟𝑒𝑒
Where: (𝑠𝑖+ , 𝑠𝑖− ) are the output and input slack variables. Input slack is the amount of
input that one DMU could reduce to produce the same output. 𝜑 is the distance parameter in
the output-oriented DEA model. The DMU efficiency is measured by 1/𝜑.
4. DATA SET AND EMPIRICAL ANALYSIS
4.1. Data set
This article uses a sample of 38 bus routes in Hanoi city for empirical analysis. These bus
routes include both mini bus routes (30 spaces) and medium bus routes (60 to 80 spaces). The
given bus routes are shown in Table 1. Data set used in this paper is the operation of these
routes during the year 2018, which is collected from Hanoi Transport Department and the
website of Transerco.
Table 1. List of 38 bus routes within the data sample.
No
Bus
Route
Start point - destination
No
Bus
Route
1
01
Gia Lam Station - Yen Nghia Station
20
47B
2
02
Bac Co - Yen Nghia Station
21
48
Savico Long Bien - Nuoc Ngam Station
3
03A
Giap Bat Station - Gia Lam Station
22
07
Cau Giay - Noi Bai
4
13
Ho Tay Park - Co Nhue
23
27
Yen Nghia Station – Nam Thang Long
5
14
Bo Ho - Co Nhue
24
34
My Đinh Station - Gia Lam
6
18
DH KTQD - Long Bien - DHKTQD
25
35A
Tran Khanh Du - Nam Thang Long
7
20A
Cau Giay - Phung Station
26
55A
Times City - Buoi - Cau Giay
8
22A
Gia Lam Station - Big C Thang Long
27
109
My Đinh Station - Noi Bai
9
23
Nguyen Cong Tru - Nguyen Cong Tru
28
42
Giap Bat Station - Duc Giang
10
26
Mai Dong - National Stadium
29
45
Times City - Nam Thang Long
11
31
Bach Khoa - Chem
30
49
Tran Khanh Du - My Dinh II
12
32
Giap Bat Station - Nhon
31
51
Tran Khanh Du - Cau Giay Park
13
33
Yen Nghia Station - Xuan Đinh
32
60A
14
50
Long Bien - National Stadium
33
96
Nghia Do Park - Dong Anh
34
98
Yen Phụ - Aeon mall Long Bien
15
BRT01 Yen Nghia Station - Kim Ma
373
Start point - destination
DHKTQD - Kieu Ky
Phap Van - Ho Tay Park
Transport and Communications Science Journal, Vol. 71, Issue 4 (05/2020), 368-379
16
84
My Dinh I - Linh Dam
35
99
Kim Ma - BVNT TU II
17
85
Nghia Do Park - Van Phu
36
104
My Dinh - Linh Dam
18
90
Kim Ma Station - Nhat Tan
Bridge - Noi Bai Airport
37
105
Do Nghia - Cau Giay
19
08B
Long Bien - Van Phuc
38
106
Mo Lao - Aeon mall Long Bien
Table 2 shows the statistical description of the input and output variables of the sample
for the year 2018. The variables are defined as follows:
Route length (km): length of roadways from start point to destination.
Number of stops (stop): the total number of bus stops along the route for one way.
Total trips (trip): total number of bus trips performed on the route during the year 2018.
Vehicles (vehicle): total number of bus vehicles used on the route.
Space-km (spaces-km): bus vehicle capacity multiplied by total distance traversed by all
vehicles on the corresponding route during a year (2018).
Passengers: total number of passenger trips performed on the route
Table 2. Statistical description of the inputs and outputs of the 38 bus routes.
Variables
Input/output
Route length (km)
Number of stops (stop)
Total trips (trip)
Vehicles
Space-km
Passengers
Input
Input
Input
Input
Output
Output
Mean
Minimum
Maximum
19.57
31.82
53826.24
11.53
66255245.6
3900952.5
13.8
20
7008
6
11373984
300248
31.5
42
126928
28
204833205
19164025
Standard
deviation
4.73
5.83
28923.02
6
50311570.72
4054286.16
4.2. Model specification
In this article, the technical efficiency and operational effectiveness of given bus routes
are examined on the basis of maximising the outputs. Thus, the output-oriented BCC-DEA
model is adopted for empirical analysis. A DMU is defined as the performance of each bus
route during the year 2018. Table 3 presents the specification of models applied and the
corresponding inputs and outputs. Here, models 1 and 2 measure the technical efficiency and
operational effectiveness of bus routes, respectively.
Table 3. Models and analysis framework.
Model
Model 1
Model 2
Performance
dimension
Technical
efficiency
Operational
effectiveness
Orientation Returns
to scale
Output
VRS
Output
VRS
374
Input variables
Route length, Number of stops,
Total trips, Vehicles
Route length, Number of stops,
Total trips, Vehicles
Output
variables
Space-km
Passengers
Transport and Communications Science Journal, Vol. 71, Issue 4 (05/2020), 368-379
Technical efficiency: the output variables should present service outputs offered by the
bus operator. Here, we select space-km because it represents the bus capacity offered by the
operators. The inputs should present the resources used by bus operator to generate the service
outputs. Based on the existing literature, this article uses route length, number of stops, total
trips, and vehicles as inputs relevant to space-km. Total trips refer to the number of vehicles and
drivers used, vehicles, route length, and number of stops introduce the operation and
maintenance resources.
Operational effectiveness: the outputs should represent the service consumption, so
passengers is selected as output. Inputs for this measure are similar to technical efficiency.
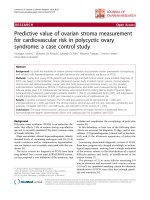
4.3. Results and discussion
The results obtained from the efficiency analysis of the aforementioned models (model 1
for technical efficiency and model 2 for operational effectiveness) are shown in Fig. 1. The
score axis illustrates the efficiency scores of DMUs. A DMU is efficient if its score equals to
1, whereas lower score indicates that it is inefficient. In the DEA models, efficient DMUs
become benchmarks for other inefficient/ineffective DMUs in the given sample. For instance,
considering route 51 in model 1, its score of 0.8 indicates that it is possible to increase the
1−0.8
outputs by 25% (= 0.8 ) using the similar inputs. Its benchmarks are routes 20A (𝜆20𝐴 =
0.539), 49 (𝜆49 = 0.336), and BRT01 (𝜆𝐵𝑅𝑇01 = 0.124). The combination of 53.9%, 33.6%,
and 12.4% inputs and outputs of routes 20A, 49, and BTR01, respectively can build up the
virtual DMU of route 51, which locates on the production frontier.
Figure 1. Efficiency scores of bus routes for model 1 and model 2.
Table 4 represents the summary statistics of the results obtained from the two models. It
could be noted that the average efficiency score in model 1 is remarkably higher than those in
model 2 (0.79 compared with 0.6), suggesting that bus routes considered have better
performance in terms of technical efficiency. Additionally, both models witness a wide
dispersion of efficiency scores because some bus routes (such as routes 104, 105, 106, 23, 98,
and 99) have efficiency scores lower than 0.4.
375
Transport and Communications Science Journal, Vol. 71, Issue 4 (05/2020), 368-379
Table 4. Efficiency scores statistics obtained for the two models.
Model
Mean Minimum Maximum
Standard
deviation
Model 1
0.79
0.35
1
0.22
Percentage of DMUs with score
< 0.5
0.5 – 0.8
0.8 - 1
16.2%
27%
56.8%
Model 2
0.60
0.23
1
0.29
40.5%
38.1%
29.8%
Table 5. Slacks for several inefficient routes in models 1 and 2.
DMU
Model 1
Model 2
23
31
35A
45
84
98
99
Number
of stops Vehicles
Efficiency
Number
score
of stops
Vehicles
0.35
6.19
2.67
0.69
9.13
1.94
0.68
5.75
1.71
0.70
4.99
1.26
0.38
6.87
0.79
0.37
0.91
0.14
0.38
6
0
Efficiency
score
0.26
0.50
0.64
0.42
0.34
0.28
0.23
Number
of stops
6.66
10.99
6.99
5.61
7.52
1.46
6
Vehicles
2.90
1.64
0.83
1.05
0.33
0
0
Table 6. The ranking of bus routes for operational effectiveness (model 2).
DMU
Ranking
DMU
Ranking
1
Efficiency
score
1
105
16
Efficiency
score
0.396
03A; 13; 14; 20A; 49; 85;
90; 109; and BRT01
22A
07
01
55A
32
34
35A
02
33
27
26
96
31
45
2
3
4
5
6
7
8
9
10
11
12
13
14
15
0.99
0.88
0.79
0.71
0.68
0.67
0.64
0.63
0.62
0.55
0.52
0.51
0.50
0.42
08B
60A
50
42
84
18
51
106
98
23
47B
48
99
104
17
18
19
20
21
22
23
24
25
26
27
28
29
30
0.38
0.36
0.35
0.34
0.34
0.3
0.29
0.28
0.28
0.26
0.26
0.25
0.23
0.23
Model 1: Fig. 1 shows that there are 13 efficient DMUs, including routes 03A, 07, 13, 14,
20A, 22A, 32, 34, 49, 85, 90, 109, and BTR01. Furthermore, there are 7 routes with poor
performance (score <0.5), consisting of routes 104, 105, 106, 23, 84, 98, and 99. The
remaining bus routes have fairly good performance regarding the technical efficiency.
Model 2: there are 9 efficient DMUs, including routes 03A, 13, 14, 20A, 49, 85, 90, 109,
and BRT01 (the benchmarks of the sample). It is notable that there are 40.5% bus routes with
poor performance (score <0.5) and 38.1% bus routes with fairly good performance (score
from 0.5 to 0.8) (see Table 4). The least efficient bus routes (score < 0.3) are 18, 23, 47B, 48,
376
Transport and Communications Science Journal, Vol. 71, Issue 4 (05/2020), 368-379
51, 98, 99, 104 and 106, which need further performance improvement. It can be observed
from the results that bus routes with good performance mainly operate within the city centre
(13, 14, and 85) or connect main stations (03A, 90, 109, and BRT01), while the least efficient
routes mainly connect the city centre with suburban areas (47B, 98, 99, and 106). The ranking
of bus routes regarding the operational effectiveness is illustrated in Table 6.
Table 5 illustrates the slacks obtained from both models 1 and 2 for several poor
performance bus routes (input slack is the amount of input that one DMU could reduce to
produce the same output). The results show that slacks mostly occur for number of stops and
vehicles. Thus, reducing the number of stops and/or vehicles used can be one of the possible
solutions to improve performance of inefficient routes. For instance, routes 23 and 31, in
model 1, can reduce the number of vehicles by 2.67 and 1.94 units, respectively.
5. CONCLUSION
This article employs the output-oriented BCC-DEA model to provide insights into the
technical efficiency (model 1) and operational effectiveness (model 2) of 38 key bus routes
within the bus network in Hanoi, Vietnam. The results achieved indicate the best and the
worst bus routes within the data sample. It is noted that routes 03A, 13, 14, 20A, 49, 85, 90,
109, and BRT01 become the benchmark of the sample for both technical efficiency and
operational effectiveness measure. Routes 18, 23, 47B, 48, 51, 98, 99, 104 and 106, having
the poorest performance in model 2, need further investigations to understand the key reasons
of inefficiency, and then make appropriate decisions for performance improvement.
The empirical analysis also explains to some extent the source of inefficiency of bus
route performance, including the number of stops and vehicles. This indicates the
considerably low stop spacing and the excessive use of number of vehicles on some
inefficient bus routes. Reduction of these resources could be a solution to optimise the
performance of these bus routes. The knowledge gained helps to provide bus operators and
policy makers with additional information for decision makings.
This article only uses the yearly data to evaluate the performance of 38 bus routes in
Hanoi. Future studies should use a larger sample and more detailed timeframes (weekday or
monthly data) for empirical analysis to obtain the more comprehensive results. Another
limitation is that we do not investigate the influence of environmental factors (socio-economic
factors) on the efficiency score of DMUs. This work will be performed in upcoming studies.
ACKNOWLEDGMENT
The authors wish to sincerely thank Hanoi Transport Department and Transerco of
Hanoi, which have supplied the relevant data of bus system in Hanoi, Vietnam.
REFERENCES
[1]. Y. Lao, L. Liu, Performance evaluation of bus lines with data envelopment analysis and
geographic information systems. Computers, Environment and Urban Systems, 33 (2009) 247-255.
/>[2]. G. Georgiadis, I. Politis, P. Papaioannou, Measuring and improving the efficiency and
effectiveness of bus public transport systems, Research in Transportation Economics, 48 (2014) 84-91.
/>377
Transport and Communications Science Journal, Vol. 71, Issue 4 (05/2020), 368-379
[3]. C. Sheth, K. Triantis, D. Teodorović, Performance evaluation of bus routes: A provider and
passenger perspective, Transportation Research Part E: Logistics and Transportation Review, 43
(2007) 453-478. />[4]. G.J. Fielding,, M.E. Brenner, K. Faust, Typology for bus transit, Transportation Research Part A:
General, 19 (1985) 269-278. />[5]. X. Chu, G.J. Fielding, B.W. Lamar, Measuring transit performance using data envelopment
analysis, Transportation Research Part A: Policy and Practice, 26 (1992) 223-230.
/>[6]. D.T. Barnum, S. Tandon, S. McNeil, Comparing the performance of bus routes after adjusting for
the environment using data envelopment analysis, Journal of Transportation Engineering, 134 (2008)
77-85. />[7]. G.J. Fielding, T.T. Babitsky, M.E. Brenner, Performance evaluation for bus transit,
Transportation Research Part A: General, 19 (1985) 73-82. />[8]. V.R. Vuchic, Urban transit systems and technology, Hoboken, N.J: John Wiley & Sons, 2007.
[9]. [9]
P. Ryus, A Summary of TCRP Report 88: A Guidebook for Developing a Transit
Performance-Measurement
System.
TCRP
Research
Results
Digest,
2003(56).
/>[10].D. Aigner, C.K. Lovell, P. Schmidt, Formulation and estimation of stochastic frontier production
function
models,
Journal
of
Econometrics,
6
(1977)
21-37.
/>[11].W. Meeusen, J. van Den Broeck, Efficiency estimation from Cobb-Douglas production functions
with
composed
error,
International
economic
review,
18
(1977)
435-444.
/>[12].H.P.
Benn,
Bus
route
evaluation
standards,
1995.
/>[13].H.P. Hatry, Performance measurement principles and techniques: An overview for local
government, Public Productivity Review, 4 (1980) 312-339. />[14].K. Obeng, The economic cost of subsidy-induced technical inefficiency. International Journal of
Transport Economics/Rivista internazionale di economia dei trasporti, 21 (1994) 3-20.
/>[15].K. Kerstens, Technical efficiency measurement and explanation of French urban transit
companies. Transportation Research Part A: Policy and Practice, 30 (1996) 431-452.
/>[16].P.A. Viton, Technical efficiency in multi-mode bus transit: A production frontier analysis.
Transportation Research Part B: Methodological, 31 (1997) 23-39. />[17].P.A. Viton, Changes in multi-mode bus transit efficiency, 1988–1992, Transportation, 25 (1998)
1-21. />[18].D.A. Tsamboulas, Assessing performance under regulatory evolution: A European transit system
perspective. Journal of Urban Planning and Development, 132 (2006) 226-234.
/>[19].M. Arman, S. Labi, K. Sinha, Perspectives of the Operational Performance of Public
Transportation Agencies with Data Envelopment Analysis Technique, Transportation Research
Record:
Journal
of
the
Transportation
Research
Board,
2351(2013)
30-37.
/>[20].R. Fare, S. Grosskopf, Network DEA, Socio-economic planning sciences, 34 (2000) 35-49.
/>[21].A. Charnes, W.W. Cooper, E. Rhodes, Measuring the efficiency of decision making units,
European Journal of Operational Research, 2 (1978) 429-444. />378
Transport and Communications Science Journal, Vol. 71, Issue 4 (05/2020), 368-379
[22].R.D. Banker, A. Charnes, W.W. Cooper, Some models for estimating technical and scale
inefficiencies in data envelopment analysis, Management science, 30 (1984) 1078-1092.
/>[23].M.J. Farrell, The Measurement of Productive Efficiency. Journal of the Royal Statistical
Society.Series A (General), 120 (1957) 253-290. />[24].W.D. Cook, L.M. Seiford, Data envelopment analysis (DEA) – Thirty years on. European Journal
of Operational Research, 192 (2009) 1-17. />[25].K. Tone, W.W. Cooper, L.M. Seiford, Data Envelopment Analysis: A Comprehensive Text with
Models, Applications, and DEA-Solver Software, Kluwer Academic Publishers, 1999.
[26].A.Charnes, W.W. Cooper, Programming with linear fractional functionals, Naval Research
logistics quarterly, 9 (1962) 181-186. />
379