Prediction of welding bead geometry for wire arc additive manufacturing of SS308L walls using response surface methodology
Bạn đang xem bản rút gọn của tài liệu. Xem và tải ngay bản đầy đủ của tài liệu tại đây (883.96 KB, 13 trang )
Transport and Communications Science Journal, Vol. 71, Issue 4 (05/2020), 431-443
Transport and Communications Science Journal
PREDICTION OF WELDING BEAD GEOMETRY FOR WIRE ARC
ADDITIVE MANUFACTURING OF SS308L WALLS USING
RESPONSE SURFACE METHODOLOGY
Van Thao Le*, Dinh Si Mai, Tat Khoa Doan, Quang Huy Hoang
Le Quy Don Technical University, No. 236 Hoang Quoc Viet Street, Hanoi, Vietnam.
ARTICLE INFO
TYPE: Research Article
Received: 21/4/2020
Revised: 19/5/2020
Accepted: 20/5/2020
Published online: 28/5/2020
/>*
Corresponding author.
Email:
Abstract. In the wire arc additive manufacturing (WAAM) process, the geometry of single
welding beads has significant effects on the stability process and the final quality and shape of
manufactured parts. In this paper, the geometry of single welding beads of 308L stainless
steel was predicted as functions of process parameters (i.e. welding current I, voltage U, and
travel speed v) by using the response surface methodology (RSM). A set of experimental runs
was carried out by using the Box-Behnken design method. The adequacy of the developed
models was assessed by using an analysis of variance (ANOVA). The results indicate that the
RSM allows the predictive models of bead width (BW) and bead height (BH) to be developed
with a high accuracy: R2-values of BW and BH are 99.01% and 99.61%, respectively. The
errors between the predicted and experimental values for the confirmatory experiments are
also lower than 5% that again confirms the adequacy of the developed models. These
developed models can efficiently be used to predict the desirable geometry of welding beads
for the adaptive slicing principle in WAAM.
Keywords: Wire arc additive manufacturing, gas metal arc welding, welding bead geometry,
response surface methodology, ANOVA.
© 2020 University of Transport and Communications
431
Transport and Communications Science Journal, Vol. 71, Issue 4 (05/2020), 431-443
1. INTRODUCTION
Additive manufacturing (AM), also known as 3D printing, has largely investigated in the
last four decades because of its ability of building complex components by adding materials
layer-by-layer [1]. In comparison to traditional manufacturing processes (e.g. casting and
machining), AM has the advantages of design freedom, reducing material wastes and
environmental impacts [2,3]. AM technologies - particularly metallic AM, have been
efficiently applied in different industrial sectors, for example aerospace, automotive, and
biomedical engineering [1].
The metallic AM technologies can be classified into three main groups: laser-based,
electron beam-based and arc welding-based AM [4]. Among them, wire arc additive
manufacturing (WAAM) uses the electrical arc as the heat source to melt metallic wire and
produces the parts layer-by-layer. This technique reveals high deposition rate of materials and
low costs of production and investment [5]. The deposition rate of materials in WAAM can
reach up to 8 kg/h, while that of laser-based and electron beam-based AM is around 0.1 - 0.2
kg/h [6]. Moreover, this technology features a high efficiency of material utilization. The use
of metal wire as the feedstock material is also safer than the metal in powder form for the
health of operators and environment.
The heat source used in WAAM can be gas metal arc welding (GMAW), gas tungsten arc
welding (GTAW), and plasma arc welding (PAW) [7]. During GTAW-AM and PAW-AM
processes, the arc is ignited between the tungsten electrode and the workpiece and the melted
wire is fed into the molten pool, separately. On the other hand, the welding arc of GMAWAM processes is directly ignited between the consumable wire and the workpiece. Thus, the
wire is melted more quickly under the effect of the electric arc and the shielding gas flow. The
deposition rate of GMAW-AM is generally from two to three times higher than that of
GTAW-AM and PAW-AM processes [8]. Therefore, the GMAW-AM is usually used for
producing components with large scale dimensions.
In comparison to the traditional welding process, in which some factors related to the
welding beads such as the aspect factor or the form factor, the depth of penetration, and the
bead width are usually taken in consideration [9–11], the bead width and the bead height of
single welding beads play very important role in the WAAM process. They significantly
influences the process stability, the final geometry and quality of manufactured parts,
especially in the cases of building thin-wall components [12]. The geometry and quality of
welding beads are generally controlled by the welding process parameters, such as the
welding current, the arc voltage, and the travel speed. Previously published studies generally
carried out a number of trial runs with different sets of process parameters to observe the
geometry and quality of welding beads, and subsequently select a reasonable one for the build
of components [13–15]. Other studies selected the process parameters according to the
recommendation of the wire manufacturers for specified wire materials and welding
conditions [16]. In addition, most of previous studies focused on exploring the manufacture of
low-carbon steels [16,17] and some austenite stainless steels (e.g. 304, 304L, and 316L) [16–
20] by the WAAM process. Until now, very limited studies have reported in the build of
WAAM SS308L components.
Therefore, this study aims at developing the predictive models of welding beads and
welding height by using the response surface methodology (RSM) for the build of thin-walled
SS308L components by GMAW-AM. Based on the predictive models, the effect of main
432
Transport and Communications Science Journal, Vol. 71, Issue 4 (05/2020), 431-443
process parameters on the geometry of welding beads can be analyzed, and the designer and
process planners can predict optimal process parameters, which ensure the process stability
and final quality of components built by the WAAM process.
2. MATERIALS AND EXPERIMENTAL PROCEDURE
2.1. Materials
In the experiments, a commercial 308L stainless steel wire with a diameter of 1 mm was
used as the feedstock material. A number of SS400 steel plates with dimensions of 250 mm x
150 mm x 10 mm were used as the substrates in the welding process. The chemical
composition of the wire and the substrate are given in Table 1.
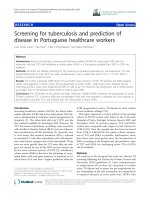
A robotic GMAW system (Panasonic TA1400) shown in Fig. 1a was used to build all
samples. During the welding process, a gas of 99.99% argon with a constant flow rate of 15
(L/min) was applied for the shielding.
Table 1. Chemical compositions of SS308L and SS400 (in wt. %).
Material
C
P
S
Si
Mn
Mo
Cu
Cr
Ni
Fe
308L wire
0.03
max
0.03
max
0.03
max
0.300.65
1.02.5
0.50
max
0.75
max
19.521
9.011.0
Bal.
SS400
0.05
0.013
0.002
0.037
0.46
-
-
-
-
Bal.
2.2. Experimental procedure
In order to develop the predictive models of the bead width and the bead height as
functions of main process parameters, including the welding current I, the voltage U, and the
travel speed v, a series of trial runs were designed by using the Box-Behnken method. Three
levels of values were selected and coded for each factor (i.e. I, U and v), as shown in Table 2.
The limits of each parameter were chosen based on the recommendation of the wire
manufacturer. These values were also verified by several trial runs to ensure the weldability
and to avoid the interruption of the experiment.
Table 2. Process parameters and their levels.
Levels
Parameters
Code
-1
0
+1
Welding current, I (A)
A
100
120
140
Voltage, U (V)
B
17
20
23
Travel speed, v (mm/min)
C
300
400
500
Table 3 shows 17 trial runs of welding beads designed by the Box-Behnken design,
which were used to develop the regression models. In addition, four extra runs (from 18 to 21)
433
Transport and Communications Science Journal, Vol. 71, Issue 4 (05/2020), 431-443
were used to evaluate the accuracy of the developed models. In each trial run, a single
welding bead was produced by the robotic GMAW system with a length of 120 mm (Figure
1b). The bead width (BW) and the bead height (BH) of a welding bead were measured at five
positions in the steady region of the welding bead by using a digital caliper, and then the
average value was taken, as presented in Table 3.
Table 3. Experimental design matrix and experimental results.
Input variables
Response
Run
A: I (A)
B: U (V)
C: v (mm/min)
BW (mm)
BH (mm)
1
100
17
400
3.79
3.01
2
140
17
400
4.03
3.98
3
100
23
400
5.08
2.49
4
140
23
400
5.41
3.46
5
100
20
300
4.96
3.29
6
140
20
300
5.42
4.22
7
100
20
500
4.19
2.02
8
140
20
500
4.53
3.14
9
120
17
300
4.31
4.21
10
120
23
300
6.02
3.66
11
120
17
500
3.81
3.12
12
120
23
500
5.21
2.62
13
120
20
400
4.97
3.17
14
120
20
400
5.00
3.28
15
120
20
400
4.97
3.30
16
120
20
400
4.87
3.22
17
120
20
400
5.01
3.20
18
110
18
350
4.54
3.38
19
130
22
350
5.46
3.53
20
110
18
400
4.42
3.28
21
130
22
450
5.13
2.96
434
Transport and Communications Science Journal, Vol. 71, Issue 4 (05/2020), 431-443
Figure 1. (a) The robotic GMAW system (Panasonic TA1400) and (b) 17 trial runs of single
welding beads used for developing the regression models.
3. RESULTS AND DISCUSSION
3.1. Developing the predictive models
In the current study, the second order regression equation was adopted to develop the
predictive models of bead width, bead height, eq. (1):
Y = b0+ b1I + b2U + b3v + b12IU + b13Iv + b23Uv + b11I2 + b22U2 + b33v2
(1)
where Y is the responses – i.e. the bead width BW (mm) or the bead height BH (mm), b0
is the average of the response; bi, bii and bij (i, j = 1, 2, 3 and i j) are the coefficients, which
depend on their main effects and interaction effects of the parameters on the responses, I is the
welding current (A), U is the voltage (V), and v is the travel speed of the welding torch
(mm/min). In this work, the coefficients were estimated by using the Design Expert 11
software. The full predictive models in terms of actual factors for the bead width and the bead
height are shown in eq. (2) and eq. (3), respectively:
BW (mm) = - 16.190 + 0.143I + 1.027U + 0.50810-3v + 0.37510-3IU - 0.01610-3Iv
- 0.26310-3Uv - 0.56710-3I2 - 0.018U2 + 3.6710-6v2
(2)
BH (mm) = 7.575+ 0.085I - 0.623U - 0.014v + 8.3310-6IU + 0.02410-3Iv
+ 0.04810-3Uv - 0.29210-3I2 + 0.013U2 + 5.22310-6v2
(3)
In eq. (2) and eq. (3), the unit of the welding current I, the voltage U, and the travel speed
v is “A”, “V”, and “mm/min”, respectively.
3.2. Analysis of regression models
The accuracy of the developed models was evaluated by using the analysis of variance
(ANOVA) method. The results of ANOVA for the regression models of the bead width and
the bead height were presented in Tables 4 and 5, respectively.
435
Transport and Communications Science Journal, Vol. 71, Issue 4 (05/2020), 431-443
For the model of the bead width, as shown in eq. (2) and Table 4, the F-value of 78.06
indicates that the model is significant. There is only a 0.01% chance that the F-value could be
large due to noise. The p-values lower than 0.05 indicate that the model terms are significant,
whereas the p-values greater than 0.10 indicate the model terms are not significant. In this
case, the terms {A, B, C, A2 and B2} are significant terms of the developed model. The R2 of
0.9901 indicates a high correlation between the experimental and the predicted values. The
Predicted R2 of 0.8726 is in reasonable agreement with the Adjusted R2 of 0.9774. The Adeq.
Precision represents the ratio of signal-to-noise. A value of this ratio greater than 4 is usually
desirable. Herein, the Adeq. Precision of 32.85 indicates an adequate signal. Therefore, the
developed model of the bead width is totally validated in the design space.
Table 4. ANOVA results for the regression model of the bead width (BW).
Source
Sum of Squares
Mean Square
F-value
p-value
Model
5.8900
0.6542
78.06
< 0.0001
A-Welding current, I
0.2339
0.2339
27.91
0.0011
B-Voltage, U
4.1700
4.1700
497.94
< 0.0001
C-Travel speed, v
1.1000
1.1000
131.56
< 0.0001
AB
0.0020
0.0020
0.2416
0.6381
AC
0.0040
0.0040
0.4736
0.5135
BC
0.0250
0.0250
2.98
0.1280
A²
0.2166
0.2166
25.84
0.0014
B²
0.1123
0.1123
13.40
0.0081
C²
0.0057
0.0057
0.6767
0.4379
R2
0.9901
Predicted R2
0.8726
Adjusted R2
0.9774
Adeq. Precision
32.8534
In the case of the bead height model (eq. (3) and Table 5), the F-value of 200.86 indicates
that the model is significant. Only a 0.01% chance occurs that the F-value could enlarge due
to noise. The terms {A, B, C, A2 and B2} with the p-values lower than 0.05 are significant
terms in the bead height model. The R2 of 0.9961 indicates very good correlation between the
experimental values and the predicted values. The Predicted R2 of 0.9706 is in good
agreement with the Adjusted R2 of 0.9912. The Adeq. Precision of 53.02 higher than 4
indicates an adequate signal. Thus, the model can be used in the whole design space.
3.3. Effects of process parameters on the geometry of single welding beads
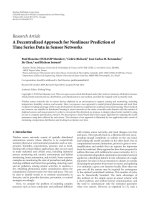
Fig. 2a and Fig. 2b present the perturbation of the bead width and the bead height,
respectively, as functions of deviation from the reference point. In Fig. 2a, it is found that the
voltage and the travel speed reveal significant effects on the bead width. The bead width
increases when the voltage increases from 17 (V) (at -1 level) to 23 (V) (at +1 level), whereas
436
Transport and Communications Science Journal, Vol. 71, Issue 4 (05/2020), 431-443
the bead width decreases when the travel speed increases from 300 (mm/min) (at -1 level) to
500 (mm/min) (at +1 level). Moreover, the bead width gradually increases when the welding
current increases up to a certain value, and then it starts decreasing.
Table 5. ANOVA results for the regression model of the bead height (BH).
Source
Sum of Squares
Mean Square
F-value
p-value
Model
5.1800
0.5752
200.86
< 0.0001
A-Welding current, I
1.9900
1.9900
694.76
< 0.0001
B-Voltage, U
0.5513
0.5513
192.51
< 0.0001
C-Travel speed, v
2.5100
2.5100
875.13
< 0.0001
AB
0.0000
0.0000
0.0003
0.9856
AC
0.0093
0.0093
3.24
0.1149
BC
0.0008
0.0008
0.2937
0.6047
A²
0.0574
0.0574
20.05
0.0029
B²
0.0565
0.0565
19.74
0.0030
C²
0.0115
0.0115
4.01
0.0853
R2
0.9961
Predicted R2
0.9706
Adjusted R2
0.9912
Adeq. Precision
53.0157
Figure 2. Main effects of process parameters on the bead width (a) and on the bead height (b).
437
Transport and Communications Science Journal, Vol. 71, Issue 4 (05/2020), 431-443
As revealed in Fig. 2b, the travel speed and the welding current have notable effects on
the bead height. An increase in the welding current from 100 (A) (at -1 level) to 140 (A) (at
+1 level) leads to an augmentation in the bead height. On the other hand, the bead height
decreases when the travel speed and the voltage increase in the design space.
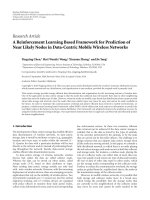
Fig. 3 shows the interaction effects of process parameters on the bead width. It is also
observed that the bead width increases with an increase in the voltage for all values of the
welding current (Fig. 3a) and for all values of the travel speed (Fig. 3c). On the other hand,
the increase in the travel speed also leads to a decrease in the bead width for all values of the
voltage and for all values of the welding current. The bead width slightly increases with an
increase in the welding current for all values of the voltage and the travel speed (Fig. 3a and
Fig. 3b).
Figure 3. Interaction effects of process parameters on the bead width: (a) I and U on BW, (b) I and
v on BW, and (c) U and v on BW.
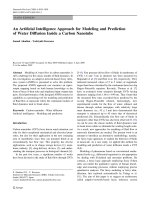
The interaction effects of process parameters on the bead height were also presented in
Fig. 4. It is found that the bead height increases with an increase in the current from 100 (A)
to 140 (A) for all values of the voltage (Fig. 4a) and for all values of the travel speed (Fig.
4b). On the other hand, the bead height decreases with an increase in the travel speed for all
438
Transport and Communications Science Journal, Vol. 71, Issue 4 (05/2020), 431-443
values of the welding current (Fig. 4b) and for all values of the voltage (Fig. 4c). The increase
in the voltage leads to a gradual decrease in the bead height for all values of the welding
current (Fig. 4a) and for all values of the travel speed (Fig. 4c). At the lowest value of the
voltage and the travel speed, and at the highest value of the welding current, the bead height
reaches the maximal value.
Figure 4. Interaction effects of process parameters on the bead height: (a) I and U on BH, (b) I
and v on BH, and (c) U and v on BH.
The effects of the parameters on the geometry of welding beads can be explained by the
following reasons: when the voltage increases, the arc length and the spreading of the arc
increase too [21,22]. As a result, the bead width increases, and the bead height decreases. An
excessive increase in the voltage can also cause flat welding beads. The bead width and the
bead height decrease when the travel speed increases. This is due to the fact that the quantity
of deposited materials per length unit and the heat input also decrease with an increase in the
travel speed. Thereby, both the bead width and bead height decrease. In the GMAW process,
the increase in the welding current leads to an augmentation in the wire feed speed. Namely,
the rate of deposited material increases. Thus, the size of welding pool, the bead width, and
the bead height increase. However, the bead width only increases up to a certain value of the
439
Transport and Communications Science Journal, Vol. 71, Issue 4 (05/2020), 431-443
welding current and then decreases. After that, an extra deposited material does not have
significant effects on the bead width, and the bead width remains almost constant or slightly
decreases [21].
3.4. Validation of the regression models
In order to validate the accuracy of the regression models, the data of four extra runs
(from 18 to 21 given in Table 3) was also used. The error between a predicted value (PV) and
an experimental value (EV) was calculated by eq. (4):
Error (%) = 100%*(PV – EV)/EV
(4)
It is found that the errors in the percentage for the bead width (BW) and the bead height
(BH) lie within the rages of -3.28% to 3.26%, and of -2.96% to 4.10%, respectively. The
small errors lower than 5% indicate that the regression models are adequate and can be used
for optimizing process parameters, which would give a desirable geometry and quality of
welding beads for the build of thin-walled components.
Table 6. Comparison of the experimental and the predicted values.
Bead width, BW
Bead height, BH
No.
PV
EV
Error (%)
PV
EV
Error (%)
18
4.44
4.54
-2.30
3.49
3.38
3.33
19
5.64
5.46
3.26
3.61
3.53
2.17
20
4.27
4.42
-3.28
3.18
3.28
-2.96
21
5.20
5.13
1.33
3.08
2.96
4.10
3.5. Optimization of the process parameters for the build of SS308L walls
Based on the developed models, the optimal process parameters can be predicted. In the
WAAM process of thin walls, the bead width and the bead height of single welding beads are
expected to be maximum, while the heat input (HI) determined by the formula HI =
60**U*I/v (J/mm), where is the coefficient of thermal efficiency and = 0.8 for the
GMAW process [23], U in (V), I in (A), and v in (mm/min), should be minimum. This
ensures the process stability and reducing the distortion and residual stresses of the built walls
[12,24,25]. Therefore, the problem of optimizing the process parameters was expressed as
follows:
Find [I, U, v] to maximize BW, maximize BH, and minimize HI.
Subject to: 100 ≤ I ≤ 140 (A); 17 ≤ U ≤ 23 (V); 300 ≤ v ≤ 500 (mm/min).
This problem was solved by using the optimization module in the Design Expert 11
software. The optimal process parameters were calculated as: I = 122 (A), U = 20 (V) and v =
368 (mm/min). As shown in Fig. 5, three single welding beads built by the optimized process
440
Transport and Communications Science Journal, Vol. 71, Issue 4 (05/2020), 431-443
parameters are nearly identical. They are continuous, smooth, regular and without major
defects. The average bead width and bead height are 4.95 (mm) and 3.32 (mm), respectively.
Figure 5. Three welding beads built with the optimized process parameters.
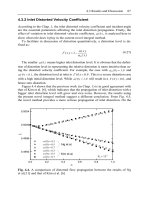
Fig. 6 shows a SS308L wall built by the GMAW-AM with the above optimized process
parameters. The wall was built by using the same deposition direction strategy [26]. It is
found that the width of the wall is stable. On the other hand, the height of the wall decreases
from the right to the left. This phenomenon is commonly observed in the case of building
thin-walled components by the same deposition direction strategy in WAAM [26].
Figure 6. The GMAW-AM SS308L wall built with the optimized process parameters.
4. CONCLUSIONS
This paper aims at developing the predictive models for the bead width and the bead
height in the WAAM process of SS308L components. For this purpose, a series of
experimental runs were performed according to the Box-Behnken design method. The value
range of the process parameters was chosen based on the recommendation of the wire
manufacturer and verified by several trial runs. The regression models were developed by
using the response surface methodology (RSM), and their accuracy was assessed by the
analysis of variance (ANOVA). The results indicate that the regression models present a high
accuracy and can be efficiently used to analyze the effects of process parameters on the
welding bead geometry, and to predict the desirable bead width and bead height in the whole
design space. From the developed models, the optimized process parameters, including a
welding current of 122 (A), a voltage of 20 (V) and a travel speed of 368 (mm/min) were
determined for the build of SS308L walls. The models developed in this study are only used
to predict the optimal process parameters in the GMAW-AM of SS308L. However, the same
workflow can be applied to predict the geometry of single welding beads in WAAM of other
metals. In the future works, the microstructure and mechanical properties of GMAW-AM
SS308L components will be investigated to confirm their adequacy for real applications.
441
Transport and Communications Science Journal, Vol. 71, Issue 4 (05/2020), 431-443
ACKNOWLEDGMENT
This research is funded by Vietnam National Foundation for Science and Technology
Development (NAFOSTED) under grant number 107.99-2019.18.
REFERENCES
[1]. N. Guo, M. Leu, Additive manufacturing: technology, applications and research needs, Front.
Mech. Eng., 8 (2013) 215–243. />[2]. V.T. Le, H. Paris, G. Mandil, Environmental impact assessment of an innovative strategy based
on an additive and subtractive manufacturing combination, J. Clean. Prod., 164 (2017) 508–523.
/>[3]. V.T. Le, H. Paris, A life cycle assessment-based approach for evaluating the influence of total
build height and batch size on the environmental performance of electron beam melting, Int. J. Adv.
Manuf. Technol., 98 (2018) 275–288. />[4]. K.S. Derekar, A review of wire arc additive manufacturing and advances in wire arc additive
manufacturing
of
aluminium,
Mater.
Sci.
Technol.,
34
(2018)
895–916.
/>[5]. D. Ding, Z. Pan, D. Cuiuri, H. Li, Wire-feed additive manufacturing of metal components:
technologies, developments and future interests, Int. J. Adv. Manuf. Technol., 81 (2015) 465–481.
/>[6]. S.W. Williams, F. Martina, A.C. Addison, J. Ding, G. Pardal, P. Colegrove, Wire + Arc
Additive
Manufacturing,
Mater.
Sci.
Technol.
32
(2016)
641–647.
/>[7]. J. Xiong, Y. Li, R. Li, Z. Yin, Influences of process parameters on surface roughness of multilayer single-pass thin-walled parts in GMAW-based additive manufacturing, J. Mater. Process.
Technol., 252 (2018) 128–136. />[8]. Z. Zhang, C. Sun, X. Xu, L. Liu, Surface quality and forming characteristics of thin-wall
aluminium alloy parts manufactured by laser assisted MIG arc additive manufacturing, Int. J. Light.
Mater. Manuf., 1 (2018) 89–95. />[9]. S. Jindal, R. Chhibber, N.P. Mehta, Effect of welding parameters on bead profile,
microhardness and H 2 content in submerged arc welding of high-strength low-alloy steel, Proc. Inst.
Mech. Eng. Part B J. Eng. Manuf. 228 (2014) 82–94. />[10]. G. Magudeeswaran, S.R. Nair, L. Sundar, N. Harikannan, Optimization of process parameters
of the activated tungsten inert gas welding for aspect ratio of UNS S32205 duplex stainless steel
welds, Def. Technol., 10 (2014) 251–260. />[11]. S. Srivastava, R.K. Garg, Process parameter optimization of gas metal arc welding on IS:2062
mild steel using response surface methodology, J. Manuf. Process., 25 (2017) 296–305.
/>[12]. J. Xiong, G. Zhang, W. Zhang, Forming appearance analysis in multi-layer single-pass GMAWbased additive manufacturing, Int. J. Adv. Manuf. Technol., 80 (2015) 1767–1776.
/>[13]. X. Lu, Y.F. Zhou, X.L. Xing, L.Y. Shao, Q.X. Yang, S.Y. Gao, Open-source wire and arc
additive manufacturing system: formability, microstructures, and mechanical properties, Int. J. Adv.
Manuf. Technol., 93 (2017) 2145–2154. />[14]. H. Takagi, H. Sasahara, T. Abe, H. Sannomiya, S. Nishiyama, S. Ohta, K. Nakamura, Materialproperty evaluation of magnesium alloys fabricated using wire-and-arc-based additive manufacturing,
Addit. Manuf., 24 (2018) 498–507. />[15]. M. Dinovitzer, X. Chen, J. Laliberte, X. Huang, H. Frei, Effect of wire and arc additive
manufacturing (WAAM) process parameters on bead geometry and microstructure, Addit. Manuf., 26
(2019) 138–146. />[16]. M. Rafieazad, M. Ghaffari, A. Vahedi Nemani, A. Nasiri, Microstructural evolution and
mechanical properties of a low-carbon low-alloy steel produced by wire arc additive manufacturing,
442
Transport and Communications Science Journal, Vol. 71, Issue 4 (05/2020), 431-443
Int. J. Adv. Manuf. Technol., 105 (2019) 2121–2134. />[17]. V.T. Le, A preliminary study on gas metal arc welding-based additive manufacturing of metal
parts, Sci. Technol. Dev. J. 23 (2020) 422–429. />[18]. X. Chen, J. Li, X. Cheng, B. He, H. Wang, Z. Huang, Microstructure and mechanical properties
of the austenitic stainless steel 316L fabricated by gas metal arc additive manufacturing, Mater. Sci.
Eng. A., 703 (2017) 567–577. />[19]. C. V. Haden, G. Zeng, F.M. Carter, C. Ruhl, B.A. Krick, D.G. Harlow, Wire and arc additive
manufactured steel: Tensile and wear properties, Addit. Manuf., 16 (2017) 115–123.
/>[20]. W. Wu, J. Xue, Z. Zhang, P. Yao, Comparative study of 316L depositions by two welding
current
processes,
Mater.
Manuf.
Process.,
34
(2019)
1502-1508.
/>[21]. V. Gunaraj, N. Murugan, Application of response surface methodology for predicting weld bead
quality in submerged arc welding of pipes, J. Mater. Process. Technol., 88 (1999) 266–275.
/>[22]. S. Jindal, R. Chhibber, N.P. Mehta, Effect of welding parameters on bead profile,
microhardness and H 2 content in submerged arc welding of high-strength low-alloy steel, Proc. Inst.
Mech. Eng. Part B J. Eng. Manuf. 228 (2014) 82–94. />[23]. I. Jurić, I. Garašić, M. Bušić, Z. Kožuh, Influence of Shielding Gas Composition on Structure
and Mechanical Properties of Wire and Arc Additive Manufactured Inconel 625, Jom., 71 (2019) 703–
708. />[24]. F. Youheng, W. Guilan, Z. Haiou, L. Liye, Optimization of surface appearance for wire and arc
additive manufacturing of Bainite steel, Int. J. Adv. Manuf. Technol., 91 (2017) 301–313.
/>[25]. D. Yang, G. Wang, G. Zhang, Thermal analysis for single-pass multi-layer GMAW based
additive manufacturing using infrared thermography, J. Mater. Process. Technol., 244 (2017) 215–
224. />[26]. J. Xiong, Z. Yin, W. Zhang, Forming appearance control of arc striking and extinguishing area
in multi-layer single-pass GMAW-based additive manufacturing, Int. J. Adv. Manuf. Technol., 87
(2016) 579–586. />
443