Determining the set of representative variables of real-world driving cycle of bus: A case study of Hanoi
Bạn đang xem bản rút gọn của tài liệu. Xem và tải ngay bản đầy đủ của tài liệu tại đây (333.72 KB, 11 trang )
Transport and Communications Science Journal, Vol. 71, Issue 4 (05/2020), 317-327
Transport and Communications Science Journal
DETERMINING THE SET OF REPRESENTATIVE VARIABLES
OF REAL-WORLD DRIVING CYCLE OF BUS: A CASE STUDY OF
HANOI
Yen-Lien T. Nguyen
Faculty of Transport Safety and Environment, University of Transport and Communications,
No 3 Cau Giay Street, Hanoi, Vietnam
ARTICLE INFO
TYPE: Research Article
Received: 25/12/2019
Revised: 12/2/2020
Accepted: 15/2/2020
Published online: 28/5/2020
/>*
Corresponding author
Email: ; Tel: 0972079992
Abstract: This paper analysed the real-world driving data to determine the representative parameters
of driving cycle for the purpose of the typical driving cycle development of bus in Hanoi. The realworld driving data of bus in Hanoi were collected by using the Global positioning system technique
with 1Hz data update rate. The real-world driving data of fifteen bus routes in the inner city were
collected continuously, on weekdays as well as at weekends. The data, then, were used to calculate 33
kinematics parameters reflecting the realistic driving characteristics, including vehicle-specific power.
The hierarchical agglomerative clustering method was used to determine a minimal set of
representative variables from the 33 kinematics parameters. The 14 representative parameters of the
real-world driving cycle of bus in Hanoi were determined.
Keywords: driving characteristics, driving cycle, HAC, VSP, Hanoi, bus
© 2020 University of Transport and Communications
1. INTRODUCTION
The transport system in Hanoi is undergoing a rapid development process to meet the
strong growth rate of the city in recent years. However, due to very high vehicle density
during a poor transportation infrastructure, the traffic jams are still happening frequently.
Hence, transport sector is estimated to be one of the main causes of air pollution in Hanoi, in
which buses are the main emission source of particulate matter (PM) and black carbon (BC),
these pollutants can cause effects strongly on human health. Therefore, air pollutants emission
from the bus system in Hanoi must be controlled closely.
317
Transport and Communications Science Journal, Vol. 71, Issue 4 (05/2020), 317-327
Emission factor (EF) is a useful tool to estimate the amount of pollutants released from a
specific source; hence, it is widely used in the emission inventory. However, there are many
factors can impact the EF. For vehicles, these factors include the vehicle type and age, air
pollution control technologies, the fuel type and quality, the vehicle operation conditions,
inspection and maintenance (I/M) conditions, and ambient air conditions. Therefore, each
country should use the country-specific emission factor (CSEF) instead of values adopted
from other countries to reduce the uncertainty level in national emission inventories.
The vehicle emission measurement under the controlled condition in laboratories based
on the local driving cycle is the ideal approach for CSEF development [5]. According to this
approach, the local typical driving cycle must be developed first. In the driving cycle
development, the kinematics parameters of the driving cycle are used as basis to capture the
realistic driving characteristics and are entered into the typical driving cycle. They are also
used as assessment criteria to choose a typical driving cycle. However, in almost all previous
studies, the selected parameters mainly reflect the driving characteristics, without parameters
reflects well vehicle emission characteristics as vehicle specific power (VSP) parameter [8,
12]. In addition, most of previous studies often use driving cycle parameters following the
experience of previous studies without presenting an explanation of their choice, as in [7],
[13], [15], [9] and so on. Meanwhile, the study of Torp et al. (2013) showed that on the
different data sets, selected parameters could be very different although the data mining
method are the same. Therefore, for the purpose of the typical driving cycle development to
support for inventorying the emission of bus in Hanoi, I proposed using VSP as one of driving
cycle parameters. After that, I used the hierarchical agglomerative clustering method to
determine the set of representative variables of driving cycle based on the real-world driving.
These representative variables can be used to develop a typical driving cycle or an eco-driving
model for bus in Hanoi in next studies.
2. METHODOLOGY
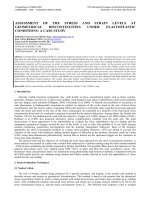
The overall methodology used to extract the representative variables of driving cycle for
bus in Hanoi is presented in Fig.1.
Selection bus routes
Collecting the real-world driving data
using GPS
Processing GPS data
Calculating the parameters of driving cycle
Extracting the representative variables of
driving cycle
Representative variables
Figure 1. Overall process extracting the representative variables of driving cycle.
318
Transport and Communications Science Journal, Vol. 71, Issue 4 (05/2020), 317-327
This study is part of our overall research to develop the CSEF for buses in Vietnam. In
our study, a GPS device (Garmin etrex vista HCx) with the frequency resolution of 1Hz was
used to collect real-world driving data on the fifteen bus routes in urban Hanoi. The realworld driving data collection was described in detail in our previous study, see [11]. In this
paper, I only focus on the representative variables extraction of driving data to achieve our
overall study purpose as blue highlighted in Fig.1 above.
2.1. Calculating the parameters of driving cycle
The collected GPS after processing was used to calculate the kinematics parameters of
the real-world driving data of bus in Hanoi. These parameters are presented in Table 1. The
definitions of these parameters are applied to a velocity profile consisting of n data rows of
time ti in second, and speed vi in kph, with 1 ≤ i ≤ n, as presented in Table 2 [1, 2, 14, 17].
No.
1
2
3
4
5
6
7
8
9
10
11
12
13
14
15
16
17
18
19
20
21
22
23
24
25
26
27
28
29
30
31
32
33
Table 1. The parameters of driving cycle.
Parameter
Abbreviations
Total time
T_total
Acceleration time
T_acc
Deceleration time
T_dec
Cruising time
T_c
Creeping time
T_cr
Idle time (speed = 0)
T_i
Time proportion of idling mode
P_i
Time proportion of acceleration mode
P_a
Time proportion of deceleration mode
P_d
Time proportion of cruising mode
P_c
Time proportion of creeping mode
P_cr
Total distance
Dist
Average trip speed
V1
Average driving speed
V2
Maximum speed
Vmax
Standard deviation of speed
Vsd
95th percentile of speed
P95V
Maximum acceleration
a_max
Minimum acceleration
a_min
Acceleration average
a_av
Average positive acceleration
a_pos_av
Average negative acceleration
a_neg_av
Root mean square of acceletration
RMSA
95th percentile of positive acceleration
P95PosAcc
95th percentile of negative acceleration
P95NegAcc
Standard deviation of acceleration
Acc_sd
Number of stops
N_stop
Number of stops per km
N_rate
Maximum VSP
VSPmax
Minimum VSP
VSPmin
Average positive VSP
VPSpos_av
Average negative VSP
VSPneg_av
Positive kinetic energy
PKE
319
Units
sec
sec
sec
sec
sec
sec
%
%
%
%
%
km
kph
kph
kph
kph
kph
m.sec-2
m.sec-2
m.sec-2
m.sec-2
m.sec-2
m.sec-2
m.sec-2
m.sec-2
m.sec-2
/km
W.kg-1
W.kg-1
W.kg-1
W.kg-1
m.sec-2
Transport and Communications Science Journal, Vol. 71, Issue 4 (05/2020), 317-327
Table 2. Definitions of driving cycle kinematics parameters.
Parameters
Definitions
Total distance
Dist = (t 2 − t1 )
Total time
T− total = t 2 − t1 + (t i − t i −1 )
n
v1
v
+ (t i − t i−1 ) i
3.6 i=2
3.6
n
i=2
−2
−1
t − t ( a 0.1m sec and v1 5 m sec )
T− c = 2 1 1
(else)
0
Cruising time
n t − t
( a 0.1m sec −2 and v i 5 m sec −1 )
+ i i −1 i
(else)
i =2
0
t 2 − t1 ( a1 0.1m sec −2 and v1 5 m sec −1 )
T_ cr =
(else)
0
Creeping time
n t − t
( a 0.1m sec −2 and v i 5 m sec −1 )
+ i i −1 i
(else)
i =2
0
Acceleration time
t − t (a 0.1m sec −2 ) n t i − t i −1 (a i 0.1m sec −2 )
T− acc = 2 1 1
+
(else)
(else)
0
i =2 0
Decceleration time
t − t (a − 0.1m sec −2 ) n t i − t i −1 (a i − 0.1m sec −2 )
T− dec = 2 1 1
+
(else)
(else)
0
i =2 0
Idling time
n
t − t (v = 0 and a1 = 0 )
t i − t i −1 (v1 = 0 and a1 = 0)
T− idle = 2 1 1
+
(else)
(else)
0
i =2 0
Time proportion of cruising mode
Time proportion of creeping mode
Time proportion of acceleration mode
P− c =
T− c
.100%
T− total
P− cr =
T− cr
.100%
T− total
P−acc =
320
T−acc
.100%
T− total
Transport and Communications Science Journal, Vol. 71, Issue 4 (05/2020), 317-327
Time proportion of deceleration mode
P− dec =
T− dec
.100%
T− total
P−stop =
T− idle
.100%
T− total
Average trip speed
V1 = 3.6
Dist
T− total
Average driving speed
V2 = 3.6
Dist
T− drive
Time proportion of idling mode
Standard deviation of speed
Acceleration average
Average positive acceleration
1 n 2
vi
n − 1 i =1
V−sd =
a −av =
1 n
a i (with N = T-total)
N i =1
−1
n
n 1 if a i 0)
a i (if a i 0)
a − pos−av =
1 0 (else)
i =1 0(else)
Average negative acceleration
−1
n 1 (if a i 0)
a − neg −av =
i =1 0(else)
Standard deviation of acceleration
Number of stops
Stops per km
Positive kinetic energy
Acc−sd =
n
a i (if a i 0)
(else)
0
1
1 n 2
ai
n − 1 i =1
n 1( v = 0 a = 0 v 0 a 0 )
i
i
i
i
N −stop =
i =1
0 (else)
N − rate =1000
PKE =
321
N −stop
Dist
n
v 2 − v 2i −1 (if v i v i −1 )
1
i
dist i =2 0
(else)
Transport and Communications Science Journal, Vol. 71, Issue 4 (05/2020), 317-327
Root mean square of acceletration
T
RMSA =
1 2
1 N 2
a
.dt
=
. a i
T 0
N i =1
where: N = T = T_total
Vehicle specific power
1 C .A
VSP ={a.(1 + ) + g.grade + g.C R}.v + a D v 3
2
m
Where: v - vehicle speed (assuming no headwind) ; a - vehicle acceleration; - mass
factorg (~ 0.1); grade - road grade (~ 0 for urban road); m – vehicle mass; g - acceleration of
gravity (9.81 m/s2); CR - coefficient of rolling resistance (0.008 ÷ 0.013); CD - drag coefficient
(0.5 ÷ 0.7); A - frontal area of the vehicle; a - ambient air density (~ 1.2 kg/m3).
In which, the frontal area of the vehicle is calculated as follows [4]:
A = (H – GC).W.0.93
Where: H – vehicle height (m); W – vehicle width (m); GC - ground clearance (m).
2.2. Extracting the representative variables of driving cycle
After the GPS data processing step, I collected 317 trip segments as detail described in
[10]. All of 317 trip segments were used to calculate the real-world driving cycle parameters
following to the definition as presented in Table 1. Therefore, I obtained the dataset consist of
317 rows and 33 columns in proportion to 317 trips and 33 driving cycle parameters. This
dataset was used to extract the representative variable of driving cycle by using the
hierarchical agglomerative clustering (HAC) method. The IBM SPSS Statistics software used
to perform this clustering. In this study, I used the furthest neighbor algorithm to measure the
distance between two clusters, called complete-link measurement, and used the absolute value
of Pearson correlation coefficient to measure the distance between variables. Using the
Pearson correlation coefficient measurement is more suitable than others because the driving
cycle parameters are very different in the value range and units. In addition, some driving
kinematic parameters are calculated based on others, hence, between these parameters can
have mutual correlation. This cause the results of searching for the typical driving cycle can
be misleading [8, 16]. Therefore, using the absolute value of Pearson correlation coefficient
(r) as the distance measure to agglomerate parameters into a cluster would be a suitable
approach.
3. RESULTS AND DISCUSSION
3.1. Real-world driving characteristics of bus in Hanoi
Using the definition of driving cycle parameters as mentioned above, I calculated the
driving cycle parameters of 317 trip segments. The characteristics of real-world driving data
of bus in urban Hanoi are presented in Table 3 below.
As can be seen in Table 3, the operation of the bus system in Hanoi has not yet reached
high efficiency. The average speed of 16.6 kph is smaller than the one of other countries, for
example bus in Beijing of 20.7 kph [8], bus in the Braunschweig city of 22.6 kph [2].
322
Transport and Communications Science Journal, Vol. 71, Issue 4 (05/2020), 317-327
Table 3. Real-world driving characteristics of bus in Hanoi.
Parameters
Average (*)
Units
Parameters Average (*)
T_total
T_acc
T_dec
T_c
T_cr
T_i
P_i
P_a
P_d
P_c
P_cr
Dist
V1
V2
Vmax
Vsd
P95V
3823.9
1408.6
1452.5
320.2
326.4
325.1
0.1
0.4
0.4
0.1
0.1
17.5
16.6
18.1
45.2
10.4
32.9
sec
sec
sec
sec
sec
sec
%
%
%
%
%
km
kph
kph
kph
kph
kph
a_max
a_min
a_av
a_pos_av
a_neg_av
RMSA
P95PosAcc
P95NegAcc
Acc_sd
N_stop
N_rate
VSPmax
VSPmin
VSPpos_av
VSPneg_av
PKE
3.5
-3
0
0.6
-0.5
0.6
1.5
-1.3
0.6
26.7
1.6
32.5
-25.2
2.6
-2.7
0.4
Units
m.sec-2
m.sec-2
m.sec-2
m.sec-2
m.sec-2
m.sec-2
m.sec-2
m.sec-2
m.sec-2
/km
W.kg-1
W.kg-1
W.kg-1
W.kg-1
m.sec-2
Note: (*) the average value of 317 values in proportion to 317 trips.
3.2. Clusters of driving cycle parameters
The calculated dataset above was used to reduce the number of parameters by using the
SPSS software with options for the HAC method as described in above. The agglomeration
schedule is presented in Table 4.
As shown in Table 4, in the first stage, the variable 23 (RMSA) and the variable 26
(Acc_sd) were combined in the first cluster because the Pearson correlation coefficient
between them is highest, r = 1.
The HAC algorithm does not give the conclusions of cluster numbers, therefore, the user
must do it. At present, there is no clear rule for determining cluster numbers [6]. In this study,
the more clusters numbers are, the more the representative parameters of driving cycle are,
and the better capturing the features of realistic driving patterns is. Therefore, the
representative driving cycle parameters should be kept more. However, this can cause the
iteration process to find the typical driving cycle becomes an infinite loop. In this study, I
proposed two cases to agglomeration variables into clusters, one case with r 0.8, called Case
1, and the other with r 0.7, called Case 2. The number of final clusters were determined
based on the agglomeration schedule of 33 driving cycle variables, see Table 4. For Case 1,
the clustering process only stop at stage of 13 with the correlation coefficient of 0.84, the
number of final clusters are 20 clusters. For Case 2, the clustering process only stop at stage
of 17 with the correlation coefficient of 0.764, the number of final clusters are 16 clusters.
The number of final clusters retained are the number of representative parameters of driving
cycle. However, Dist and T_total variables do not reflect the real-world driving pattern, they
depend mainly on the infrastructure of bus routes, therefore, these two parameters cannot be
323
Transport and Communications Science Journal, Vol. 71, Issue 4 (05/2020), 317-327
used to describe the real-world driving characteristics [1, 16]. Therefore, the representative
parameters of driving cycle determined for two cases are described in Table 5.
Table 4. The agglomeration schedule of 33 driving cycle variables.
Stage
1
2
3
4
5
6
7
8
9
10
11
12
13
14
15
16
17
18
19
20
21
22
23
24
25
26
27
28
29
30
31
32
Cluster Combined
Cluster 1 Cluster 2
23
26
21
33
13
14
31
32
22
23
2
3
6
7
1
2
21
22
4
10
5
11
27
28
21
24
5
13
16
17
25
31
6
8
21
25
6
9
18
29
1
12
19
30
15
16
5
27
18
19
18
21
5
6
4
18
5
15
1
5
4
20
1
4
Coefficients
1.000
.963
.958
.955
.955
.943
.938
.910
.908
.901
.900
.871
.840
.786
.785
.782
.764
.674
.668
.650
.622
.558
.519
.426
.282
.216
.208
.170
.035
.003
.003
.000
Stage Cluster First Appears
Cluster 1
Cluster 2
0
0
0
0
0
0
0
0
0
1
0
0
0
0
0
6
2
5
0
0
0
0
0
0
9
0
11
3
0
0
0
4
7
0
13
16
17
0
0
0
8
0
0
0
0
15
14
12
20
22
25
18
24
19
10
26
27
23
21
29
28
0
30
31
Next Stage
5
9
14
16
9
8
17
21
13
28
14
24
18
24
23
18
19
26
27
25
30
25
29
27
26
28
29
31
30
32
32
0
As can be seen in Table 5, the extracted representative variables in this study include
most of the representative variables that were determined in other studies. In addition, the
number of kept variables in this study is higher. Therefore, the ability of maintaining integrity
of the real-world driving characteristics during the development of the typical driving cycle is
also better. In addition, to demonstrate the necessity of representative variables determination
of driving cycle before developing a typical driving cycle, I used the clustering method used
by Torp et al (2013) for the real-world driving data of bus in Hanoi; the extraction result of
representative variables is presented in “Case 0” in Table 5. Comparison between three cases,
I can find that the number of variables kept in Case 1 and Case 2 are higher than Case 0.
324
Transport and Communications Science Journal, Vol. 71, Issue 4 (05/2020), 317-327
Therefore, the ability of capturing the real-world driving characteristics of Case 1 and Case 2
are better than Case 0. In addition, as said in Section 2.2, between variables can have mutual
correlation causing the results of searching for the typical driving cycle can be misleading. In
other words, using the Pearson correlation coefficient as a distance measure between clusters
to determine the representative variables of real-world driving data is a suitable approach.
Parameters
P_c
P_cr
P_i
P_a
P_d
V1
Vmax
Vsd
P95V
a_max
a_min
a_av
PKE
P95NegAcc
N_rate
VSPmax
VSPmin
VSPpos_av
N-stop
Total (d)
Table 5. The representative parameters of driving cycle.
In this study
Other studies
Brady et al.
Torp et al.
(a)
(a)
(c)
Case 1
Case 2
Case 0
(2013)
(2013)
(b)
(c)
(b)
18
14
8
10
8
14
(a)
Notes.
Hierarchical agglomerative clustering method with the distance measure of
Pearson correlation coefficient; (b) Regression analysis method; (c) Hierarchical
agglomerative clustering method with the distance measure proposed by Torp et al (2013);
(d)
Total selected representative variables including ones which are not used in this study.
In addition, as presented in Table 5, the kept variables in Case 0 are very different from
ones determined in [16] although the used clustering method is the same but for two different
real-world driving datasets. To make the decision about the choice of the representative
variables according to Case 1 or Case 2, I brought these variables into the computer program
developed to construct the typical driving cycle that has been published in a separate paper
[11]. For two running times in proportion to two cases, I found that using the 18
representative variables of Case 1 failing to make the loop stop, it becomes an infinite loop.
325
Transport and Communications Science Journal, Vol. 71, Issue 4 (05/2020), 317-327
Therefore, I proposed using the 14 representative variables of Case 2 for the purpose of
typical driving cycle development.
4. CONCLUSION
Determining the least number of driving parameters that can well capture the real-world
driving characteristics and take them in the typical driving cycle is very necessary to develop
the CSEF and the eco-driving model. However, the real-world driving characteristics can be
different from one region to another. Therefore, using the representative variables by
inheriting the previous study results that those determined based on the set of different driving
data could cause losing important information. It is very necessary to determine the
representative variables of the driving data based on the driving data set used to develop the
driving cycle. Therefore, in this study, the real-world driving data of 15 bus routes in Hanoi
were used to determine the representative variables of driving cycle for purposing the typical
driving cycle development. The HAC algorithm using the distance measure of Pearson
correlation coefficient used to extract the representative variables from 33 initial variables. A
total of 14 representative variables were selected. This study has affirmed that the selected
variables could be very different, even when applying the same data mining method on
different dataset. Hence, future investigations should determine the driving cycle
representative variables based on their own input data instead of following the experience of
previous studies.
ACKNOWLEDGMENT
This research is funded by University of Transport and Communications (UTC) under grant
number T2020-MT-002.
REFERENCES
[1]. A. Ashtari, E. Bibeau and S. Shahidinejad, Using Large Driving Record Samples and a Stochastic
Approach for Real-World Driving Cycle Construction: Winnipeg Driving Cycle Transportation
Science, 48 (2014) 170 - 183. />[2]. T. J. Barlow, S. Latham, I. S. McCrae and P. G. Boulter, A reference book of driving cycles for
use in the measurement of road vehicle emissions, Department for Transport, UK, 2009.
[3]. J. Brady, M. O'Mahony, The development of a driving cycle for the greater Dublin area using a
large database of driving data with a stochastic and statistical methodology, Proceedings of the
ITRN2013, Trinity College Dublin, 2013.
[4]. K. N. Edward, G. Robert, Fuel consumption modeling of conventional and advanced technology
vehicles in the physical emission rate estimator (PERE), Office of Transportation and Air Quality,
EPA, 2005.
[5]. V. Franco, M. Kousoulidou, M. Muntean, L. Ntziachristos, S. Hausberger, P. Dilara, Road
vehicle emission factors development: A review, Atmospheric Environment, 70 (2013) 84 - 97.
/>[6]. Hoang Trong, Chu Nguyen Mong Ngoc, Phan tich du lieu nghien cuu voi SPSS, NXB Hong Duc,
2008.
[7]. W. T. Hung, H. Y. Tong, C. P. Lee, K. Ha, L. Y. Pao, Development of a practical driving cycle
construction methodology: A case study in Hong Kong, Transportation Research part D: Transport
and Environment, 12 (2007) 115-128. />[8]. J. Lai, L. Yu, G. Song, P. Guo, X. Chen, Development of City-Specific Driving Cycles for
Transit Buses Based on VSP Distributions: Case of Beijing, Journal of Transportation Engineering,
139 (2013) 749-757. />326
Transport and Communications Science Journal, Vol. 71, Issue 4 (05/2020), 317-327
[9]. P. Lipar, I. Strnad, M. Česnik, T. Maher, Development of urban driving cycle with GPS data post
processing,
Promet–Traffic&Transportation,
28
(2016)
353-364.
/>[10].Y.-L. T. Nguyen, N.-D. Bui, T.-D. Nghiem, A.-T. Le, GPS data processing for driving cycle
development in Hanoi, Vietnam, Journal of Engineering Science and Technology (2019). (in press).
[11].Y.-L. T. Nguyen, T.-D. Nghiem, A.-T. Le, N.-D. Bui, Development of the typical driving cycle
for buses in Hanoi, Vietnam, Journal of the Air & Waste Management Association, 69 (2019) 423437. />[12].Y. Qi, A. Padiath, Q. Zhao, L. Yu, Development of operating mode distributions for different
types of roadways under different congestion levels for vehicle emission assessment using MOVES,
Journal of the Air & Waste Management Association, 66 (2016) 1003-1011.
/>[13].W. Saleh, R. Kumar, H. Kirby, P. Kumar, Real world driving cycle for motocycles in Edinburgh,
Transportation Research part D: Transport and Environment, 14 (2009) 326-333.
/>[14].Q. Shi, Y. Zheng, R. Wang, Y. Li, The study of a new method of driving cycles construction,
Procedia Engineering, 16 (2011) 79-87. />[15].H. Y. Tong, H. D. Tung, W. T. Hung, H. V. Nguyen, Development of driving cycles for
motorcycles and light-duty vehicles in Vietnam, Atmospheric Environment, 45 (2011) 5191-5199.
/>[16].E. Torp and P. Önnegren, Driving cycle generation using statistical analysis and Markov chain,
Department of Electrical Engineering, Likopings University, Sweden, 2013.
[17].F. Zheng, J. Li, H. van Zuylen, C. Lu, Influence of driver characteristics on emissions and fuel
consumption,
Transportation
Research
Procedia,
27
(2017)
624-631.
/>
327