Qualitative and quantitative genetic variations in the F2 inter varietal cross of rice (Oryza sativa L.) under aerobic condition and parental polymorphism survey
Bạn đang xem bản rút gọn của tài liệu. Xem và tải ngay bản đầy đủ của tài liệu tại đây (628.4 KB, 11 trang )
Int.J.Curr.Microbiol.App.Sci (2017) 6(4): 2215-2225
International Journal of Current Microbiology and Applied Sciences
ISSN: 2319-7706 Volume 6 Number 4 (2017) pp. 2215-2225
Journal homepage:
Original Research Article
/>
Qualitative and Quantitative Genetic Variations in the F2 Inter Varietal Cross
of Rice (Oryza sativa L.) under Aerobic Condition and
Parental Polymorphism Survey
N. Shashidhara*, Hanamareddy Biradar and Shailaja Hittalmani
Marker Assisted Selection Laboratory, Department of Genetics and Plant Breeding,
University of Agricultural Sciences, Bangalore-560065, India
*Corresponding author
ABSTRACT
Keywords
F2, Oryza sativa,
Grain protein
content (GPC),
Rice and
Segregating lines.
Article Info
Accepted:
20 March 2017
Available Online:
10 April 2017
Currently available rice varieties contain low percent of protein and many deficiency
symptoms are predominantly seen in rice eating population are observed. To improve the
efficiency of breeding for total grain protein in rice, a thorough understanding of the
genetics of the trait concerned is essential. In order to address this problem we have
identified promising local indica rice, (HPR14), which possesses relatively higher protein
than cultivated rice. The rice protein normally posses 7-8 percent while the donor genotype
identified has an average of 14.1 percent total protein. The initial results on the segregation
for protein content indicated 3.5-18 percent of protein variation among the 1267 F 2
segregating lines. In order to transfer these valuable traits into popular rice variety BPT –
5204, crosses were made and F2segregating lines were developed. The parental plants were
surveyed using 402 rice SSR markers, out of which 69 (17.20%) showed polymorphism on
agrose gel, 81 (20.00%) on PAGE and 252 were monomorphic (indicating homology
between the parents). In F2 field evaluation, we could observed clear cut segregation and
top hundred lines were selected based on yield and segregation for protein content.
Introduction
As a pivotal crop in cereal, rice provides the
staple food for more than 50% of the world’s
population. It supplies 23 per cent of global
per capita energy and 16 per cent of protein.
The consumption of rice is declining in
developing countries because of its own
limitation viz., low protein, fat and
micronutrients especially Iron and Zinc.
Globally, rice is grown on about 150 m ha
and Asian countries account for 90 percent of
its area. India ranks first in area (44.8 m ha)
and second in production (90 mt) among rice
producing countries, in terms of productivity
India ranks 9th (Anonymous, 2007). Grain
Protein content (GPC) is the macro nutrients
essential for building up the human body.
They are called macro nutrients because they
form the bulk of the food. Many proteins are
enzymes that catalyze biochemical reactions
and are vital to metabolism. Proteins also
have structural or mechanical functions, such
as actin and myosin in muscle and the
proteins in the cytoskeleton, which form a
system of scaffolding that maintains cell
shape.
After the achievement of sufficient yield by
developing high yielding varieties, the
2215
Int.J.Curr.Microbiol.App.Sci (2017) 6(4): 2215-2225
demand for grain quality is increasing day by
day among the predominantly rice consuming
peoples. In the early 1960’s (green revolution
era) primary attention was given to increasing
rice yield. Even as late as 1970’s when
widespread drought and floods drastically
reduced food grain levels, the world primary
emphasis was on the quantity of food
produced and not on its quality. Earlier
decades of rice breeding started with a sole
objective of increasing yield and developing
disease and pest resistant types, and now a
days is currently devoting increasing attention
to grain quality.
Most rice varieties
developed so far are high grain yield with low
protein ranging from 7 to 8 percent. Breeding
for high yield in rice is mainly focused on
production than the nutritional enhancement
to feed the large rice eating population. As
such protein deficiency is predominant in rice
consuming population hence; enhancement of
total protein in rice is of immense importance
for nutritional security as food security.
Hence the current study was conducted to
develop high grain protein segregating line as
a sole objective.
statistical analysis. Twenty one days nursery
seedlings were transplanted in main
experimental field with 20cm X 20 cm
spacing and minimum of five plants were
maintained in each line. The crop was raised
in aerobic condition with regular irrigations
once in 5-7 days. Recommended cultural
practices for Aerobic rice were carried out to
ensure uniform crop stand as per the package
of practices (Anonymous, 2004).
Materials and Methods
Days to maturity (days): The number of
days from the date of sowing to harvesting
was recorded at the time of harvest by each
genotype.
Plant materials
Phenotypic characterization and estimation
of quantitative, qualitative, genotypic and
phenotypic components of F2 segregating
lines
1267 lines were evaluated for various
phenotypic/morphological, grain qualities,
major and minor nutrient parameters as per
the standard procedures and the details are
given below.
Days to 50 per cent flowering (days): Total
number of days taken by genotype/line for
flowering from the sowing day to opening of
first flower of the plants.
Diverse genetic back ground of parents BPT
5204 (good grain qualities and high yield) and
HPR 14 (high protein content; Shailaja
Hittalmani, 1990) were crossed and
developed One thousand two hundred and
sixty seven segregating lines and selection
were carried out for high protein line with
good grain quality parameters in F2 (Table 1).
Biomass weight per plant (g): After
harvesting the panicles and straw about 2-3
cm above ground level. It was sun dried and
the weight was recorded in grams. The total
weight of straw was considered as total
biomass weight per plant.
Experimental site and layout
Plant height (cm): The plant height was
recorded by measuring total height from the
base of the plant to the tip for the main
panicle expressed in centimeters.
The experiment was laid out in augmented
design at Farmer’s field, Devanahalli,
Bengaluru North Taluk during Kharif– 2006
and the observations were recorded on
selected individual plants and used for
Number of productive tillers per plant:
Number of productive tillers was recorded by
2216
Int.J.Curr.Microbiol.App.Sci (2017) 6(4): 2215-2225
counting the tiller bearing panicles at the time
of harvest.
Number of panicles per plant: The total
number of panicles was counted per plant at
harvest. This is also equal to the number of
productive tillers per plant.
Panicle length (cm): The length of the
panicle from its base to tip in centimeters
excluding awns was measured at the time of
harvest recorded.
Number of fertile spikelets per panicle: The
number of filled grains per panicle was
counted and recorded after harvest.
Grain weight per plant (g): Total weight of
all the filled grains per plant was estimated
and expressed in grams.
Test weight (g): In each of the segregating
lines, 1000 well filled grains were counted
and their weight was recorded in grams as
100 grain weight.
Harvest index: The proportion of grain yield
to biological yield of a plant as suggested by
Donald (1962) was computed to calculate
harvest index.
breadth in centimeters of ten grains. Average
breadth of ten paddy grains was recorded as
paddy grain breadth.
Length to Breadth (L/B) ratio of paddy
grain: Ratio of length to breadth (L/B) of
paddy grain was obtained by dividing the
length of each grain by its corresponding
breadth.
Length of rice kernel (mm): Ten dehusked
and polished rice kernels of each line were
arranged lengthwise for the cumulative
measurement of length in centimeter of ten
grains. Average length of the rice kernels
recorded as rice kernel length.
Breadth of rice kernel (mm): Ten dehusked
and polished rice kernels of each line were
arranged breadth wise for the cumulative
measurement of breadth in centimeter of ten
grains. Average breadth of the rice kernels
recorded as rice kernel breadth.
Length to Breadth (L/B) ratio of rice
kernel: The ratio of length to breadth (L/B)
of dehusked and polished grain was obtained
by dividing the length of each grain by its
corresponding breadth.
Length of paddy grain (mm): Ten paddy
grains of each line were arranged lengthwise,
for the cumulative measurement of length in
centimeters of ten grains. Average length of
the paddy grains was recorded as paddy grain
length.
Protein (%): Standard micro Kjeldhal
method was followed for determining
Nitrogen content in the selected lines under
study and correction factor 6.25 is multiplied
to get crude protein percentage.
Breadth of paddy grain (mm): Ten paddy
grains of each line were arranged breadth
wise, for the cumulative measurements of
Total Nitrogen (%): Standard micro
Kjeldhal method was followed for
determining Nitrogen content.
2217
Int.J.Curr.Microbiol.App.Sci (2017) 6(4): 2215-2225
Phosphorus (%): Phosphorus was estimated
using a suitable aliquot of the above extract
by vanodomolybdophosphoric yellow colour
method (Jackson, 1973).
Potassium (%): Potassium content in plant
was estimated by feeding the digested extract,
after suitable dilution using flame photometer
(Jackson, 1973).
Where, Vg = Genotypic variance; Vp=
Phenotypic variance; Ve = Environmental
variance
Phenotypic and Genotypic coefficient of
variation: The phenotypic and genotypic
coefficients of variation (PCV and GCV)
were computed as per Burton and Dewane
(1953) from the respective variances.
Micronutrients (ppm): Micronutrients (Zn,
Fe Cu and Mn) were estimated by feeding the
digested extract after suitable dilutions, using
Atomic
Absorption
Spectrophotometer
(Perkin Elmer model Analyst-400).
Phenotypic Variance (Vp): Phenotypic
variance was calculated by using the
following formula.
Σx –
Vp =
(Σx)2/N
N-1
Where, ∑= Summation; X = an observation;
X2 = Square of an observation; N = Number
of observation.
Environmental
Variance
(Ve):
Environmental variance for each character
was estimated from the mean variance of non
segregating
parental
populations.
Environmental variance (Ve) was calculated
by using the following formula.
Ve =
Vp1 – Vp2
2
Where, Vp1= Phenotypic variance of parent
one; Vp2= Phenotypic variance of parent two
Genotypic Variance (Vg): Genotypic
variance was separated from the total variance
by subtracting the environmental variance as
per the method formulated by Webber and
Moorthy(1952).
PCV and GCV were classified according to
Robinson et al., (1966) that,
0-10%
: Low
10-20%
: Moderate
20% and above : High.
Heritability (h2): Broad sense Heritability
was calculated as ratio of genotypic variance
to phenotypic variance as per the formula
suggested by Johnson et al., (1955) and
Hanson et al., (1956).
h
2
G e n o ty p ic v a ria n c e
100
P h e n o ty p ic v a ria n c e
Where, h2 = Heritability; Vg = Genotypic
variance; Vp = Phenotypic variance
Heritability percentage was categorized as
follows (Robinson et al.1966)
0-30%
: Low
30-60%
: Moderate
60% and above : High
Genetic advance (GA): Genetic advance was
calculated by using formula given by Johnson
et al., (1955).
Vg = Vp – Ve
GA = h2 x σp x k
2218
Int.J.Curr.Microbiol.App.Sci (2017) 6(4): 2215-2225
Where, h2 = Heritability (Broad sense); σp=
Phenotypic standard deviation
k = selection differential which is 2.06 at 5%
intensity of selection (Lush, 1949).
To compare the extent of predicted genetic
advances of different characters under
selection, genetic advance as per cent of mean
was computed as devised by Johnson et al.,
(1955).
GA
G A as per cent of m ean
×100
G ra n d m e a n
The GA as per cent mean was classified
(Johnson et al.1955) as given below:
0-10 %
: Low
10-20 %
: Moderate
20% and above : High
variability is partitioned into heritable and
non-heritable components with suitable
genetic parameters such as genotypic
coefficient of variation (GCV), phenotypic
coefficient of variation (PCV), heritability
(h2) and genetic advance as percent mean
(GAPM). The phenotypic coefficient of
variation was higher than genotypic
coefficient of variation for all the characters
and the difference between these two was
observed to be low, which indicated less
influence of environment on the trait
expression. High heritability coupled with
higher GAPM indicated the more of additive
gene action with fast and effective selection
for the trait under consideration. The
estimation of these variability parameters
helps the breeder in achieving the required
crop improvement by selection (Fig.1 and 2).
Variation for total grain protein content
and grain quality parameters
Parental polymorphism survey
402 Simple Sequence Repeats (SSRs) were
surveyed for parental polymorphism both on
Agarose Gel Electrophoresis (AGE) and Poly
Acrylamide Gel Electrophoresis (PAGE).
Statistical analysis
The obtained field data were subject
STASTICA and SPAR1 to compute all the
genetic parameters to partition the variance.
Simple
correlation
coefficients
were
determined as reported by Sunderraj et al.,
1972.
Results and Discussion
The availability of genetic variability is
prerequisite for crop improvement. Important
quantitative characters like yield, GPC mainly
influenced by large number of genes and also
greatly influenced by environmental factors.
The variability is the sum total of hereditary
effects of concerned genes as well as
environmental
influence.
Hence,
the
Wide range of TGP content (5.25% to
18.43%) with an average of 11.85% was
recorded in base population of F2 segregating
generation indicating there is wide
potentiality to develop high protein lines
using this segregating population. Moderate
PCV (16.73%) and GCV (11.73%) with
moderate h2 (49.11%) coupled with moderate
GAPM (16.93%) were recorded. However, in
selected hundred lines, it ranges from 5.25 to
18.43% with an average of 12.01% with
moderate PCV (19.57%) and GCV (15.63%)
as well as high h2 (63.79%) coupled with high
GAPM (25.72%) was recorded (Table 2 and
3). These estimates of h2 and GAPM,
indicated that the GPC mainly controlled by
additive gene action and higher h2 coupled
with higher GAPM in selfing generation
indicating that more of additive gene action
and selection is effective for the trait under
consideration. Higher heritability and GAPM
in selected lines indicated that both additive
and non-additive gene action for the trait
under consideration.
2219
Int.J.Curr.Microbiol.App.Sci (2017) 6(4): 2215-2225
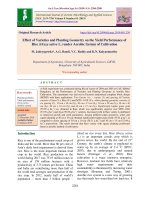
Table.1 Salient features of parents selected for the present study
Character
BPT – 5204
HPR – 14
Parent
Protein content
Female
Low (7.90 to 8.10%)
Male
High (14.1%)
Plant colour
Leaf colour
Sheath colour
Plant stature
Tillering ability
Number of panicles
Grain yield
Grain type
Green
Green
Green
Short (60-70cm)
High (20)
More (15-18)
High(26g/plant)
Short Fine
Purple
Purple
Purple
Tall (above 90cm)
Low (10 - 16)
Less (10 - 14)
Medium(23g/plant)
Short Bold
Table.2 Genetic parameters estimated in F2 segregating lines in base population
Range
PCV (%) GCV (%)
h2 (%)
GAPM
Minimum
Maximum
11.85
5.25
18.43
16.73
11.73
49.11
16.93
Protein
6.15
3.70
7.00
13.69
11.83
94.65
21.06
GL
2.69
2.00
3.20
11.53
10.80
68.33
18.86
GB
2.21
1.42
3.30
18.24
12.62
29.00
25.32
GLBR
5.43
4.50
6.80
7.80
7.35
88.83
14.26
KL
1.99
1.10
2.52
11.52
7.35
88.83
14.26
KB
2.77
1.96
3.54
14.86
13.50
82.35
25.22
KLBR
1.87
0.73
3.96
30.49
27.04
78.53
49.32
Nitrogen
0.16
0.07
0.38
27.41
25.45
85.00
48.00
Phosphorous
0.16
0.08
0.38
29.48
27.16
90.00
54.65
Potassium
5.61
3.30
18.30
22.99
18.75
66.52
31.50
Copper
26.67
2.88
35.17
27.31
26.73
95.78
53.89
Zinc
7.83
3.74
11.49
19.77
17.91
82.04
33.41
Manganese
44.92
24.67
66.43
23.02
22.45
95.12
45.11
Iron
118.88
89
199
11.66
10.47
80.66
19.38
DF
163.85
126
205
6.54
5.22
63.66
8.58
DM
85
61
155
16.47
15.74
91.22
30.96
PH
48.71
20.21
111.74
46.49
45.00
93.70
79.74
Biomass
22.25
12
30
19.63
15.19
59.94
24.23
NOT
17.00
8
26
43.81
39.44
76.57
64.67
NOP
18.00
12
28
19.22
15.01
91.00
21.34
PL
83.37
37.74
98.63
11.53
10.42
87.70
23.03
SFP
20.1
10.24
31.59
45.13
35.56
95.58
36.76
GY
15.20
10.70
20.90
33.38
30.13
62.86
34.12
TW
0.34
0.10
0.45
30.23
27.52
72.84
38.45
HI
Key: TGP – Total grain protein (%); KL - Kernel length (mm); PH – Plant height (cm); Fe – Iron (ppm); GYP –
Grain yield per plant (g); KB – Kernel breadth; DF – Days to 50% flowering; N - Nitrogen (%); GL - Grain length
(mm); KLBR – Kernal L: B ratio; P - Phosphorous (%); GB - Grain breadth (mm); DF – Days to 50% flowering; K Potassium (%); GLBR – Grain L: B ratio; DM – Days to maturity; Zn – Zinc (ppm).
Parameters
Mean
2220
Int.J.Curr.Microbiol.App.Sci (2017) 6(4): 2215-2225
Table.3 Genetic parameters estimated in F2 segregating lines in selected population
Parameters
Range
Mean
Minimum
Maximum
PCV (%)
GCV (%)
h2 (%)
GAPM
Protein
12.01
5.25
22.83
19.57
15.63
63.79
25.72
GL
6.88
5.60
7.90
18.79
13.50
96.71
24.38
GB
2.92
2.0
3.6
23.21
18.45
76.52
13.06
GLBR
2.58
2.00
3.65
25.50
14.42
22.50
18.23
KL
5.51
4.1
6.0
8.13
7.69
89.64
15.01
KB
2.02
1.60
2.50
10.52
9.28
77.78
18.85
KLBR
2.71
1.96
3.65
11.95
10.11
71.43
27.59
Nitrogen
1.98
0.73
2.96
48.69
47.28
98.98
49.94
Phosphorous
0.16
0.07
0.27
26.59
26.08
85.00
46.56
Potassium
0.15
0.08
0.27
28.46
27.82
90.00
52.76
Copper
5.56
3.31
15.50
22.65
18.20
64.56
38.13
Zinc
26.74
2.88
30.17
26.72
26.14
95.69
52.67
Manganese
7.73
3.69
11.29
19.36
17.40
80.81
32.23
Iron
42.99
24.14
61.43
26.15
25.61
95.87
51.65
DF
120.96
95
158
8.97
7.42
68.43
12.65
DM
162.92
137
189
6.82
5.81
64.05
8.83
PH
85.36
61
113
16.88
16.16
91.63
21.86
Biomass
43.64
16.25
144.00
36.10
35.91
88.92
63.57
NOT
21.77
12
29
22.08
19.04
74.38
33.83
NOP
17.05
9
25
46.27
32.67
74.44
65.29
PL
18.62
12
28
20.35
16.11
83.93
20.26
SFP
85.05
65.52
99.1
18.26
17.51
91.90
34.57
GY
25.17
2.2
31.59
38.27
36.63
94.19
44.67
TW
20.78
11.7
24.2
20.04
18.00
60.87
25.13
HI
0.15
0.05
0.41
40.00
38.49
70.00
32.73
Table.4 DNA markers used for detecting parent polymorphism of BPT 5204 and HPR 14
Number of bands
Marker type
SSR
(3% agarose)
SSR
(12% PAGE)
No. of
markers
Poly
morphic
Mono
morphic
402
69
402
81
Average number of bands
Percent
polymorphism
Total
Poly
morphic
Mono
morphic
Total
333
402
0.17
0.82
1.00
17.20
321
402
0.20
0.80
1.00
20.00
2221
Int.J.Curr.Microbiol.App.Sci (2017) 6(4): 2215-2225
Fig.1 Some of the selected genotypes in F2 population along with
parents (BPT-5204 and HPR-14)
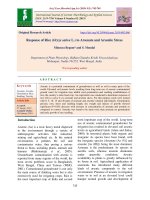
Fig.2(A) Frequency distribution for total grain protein content in F2 segregation population of
BPT – 5204 X HPR – 14 in base population and (B) in selected hundred lines
A
B
2222
Int.J.Curr.Microbiol.App.Sci (2017) 6(4): 2215-2225
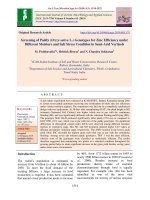
Fig.3 Parental polymorphism using SSR markers for the parents
BPT 5204 (a) and HPR 14 on 9% PAGE gel
Key:
L – 100 bp ladder
1 – RM 3376
2 – RM 3866
3 – RM 4348
4 – RM 1335
5 – RM 1959
6 – RM 2819
7 – RM 2878
8 – RM 3153
9 – RM 3508
10 - RM 3496
11- RM 3808
12 – RM 3912
13 – MRG 4568ARS
14 - RM 3515
15 – RM 3025
16 – RM 5055
17 – RM 166
18 – RM 2197
19 – RM 2224
20 – RM 4455
21 – RM 5352
22 – RM 3668
23 – RM 3625
24 – MRG 1734RG
25 – RM 5599
26 – RM 3283
27 – RM 5128
28 – RM 544
29 – RM 555
The distribution frequency for GPC in the
segregating population showing an expected
normal in both base as well as selected
population, providing a fast and effective
selection for the trait under consideration in
this population. Obtained results are in line of
Raju et al., (2004), Vanaja and Luckins
(2006), Das et al., (2007), Sarkar et al.,
(2007) and Abdual (2008).
Grain quality parameters in this segregating
population were also recorded as the same
trend of inheritance of GPC and recorded
almost same as the BPT – 5204
characteristics, which encourages us for
further development in these lines.
Moderate to higher variability (PCV and
GCV), h2and genetic advance indicating that
additive gene action for these traits under
consideration and selection will be effective.
30 – RM 500
31 – RM 503
32 – RM 463
33 – RM 147
34 – RM 431
35 – RM 14
36 – RM 522
37 – RM 535
38 – RM 556
39 – RM 288
40 – RM 552
41 – RM 456
42 – RM 484
43 – RM 245
44 – RM 454
45 – RM 548
46 – RM 558
47 – RM 457
48 – RM 27
Moderate to higher co-efficient of variation
indicates more variability for the characters
intern it will helps us to carryout the selection
process effectively for most of the traits both
in base as well as selected population.
However, lower phenotypic and genotypic coefficient of variation and higher heritability
coupled with moderate to high GAPM was
recorded for grain length and kernal length
indicating that non-additive gene action for
these traits under consideration and selection
is not effective with low co-efficient of
variation indicates less variability for the
characters intern it can be used for
exploitation of heterosis for this particular
trait. Similar results were reported by Mini
(1989), Das et al., (2007) and Abdual (2008).
However, Vanaja and Luckins (2006)
reported low values of PCV and GCV for
grain length.
2223
Int.J.Curr.Microbiol.App.Sci (2017) 6(4): 2215-2225
Variation for major and minor nutrients
Since, population derived from indica parents,
all micronutrients content were high in F2
segregating
lines.
Similarly,
higher
micronutrient content was reported by Zeng et
al., (2005, 2006). They indicated that the
micronutrients like zinc, iron, manganese,
copper content were high in japonica
followed by indica types.
Moderate to high phenotypic and genotypic
variability, high heritability coupled with high
genetic advance was observed for all nutrients
studied except copper and manganese which
were showed moderate heritability with
moderate genetic advance. Hence, these
indicates that the additive gene action playing
for the traits, therefore selection is effective in
these segregating population for nutrient
parameters except for copper and manganese.
Variation for yield and yield attributing
traits
The range in mean value reflects the extent of
phenotypic variability present in breeding
material. The values include genetic,
environmental and genotype x environmental
interaction components. So, the estimation of
genetic (heritable) and environmental (nonheritable) components of the total variability
was required to identify the probable parents.
Thus, in the present study coefficient of
variability, heritability and predicted genetic
advance was compound in respect of growth,
yield and its components.
The phenotypic coefficient of variation was
comparatively higher than the corresponding
genotypic coefficient of variation for the most
of the morphological characters studied
indicating
significant
genotype
by
environment (G X E) interactions. This
difference between genotype and phenotype
coefficient variations was relatively low for
some of the characters. Higher heritability
coupled with moderate to higher GAPM
recorded for all the parameters both in base as
well as selected population indicating there is
a potential to select good segregating lines for
the trait under consideration, except days to
maturity recorded lower GAPM. Recorded
results are in the line of Nandarajan and
Rajeshwari (1993) and Ahmed and Das
(1994).
DNA marker
polymorphism
validation
for
parental
Molecular markers are efficient tools for
selecting good genotype in plant breeding.
Seventeen rice microsatellites markers
specific to protein were already mapped in
different mapping population by various
workers (Wang et al., 2008; Zhang et al.,
2008; Tan et al., 2001). Utilization of already
mapped specific markers for protein helps in
selection of high protein alleles in the
genotypes.
Totally 402 rice microsatellite (SSR) markers
screened on BPT - 5204 and HPR–14
genotypes. The amplified products were
resolved on 3% agarose and 12 % PAGE gel.
The number of total and polymorphic bands
generated on agarose and PAGE. Out of 402
markers, 69 were polymorphic on 3% agarose
and 81 were polymorphic on 12% PAGE. On
an average, 17.20 percent on 3 percent
agarose and 20.00 percent polymorphism on
PAGE (Table 3 and Fig. 3).
In conclusion the initial results on the
segregation for protein content indicated 3.518.0 percent of protein variation among the
1267 F2 segregating lines developed using
BPT-5204 and HPR-14. And also the
developed F2 population is highly potential to
develop high protein lines and showed clear
cut segregation pattern for the trait under
consideration and fine mapping can be done
to select the high protein genotype.
2224
Int.J.Curr.Microbiol.App.Sci (2017) 6(4): 2215-2225
Acknowledgements
We sincerely thanks to the Department of
Biotechnology (DBT), New Delhi and
University Grants Commission (UGC), New
Delhi for the financial support.
References
Abdual, B.H. 2008. Genetic variation for grain
quality, protein and micronutrients in F2
generation of BPT – 5204 X HPR – 14 in rice
(Oryza sativa L.) under aerobic condition. M.
Sc thesis, University of Agricultural Sciences,
Bangalore.
Ahmed, T. and Das, G.R. 1994. Evaluation and
characterization of gelatinous rice germplasm
of Assam. Oryza, 31: 77-83.
Anonymous.
2004.
Adikailuvarigeadunikabesayapaddhathigalu
package of practices for field crops. Univ.
Agril. Sci., Bangalore.
Das, S., Subudhi, H.N. and Reddy, J.N. 2007.
Genetic variability in Grain quality
characteristics and yield in lowland rice
genotypes. Oryza, 44(4): 343-346.
Ganapathy, S., Ganesh, S.K., Vivekanandan, P.,
Shanmugasundaram, P and Babu, R.C. 2007.
Variability and interrelationship between
yield and physiomorphological traits in rice
(Oryza sativa L.) under moisture stress
condition. Crop Res. Hisar., 34(1/3): 260262.
Mini, 1989. Studies on genetic variability, character
association and path analysis in aromatic rice
(Oryza sativa L.). M.Sc. (Agri.) Thesis, Univ.
Agri. Sci. Bangalore, pp.75.
Raju, C.H.S., Rao, M.V.B. and Sudarshaa, A. 2004.
Genetic analysis and character association in
F2 generation of rice, Madras Agri. J.,
91(1/3): 66-69.
Sarkar, K.K., Bhutia, K.S., Senapati, B.K. and Roy,
S.K. 2007. Genetic variability and character
association of quality traits in rice (Oryza
sativa L.) Oryza, 44(1): 64-67.
Shailaja Hittalmani, Shashidhar, H. E and
Shivashankar, G. 1990. Purple puttu a new
high yielding protein rice selection.Curr.
Res., 18: 110-111.
Sunder raj, N., Nagaraju, S., Venkararamu, M.N.
and Jagannath, M.K. 1972. Designs and
analysis of field Experiment, Univ. Agril.Sci.,
Hebbal, Bangalore.
Tan, Y.F., Sun, M., Xing, Y.Z., Hua, J.P., Sun, X.L.,
Zhang, Q.F and Corke, H. 2001. Mapping
quantitative trait loci for milling quality,
protein content and color characteristics of
rice using a recombinant inbred line
population derived from an elite rice hybrid.
Theor. Appl. Genet., 103: 1037–1045.
Vanaja, T. and Luckins, L.C. 2006. Variability in
grain quality attributes of high yielding rice
varieties (Oryza sativa L.) of diverse origin. J.
Trap. Agric., 44(1/2): 61-63.
Wang, L.Q., Zhong, M., Li, X.H., Yuan, D.J., Xu,
Y.B., Liu, H.F., He, Y.Q., Luo, L.H., Zhang,
Q.F. 2008. The QTL controlling amino acid
content in grains of rice (Oryza sativa) are
co-localized with the regions involved in the
amino acid metabolism pathway. Mol.
Breeding, 21:127–137.
Zeng, Y., Liu, J., Wang, L., Zhang, H., Pu, X., Du, J.
and Yang, S. 2006. Diversity of mineral
concentrations in cultivated ecotypes of
Yunnan rice. Acta Agronomica Sinica, 32(6):
867-872.
Zeng, Y., Shen, S., Wang, L., Liu, J., Pu, X. and Du,
J. 2005. Relationship between morphological
and quality traits and mineral element content
in Yunnan rice. Chinese J. Rice Sci., 19(2):
127-131.
Zhang, W., Bi, J., Chen, L., Zheng, L., Ji, S., Xia,
Y., Xie, K., Zhao, Z., Wang, Y., Liu, L.,
Jiang, L. and Wan, L. 2008. QTL mapping for
crude protein and protein fraction contents in
rice (Oryza sativa L.). J. Cereal Sci., 48: 539547.
How to cite this article:
Shashidhara, N., Hanamareddy Biradar and Shailaja Hittalmani. 2017. Qualitative and Quantitative
Genetic Variations in the F2 Inter Varietal Cross of Rice (Oryza sativa L.) under Aerobic Condition
and Parental Polymorphism Survey. Int.J.Curr.Microbiol.App.Sci. 6(4): 2215-2225.
doi: />
2225