Pathologic analysis of non-neoplastic parenchyma in renal cell carcinoma: A comprehensive observation in radical nephrectomy specimens
Bạn đang xem bản rút gọn của tài liệu. Xem và tải ngay bản đầy đủ của tài liệu tại đây (753.4 KB, 7 trang )
Wang et al. BMC Cancer (2017) 17:900
DOI 10.1186/s12885-017-3849-5
RESEARCH ARTICLE
Open Access
Pathologic analysis of non-neoplastic
parenchyma in renal cell carcinoma: a
comprehensive observation in radical
nephrectomy specimens
Xun Wang1, Qiang Liu2, Wen Kong1, Jiwei Huang1, Yonghui Chen1, Yiran Huang1 and Jin Zhang1*
Abstract
Background: This study provides a comprehensive examination of the histological features of non-neoplastic
parenchyma in renal cell carcinoma (RCC). We prospectively collected radical nephrectomy (RN) specimens, to
analyze the histological changes within peritumoral and distant parenchyma.
Methods: Data of patients who underwent RN and had no known history of diabetes, hypertension,
hyperlipidemia, or chronic kidney disease etc., were prospectively collected. Tumor pseudo-capsule (PC), and
parenchyma within 2 cm from tumor margin, were pathologically assessed. The parenchyma beyond PC or tumor
margin was divided into 20 subsections of 1 mm in width. Histological changes, including chronic inflammation,
glomerulosclerosis, arteriosclerosis and nephrosclerosis, were given scores of 0, 1, 2 or 3 for each subsection of each
specimen, according to their severity. The 20 subsections of each specimen were further divided into four groups
according to the distance from the tumor edge (group 1: 0–2 mm; group 2: 2–5 mm; group 3: 5–10 mm; group 4:
10–20 mm), to better compare the peritumoral parenchyma with the distant parenchyma.
Results: In total, 53 patients were involved in this study. All tumors were confirmed RCCs (clear cell vs. papillary vs.
chromophobe were 83% vs. 5.7% vs. 11.3%, respectively), with a mean size of 5.6 cm. Histological changes were
more severe in peritumoral parenchyma close to PC or tumor edge (0–5 mm), and less common within parenchyma
more distant from the tumor (5–20 mm) (p < 0.001). chronic inflammation and nephrosclerosis were the most common
changes especially in peritumoral parenchyma (0-2 mm). PC was present in 49 tumors (92.5%), and PC invasion occurred
in 5 cases (10.2%). Mean PC thickness was 0.7 mm. PCs were more likely to be present in clear cell RCC or papillary RCC
than in chromophobe RCC (100% vs. 100% vs. 33.3%, respectively; p < 0.001).
Conclusions: Most RCCs have a well-developed PC, especially clear cell RCC. Histological changes mainly occur in
peritumoral parenchyma, being rather uncommon in distant parenchyma. A compression band filled with severe
histological changes was typically observed in renal parenchyma close to the tumor. Its preservation while performing
an enucleation margin may not be entirely necessary.
Keywords: Renal cell carcinoma, Non-neoplastic parenchyma, Histological changes, Pseudo-capsule, Compressed band
* Correspondence:
1
Department of Urology Renji Hospital affiliated to Shanghai Jiaotong,
University School of Medicine, No.1630, Dongfang Road, Shanghai 200127,
China
Full list of author information is available at the end of the article
© The Author(s). 2017 Open Access This article is distributed under the terms of the Creative Commons Attribution 4.0
International License ( which permits unrestricted use, distribution, and
reproduction in any medium, provided you give appropriate credit to the original author(s) and the source, provide a link to
the Creative Commons license, and indicate if changes were made. The Creative Commons Public Domain Dedication waiver
( applies to the data made available in this article, unless otherwise stated.
Wang et al. BMC Cancer (2017) 17:900
Background
A limited number of studies have focused on the
comprehensive pathological analysis of non-neoplastic
parenchyma in renal cell carcinoma (RCC), which
includes the peritumoral parenchyma and the more
distant parenchyma from the tumor. Former research
[1–7] has only focused on peritumoral tissues, showing that various histological changes occur in the
non-neoplastic parenchyma in RCC, such as chronic
inflammation (CI), glomerulosclerosis (GS) or arteriosclerosis (AS). Recent reports [8–10] have begun to
analyze the areas of renal tissues located further from
the tumor, proving that the peritumoral tissue cannot
represent the condition of the entire non-neoplastic
parenchyma. However, most of these studies involved
partial nephrectomy (PN) specimens. As a result, the
pathological observations were limited to the tissue
very close to the lesion. To fully understand the
histological changes of the renal parenchyma in RCC,
peritumoral parenchyma and distant parenchyma, as
well as the pattern of tumor invasion within the renal
parenchyma, should be more thoroughly examined.
Our study exclusively enrolled radical nephrectomy
(RN) specimens to better assess the non-neoplastic parenchyma, including the tumor pseudo-capsule (PC),
peritumoral parenchyma and distant parenchyma.
Methods
This single-center prospective study was approved by
the institutional review board, and the requirement for
informed consent was waived. We prospectively enrolled
53 patients, who met the following eligibility criteria: patients with typical Enhanced Computed Tomography or
Magnetic Resonance Imaging images indicating a single
RCC lesion; patients undergoing RN at our institution
from August 2015 to May 2016; pathological confirmation of RCC in surgical specimens; patients without
medical conditions potentially affecting the renal parenchyma, including hypertension, hyperlipidemia, diabetes
mellitus or chronic kidney disease etc. Patients who did
not eventually undergo RN or who had pathological
diagnosis other than RCC were further excluded from
the study.
We prospectively recorded the basic information of the
patients, including age, gender, and surgical approach
(open, laparoscopic, robotic). The size of the primary
tumor, histologic subtype, Fuhrman grade, pathological
TNM stage and margin status were recorded on regular
pathological examination, including hematoxylin-eosin
and immunohistochemical stains. Tumor features were
evaluated according to the 2004 World Health
Organization (WHO) classification [11], the Fuhrman
grading system [12], and the 2010 American Joint Committee on Cancer TNM staging. [13]
Page 2 of 7
Apart from the regular pathological examination, each
specimen was further sampled to include the PC of the
tumor (if present), as well as renal parenchyma of at
least 2 cm in width from around the PC or tumor margin (if PC was absent). Three to four hematoxylin-eosin
slides were made per case, in addition to the standard
sections that were used for clinical assessment.
All slides were reviewed by two urological pathologists
(QL and JX) blinded to the patients’ clinical parameters
and tumor pathological information, including age,
gender, surgical approach, tumor size and subtype. For
each specimen, information on PC, including the presence
of PC, PC thickness, as well as the presence of tumor invasion within PC, were recorded. The 2-cm-wide renal
parenchyma specimens from beyond the PC or tumor
margin were further divided into 20 subsections of 1 mm
in width. The histological changes of parenchyma, including CI, GS, AS and NS, were graded in each subsection of
each specimen, according to the criteria shown in Table 1.
CI, GS, AS and NS were scored on the histological scale
of severity (Additional file 1 Figure S1-S4). These criteria
have previously been used by other authors for similar
purposes [8, 14]. A minimum of three random microscopic fields were required to evaluate the histological
changes in each subsection. The highest grade observed in
the three fields was recorded. A dividing optical microscope was used for the measurement of length.
In order to better compare the peritumoral parenchyma with the distant parenchyma, we grouped the 20
subsections into four groups of variable widths, according to their distance from the PC or tumor edge, as follows: group 1: 0–2 mm; group 2: 2–5 mm; group 3: 5–
10 mm and group 4: 10–20 mm. Finding the histological
change mentioned before in any subsection of the group
was defined as positive occurrence. The frequency of
each change among the four groups was recorded. The
parenchyma score for each histological change was calculated by averaging all subsection scores in the four
groups, to represent the overall severity of the lesion.
One-way ANOVA was used to compare the means of
histologic grade and histologic score, among renal parenchyma with different distances from PC or tumor
margin. Pearson’s chi-square or Fisher’s exact test were
used to compare the occurrence rate of PC in tumors
with various characteristics (histologic subtype, Fuhrman
grade, pT classification). Student’s t test or one-way
ANOVA were used to compare the thickness of PC. All
tests were two-sided, and p-value <0.05 was considered
statistically significant. All statistical analyses were performed using SPSS, version 21.0 (IBM, Armonk, NY).
Results
Following an initial assessment, 55 patients were enrolled in our study. All patients underwent RN and had
Wang et al. BMC Cancer (2017) 17:900
Page 3 of 7
Table 1 Grading criteria for each histologic change
Grade 0
Grade 1
Grade 2
CI
no
<3 lymphoid aggregates
> = 3 lymphoid aggregates
Grade 3
diffuse inflammatory cell infiltrate
GS
no
<25% glomeruli sclerosed
25–50%
>50%
AS
no
both vessels wall thickening and luminal narrowing
were slight
partial vessels luminal occlusion
<= 50%
vessels luminal occlusion >50%
NS
no
thickened tubular basement membranes and hyaline
sclerosis surrounding the tubules when examined at
20X
the grade1 changes along with
interstitial fibrosis could be
observed at 4X
diffuse tubular atrophy and drop-out
with extensive hyaline sclerosis
observed at 4X
CI, chronic inflammation, was graded by using random objective 40X microscopic field; GS, glomerulosclerosis, was graded by using 10X objective field; AS,
arteriosclerosis, was graded by using 40X field; NS, nephrosclerosis;
no known medical history of hypertension, diabetes
mellitus or chronic kidney disease. Two patients were
diagnosed as upper tract urothelial carcinoma in postoperative pathological examination and were thus excluded
from our study. The remaining 53 patients were confirmed to be RCCs (prevalence of clear cell vs. papillary
vs. chromophobe was 83% vs. 5.7% vs. 11.3%, respectively). Median tumor size was 5.6 cm (range: 2.0–
12.3 cm) and all patients had negative surgical margins.
A total of 162 slides were prepared from 53 surgical
specimens. The baseline clinical and pathological characteristics of the 53 patients are shown in Table 2.
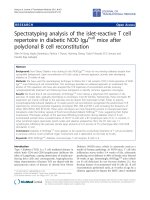
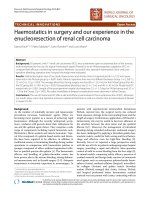
The degree and occurrence rate of all histological
changes (CI, GS, AS and NS) decreased with increasing
distance from tumor edge or PC (Fig. 1). The nearest
group (0–2 mm) had the most severe histological
changes. CI and NS were the most common changes in
non-neoplastic renal parenchyma, especially in peritumoral parenchyma close to PC or tumor edge.
The 20 subsections were further divided into four
groups, as previously defined. Among the four groups,
the frequency and severity of histological changes
decreased as the distance from PC or tumor edge increased (P < 0.001, Table 3). All four histological changes
were statistically more common in groups 1 and 2 than
in groups 3 and 4 (P < 0.001). However, no significant
difference was observed between group 3 and group 4.
PC was present in 49 tumors (92.5%) and its median
thickness was 0.7 mm (range: 0.1–4.5 mm). Tumor invasion was observed in 5 PCs: one patient with papillary
RCC had tumor invasion across the full thickness of PC,
but tumor was not found beyond PC, and the other 4
cases had partial invasion of PC. PCs were more prevalent
in clear cell RCC or papillary RCC than in chromophobe
RCC (100% vs. 100% vs. 33.3%, respectively p < 0.001), and
in smaller tumors (≤ 7 cm) than in bigger tumors (>
7 cm) (100% vs. 77.8%, p = 0.004). PC invasion was
more common in tumors with high nuclear grade
(Fuhrman 3–4) (p = 0.023), whereas invasion did not
correlate with pT classification or histological subtype.
PC thickness did not correlate with any tumor pathological characteristics (Table 4).
Discussion
In recent years, emerging data proved that certain
histological changes can be identified in the peritumoral parenchyma of RCC [1–7]. In 2013, GarciaRoig et al. [4] conducted an observational study on
45 patients who underwent PN surgery and who had
no known chronic underlying disease. AS was
observed in the peritumoral parenchyma of nine
Table 2 Baseline clinical and pathological characteristics of
entire 53 patients
Patient Demographics:
All cases, n = 53
Mean age (yrs) (SD)
62 (9.8)
No. male gender (%)
30(56.6)
No. right kidney (%)
25(47.2)
Surgical method (%)
Open
8(15.1)
Laparoscopic
44(83.0)
Robotic
1(1.9)
Tumor Characteristics:
Mean Size(cm)(SD)
5.6(2.3)
Histologic Subtype (%)
Clear cell
44(83.0)
Papillary
3(5.7)
Chromophobe
6(11.3)
Fuhrman grade (%)
1
6(11.3)
2
34(64.2)
3
11(20.8)
4
2(3.8)
pT classification (%)
1a
19(35.9)
1b
16(30.2)
2a
16(30.2)
2b
1(1.9)
3a
1(1.9)
Negative Margin (%)
53(100)
Wang et al. BMC Cancer (2017) 17:900
Page 4 of 7
Fig. 1 The occurrence rate and histologic grade score correlate with
the distance from the tumor edge. a, occurrence rate of CI, GS, AS
and NS; b, histologic grade score of CI, GS, AS and NS
patients (20.0%), whereas NS was found in eight
patients (17.8%). Gorin et al. [5] observed AS in the
peritumoral parenchyma of 29 out of 114 (25.4%)
patients with RCC, following PN. These studies suggested that lesions in the peritumoral parenchyma
were indicative of subclinical kidney disease and advocated that patients with RCC could potentially
benefit from intensive lifestyle modification and
medical therapy with lipid-lowering medications [5].
However, more recent studies [8–10] have analyzed
broader areas of non-neoplastic renal tissue. Azhar et
al. [8]. histologically assessed the renal parenchyma in
the 0–5 mm range from the tumor edge, and concluded that most histological changes occur in the
parenchyma immediately adjacent to the tumor.
Kheemes et al. [9] recorded the peritumoral glomerular viability in successive 0.25 cm increments (range 0
to 1 cm), and the mean viable glomeruli positively
correlated with the distance from the tumor edge.
Furthermore, the authors suggested that glomerular
viability near the tumor did not correlate with the
preoperative estimated glomerular filtration rate. Our
findings agree with these reports: the peritumoral parenchyma is different from the tissue further from the
tumor, and the adjacent parenchyma may not reflect
the renal function. The data in our study showed that
the degree and occurrence rate of histological changes
in the parenchyma decreased with increasing distance
from the tumor margin or PC.
To comprehensively examine the global nonneoplastic parenchyma, we extended the observation
field and utilized RN specimens to compare the peritumoral parenchyma with tissue further from the
tumor. In our study, the mean size of the tumors
was 5.6 cm (range: 2.0–12.3 cm), and 35% of all
tumors were staged T1a. But most of these small tumors were completely endophytic and very close to
the renal pedicle. The final surgical decision was
Table 3 Histologic assessment of non-neoplastic parenchyma in four groups divided according to the distance from the PC or
tumor margin
GROUP 1 (0-2 mm) ***
GROUP 2 (2-5 mm)
GROUP 3 (5-10 mm)
GROUP 4 (10-20 mm)
No. (%)*
Grade**
No. (%)
Grade
No. (%)
Grade
No. (%)
Grade
P value
CI
53(100)
2.1 (0.6)
29(54.7)
0.72(0.7)
14 (26.4)
0.2(0.2)
8 (15.1)
0.1 (0.13)
<0.001
GS
28(52.8)
0.7 (0.9)
11(20.8)
0.1(0.3)
7 (13.2)
0.09(0.2)
4 (7.5)
0.1(0.1)
<0.001
AS
23(43.4)
0.5 (0.8)
8(15.1)
0.1 (0.3)
5 (9.4)
0.1(0.1)
3 (5.7)
0.1 (0.7)
<0.001
NS
52(98.1)
1.90(0.8)
30(56.6)
0.4 (0.4)
3 (5.7)
0.1(1.0)
2 (3.8)
0.1(0.2)
<0.001
For all 53 specimens, we grouped the 20 subsections (1 mm wide) into four intervals of variable widths according to their distance from the PC or tumor edge.
Finding the histological change in any subsection of the group was defined as positive occurrence. The frequency of each change among the four groups was
recorded. The grade score of each histologic change was calculated by averaging all subsection scores in the four groups to represent the overall severity
of lesion
*Number and precentage of specimens that presents the corresponding histologic change;
**Average grade score and standard deviation of all 53 specimens;
***The distant from pseudo-capsule or tumor margin
Wang et al. BMC Cancer (2017) 17:900
Page 5 of 7
Table 4 Characteristics of the tumor pseudo-capsule (PC) in
RCC
N
PC
present(%)
PC
invasion(%)
Mean Thickness
(mm) (SD)
Clear cell
44
44(100)
4(9.1)
0.8(0.7)
Papillary
3
3(100)
1(33.3)
0.6(0.3)
Chromophobe
6
2(33.3)
0(0)
0.7(0.2)
1–2
42
38(90.5)
2(5.3)
0.7(0.3)
3–4
11
11(100)
3(27.3)
0.9(1.2)
pT1
35
35(100)
3(8.6)
0.7(0.3)
1a
19
19(100)
3(15.8)
1b
16
16(100)
0(0)
≥ pT2
18
14(77.8)
2(11.1)
2a
16
12(75)
1(8.3)
2b
1
1(100)
0(0)
3a
1
1(100)
1(100)
Overall
53
49(92.5)
5(10.2)
Histologic Subtype
Fuhrman grade
pT classification
1.0(1.1)
0.7(0.6)
made by the surgeons (based on tumor complexity
or patients’ will). Because 65% tumors were bigger
than 4 cm, and due to the dominant endophytic features of most tumors, many cases could not generate
renal tissue beyond 2 cm, despite being RN specimens. Therefore, for consistency, we selected 2 cm
peritumoral parenchyma for analysis, in all cases.
Obtained results indicated that the 10 mm to
20 mm area had fewer histological changes and
seemed to be healthy renal tissue. As the severity of
all histological changes decreased with increasing
distance from tumor edge or PC, we suggest that
this range (1–2 cm) can adequately represent the
distant parenchyma.
We found that the peritumoral parenchyma (1–2 mm)
was affected by severe inflammation, GS, diffuse tubular
atrophy and interstitial fibrosis. These histological
changes were far less common in the distant parenchyma (6–20 mm). This may result from the tumor
growth and its long-term compression on the peritumoral parenchyma [8]. The renal parenchyma around
the tumor was under sustained compression, leading to
tiny arterial wall thickening, luminal narrowing and even
occlusion. Long-term ischemia and inflammatory cell infiltration within the peritumoral parenchyma result in
the appearance of severe histological changes. Moreover,
considering the extremely complex mechanism of tumor
biology, it remains to be elucidated whether the paracrine effect of tumor cells has a role in this process.
We artificially divided the non-neoplastic parenchyma into 4 groups, according to the distance from
the tumor. As a result, a typical narrow area within
the peritumoral tissues, filled with high-grade histological changes, was observed in all the specimens,
and was named compression band (CB) (Additional
file 1: Figure S5). However, no tumor invasion was
observed in the CB. As the CB contains few functional glomeruli, preserving all parenchyma adjacent
to the renal tumor when deciding the enucleation
margin may be not necessary [15]. Azhar and
Kheemes’ data [8, 9] also support our hypothesis.
Although, traditionally, preserving as much renal
parenchyma as feasible while ensuring a negative
margin in partial nephrectomy, is a core aim of the
surgeons [16–18].
Tumor PC, as a rim of hyperplastic connective
tissue, can be found immediately adjacent to the edge
of the tumor [19]. PCs are not merely a protection
against tumor invasion, but also offer a favorable surgical division in enucleation. Several studies reported
on the characteristics of PC [8, 19–21]. Azhar et al.
[8] retrospectively observed 124 renal tumors, uncovering PCs in 96% of the total number. Mean PC
thickness was 0.7 mm and PC invasion was found in
29% of the tumors. Our data are mainly in agreement
with Azhar’s study, though PC invasion only occurred
in 10.2% of cases in our study. This result may be
due to different tumor characteristics and sampling
approaches: all specimens were obtained via RN and
mean size was 5.6 cm in our study; while in Azhar’s
study, 10% of tumors were benign, 81% were PN
specimens and mean size of tumors was 3.9 cm.
Apart from the differences amongst the tumors per
se, the chosen surgical procedure may also play an
important role in those variant results. PN is usually
performed along the margins of PC, which may exert
destructive and squeezing effects on PCs, because of
the intraoperative manipulation. In contrast, RN generally preserves the integrated anatomical structures
of the whole specimen. Lastly, our data, as well as
that of other studies [8, 20], suggested that tumor PC
was more likely presence in clear cell RCCs.
There are several limitations to our study. First, this
is a single-institution study, with insufficient sample
size. Second, limited cases of papillary or chromophobe subtypes were enrolled in this study, which
makes it difficult to draw a definitive conclusion in
these subtypes. As the study is an observational
research, the variables of renal function were not
considered. We will continue the follow-up of these
patients in a further study. Yet, we believe these data
give a comprehensive description of histological
changes in non-neoplastic parenchyma in RCC.
Wang et al. BMC Cancer (2017) 17:900
Conclusions
In agreement with prior reports, our findings suggest
that most RCCs have a well-developed pseudocapsule, especially the clear cell RCC. Histological
changes are more common in the peritumoral parenchyma (1–2 mm), whereas the distant parenchyma
(10–20 mm) is approaches normal histology. A band
of compression with abundant histological changes
was generally observed in parenchyma adjacent to PC
or tumor margin. Due to few functional glomeruli being present in the parenchyma within the CB, its
preservation while performing an enucleation margin
may not be entirely necessary.
Additional file
Additional file 1: Figure S1. (a-d): Chronic inflammation (CI) in nonneoplastic parenchyma by using random objective microscopic fields: A -(40x),
grade 0; B- (40x), grade 1; C- (40x), grade 2; D (40x), grade 3.Figure S2 (a-d):
Glomerulosclerosis (GS) in non-neoplastic parenchyma: A -(40x), a single GS
change; B- (10x), grade 1; C- (10x), grade 2; D -(10x), grade 3. Figure S3 (a-d):
Arteriosclerosis (AS) in non-neoplastic parenchyma: A- (40x), grade 0; B -(40x),
grade 1; C- (40x), grade 2; D- (20x), grade 3. Figure S4 (a-d): Nephrosclerosis(AS) in non-neoplastic parenchyma. A- (20x), grade 0; B- (20x), grade 1; C- (4x),
grade 2; D- (4x), grade 3. Figure S5(AB): peri-tumoral parenchyma (1-5 mm)
consist of tumor, pseudo-capsule(PC), compressed band(CB) and normal
parenchyma . (DOCX 4468 kb)
Abbreviations
AS: arteriosclerosis; CB: compressed band; CI: chronic inflammation;
GS: glomerulosclerosis; NS: nephrosclerosis; PC: pseudo-capsule; PN: partial
nephrectomy; RCC: renal cell carcinoma; RN: radical nephrectomy
Acknowledgements
We gratefully acknowledge Dr. Jun Xia making great contributions to the
pathological examination in this study.
Consent publication
Not applicable
Funding
This work was supported by Award Number 81472378 and 81,672,513 from
the National Natural Science Foundation of China, by Award Number
2013SY024 from Shanghai Health Bureau.
Availability of data and materials
The datasets used and analysed during the current study available from the
corresponding author on reasonable request.
Authors’ contributions
XW analyzed and interpreted the patient data and was a major contributor
in writing the manuscript. QL performed the histological examination of the
surgical specimens. WK analyzed the patient data. JH, YC, YH as the
operating surgeons collected the specimens. JZ as one of the operating
surgeons designed this study. All authors read and approved the final
manuscript.
Ethics approval and consent to participate
Our study was approved by the institutional review board of Renji Hospital
affiliated to Shanghai Jiaotong University School of Medicine, and the
requirement for informed consent was waived.
Competing interests
The authors declare that they have no competing interests.
Page 6 of 7
Publisher’s Note
Springer Nature remains neutral with regard to jurisdictional claims in
published maps and institutional affiliations.
Author details
1
Department of Urology Renji Hospital affiliated to Shanghai Jiaotong,
University School of Medicine, No.1630, Dongfang Road, Shanghai 200127,
China. 2Department of Pathology Renji Hospital affiliated to Shanghai
Jiaotong, University School of Medicine, No.1630, Dongfang Road, Shanghai
200127, China.
Received: 6 January 2017 Accepted: 27 November 2017
References
1. Brandina R, Moreira Leite KR, Gregorio EP, Fernandes KB, Srougi M, et al.
Histologic abnormalities in non-neoplastic renal parenchyma and the
risk of chronic kidney disease following radical nephrectomy. Urology.
2017;100:158–62.
2. Henriksen KJ, Meehan SM, Chang A. Nonneoplastic kidney diseases in adult
tumor nephrectomy and Nephroureterectomy specimens: common,
harmful, yet underappreciated. Arch Pathol Lab Med. 2009;133:1012–225.
3. Sarsik B, Simsir A, Yilmaz M, Yörükoglu K, Sen S. Spectrum of nontumoral
renal pathologies in tumor nephrectomies: nontumoral renal parenchyma
changes. Ann Diagn Pathol. 2013;17:176–82.
4. Garcia-Roig M, Gorin MA, Parra-Herran C, Garcia-Buitrago M, Kava BR, Jorda
M, et al. Pathologic evaluation of non-neoplastic renal parenchyma in
partial nephrectomy specimens. World J Urol. 2013;31:835–9.
5. Gorin MA, Garcia-Roig M, Garcia-Buitrago M, Parra-Herran C, Jorda M,
Ciancio G, et al. Atherosclerosis within the non-neoplastic margin of partial
nephrectomy specimens: implications for medical management. World J
Urol. 2013;31:1531–4.
6. Minervini A, Rosaria Raspollini M, Tuccio A, Di Cristofano C, Siena G, Salvi M,
et al. Pathological characteristics and prognostic effect of peritumoral
capsule penetration in renal cell carcinoma after tumor enucleation. Urol
Oncol. 2014;32:50.e15–22.
7. Bijol V, Batal I. Non-neoplastic pathology in tumor nephrectomy specimens.
Surg Pathol Clin. 2014;7(3):291–305.
8. Azhar RA, de Castro Abreu AL, Broxham E, Sherrod A, Ma Y, Cai J, et al.
Histological analysis of the kidney tumor-parenchyma interface. J Urol.
2015;193:415–22.
9. Khemees TA, Lam ET, Joehlin-Price AS, Mortazavi A, Phillips GS, Shabsigh A,
et al. Does the renal parenchyma adjacent to the tumor contribute to
kidney function? A critical analysis of glomerular viability in partial
nephrectomy specimens. Urology. 2016;87:114–9.
10. Brandina R, Moreira Leite KR, Gregorio EP, Fernandes KB, Srougi M.
Histologic abnormalities in non-neoplastic renal parenchyma and the
risk of chronic kidney disease following radical nephrectomy. Urology.
2017;100:158–62.
11. Lopez-Beltran A, Scarpelli M, Montironi R, Kirkali Z. 2004 WHO classification
of the renal tumors of the adults. Eur Urol. 2006;49:798–805.
12. Fuhrman SA, Lasky LC, Limas C. Prognostic significance of morphologic
parameters in renal cell carcinoma. Am J Surg Pathol. 1982;6:655–63.
13. Edge SB, Byrd DR, Compton CC, Fritz AG, Greene FL, Trotti A, editors. AJCC
cancer staging manual. 7th ed. Chicago: Springer-Verlag; 2010.
14. Kumar V, Abbas AK, Fausto N. Robbins and Cotran pathologic basis of
disease. 7th ed. Philadelphia, PA: Elsevier Saunders; 2005.
15. Campbell SC, Novick AC, Belldegrun A, Blute ML, Chow GK, Derweesh IH, et
al. Guideline for management of the clinical T1 renal mass. J Urol. 2009;182:
1271–9.
16. Simmons MN, Fergany AF, Campbell SC. Effect of parenchymal volume
preservation on kidney function after partial nephrectomy. J Urol. 2011;
186:405–10.
17. Kotamarti S, Rothberg MB, Danzig MR, Levinson J, Saad S, Korets R, et al.
Increasing volume of non-neoplastic parenchyma in partial nephrectomy
specimens is associated with chronic kidney disease upstaging. Clin
Genitourin Cancer. 2015;13:239–43.
18. Sutherland SE, Resnick MI, Maclennan GT, Goldman HB. Does the size of the
surgical margin in partial nephrectomy for renal cell cancer really matter? J
Urol. 2002;167:61–4.
Wang et al. BMC Cancer (2017) 17:900
Page 7 of 7
19. Süer E, Ergün G, Baltaci S, Bedük Y. Does renal capsular invasion have any
prognostic value in localized renal cell carcinoma? J Urol. 2008;180:68–71.
20. Minervini A, di Cristofano C, Lapini A, Marchi M, Lanzi F, Giubilei G, et al.
Histopathologic analysis of peritumoral pseudocapsule and surgical
margin status after tumor enucleation for renal cell carcinoma. Eur Urol.
2009;55:1410–8.
21. Cho HJ, Kim SJ, Ha US, Hong SH, Kim JC, Choi YJ, et al. Prognostic value of
capsular invasion for localized clear- cell renal cell carcinoma. Eur Urol. 2009;
56:1006–12.
Submit your next manuscript to BioMed Central
and we will help you at every step:
• We accept pre-submission inquiries
• Our selector tool helps you to find the most relevant journal
• We provide round the clock customer support
• Convenient online submission
• Thorough peer review
• Inclusion in PubMed and all major indexing services
• Maximum visibility for your research
Submit your manuscript at
www.biomedcentral.com/submit