Gene-expression signature regulated by the KEAP1-NRF2-CUL3 axis is associated with a poor prognosis in head and neck squamous cell cancer
Bạn đang xem bản rút gọn của tài liệu. Xem và tải ngay bản đầy đủ của tài liệu tại đây (1.44 MB, 11 trang )
Namani et al. BMC Cancer (2018) 18:46
DOI 10.1186/s12885-017-3907-z
RESEARCH ARTICLE
Open Access
Gene-expression signature regulated by the
KEAP1-NRF2-CUL3 axis is associated with a
poor prognosis in head and neck
squamous cell cancer
Akhileshwar Namani1†, Md. Matiur Rahaman2†, Ming Chen2* and Xiuwen Tang1*
Abstract
Background: NRF2 is the key regulator of oxidative stress in normal cells and aberrant expression of the NRF2 pathway
due to genetic alterations in the KEAP1 (Kelch-like ECH-associated protein 1)-NRF2 (nuclear factor erythroid 2 like 2)-CUL3
(cullin 3) axis leads to tumorigenesis and drug resistance in many cancers including head and neck squamous cell cancer
(HNSCC). The main goal of this study was to identify specific genes regulated by the KEAP1-NRF2-CUL3 axis in HNSCC
patients, to assess the prognostic value of this gene signature in different cohorts, and to reveal potential biomarkers.
Methods: RNA-Seq V2 level 3 data from 279 tumor samples along with 37 adjacent normal samples from patients
enrolled in the The Cancer Genome Atlas (TCGA)-HNSCC study were used to identify upregulated genes using two
methods (altered KEAP1-NRF2-CUL3 versus normal, and altered KEAP1-NRF2-CUL3 versus wild-type). We then used a new
approach to identify the combined gene signature by integrating both datasets and subsequently tested this signature in
4 independent HNSCC datasets to assess its prognostic value. In addition, functional annotation using the DAVID v6.8
database and protein-protein interaction (PPI) analysis using the STRING v10 database were performed on the signature.
Results: A signature composed of a subset of 17 genes regulated by the KEAP1-NRF2-CUL3 axis was identified by
overlapping both the upregulated genes of altered versus normal (251 genes) and altered versus wild-type (25 genes)
datasets. We showed that increased expression was significantly associated with poor survival in 4 independent HNSCC
datasets, including the TCGA-HNSCC dataset. Furthermore, Gene Ontology, Kyoto Encyclopedia of Genes and Genomes,
and PPI analysis revealed that most of the genes in this signature are associated with drug metabolism and glutathione
metabolic pathways.
Conclusions: Altogether, our study emphasizes the discovery of a gene signature regulated by the KEAP1-NRF2-CUL3
axis which is strongly associated with tumorigenesis and drug resistance in HNSCC. This 17-gene signature provides
potential biomarkers and therapeutic targets for HNSCC cases in which the NRF2 pathway is activated.
Keywords: Head and neck squamous cell cancer, KEAP1-NRF2-CUL3 mutations, Overall survival, Gene-expression signature
* Correspondence: ;
†
Equal contributors
2
Department of Bioinformatics, College of Life Sciences, Zhejiang University,
Hangzhou 310058, People’s Republic of China
1
Department of Biochemistry, University School of Medicine, Hangzhou
310058, People’s Republic of China
© The Author(s). 2018 Open Access This article is distributed under the terms of the Creative Commons Attribution 4.0
International License ( which permits unrestricted use, distribution, and
reproduction in any medium, provided you give appropriate credit to the original author(s) and the source, provide a link to
the Creative Commons license, and indicate if changes were made. The Creative Commons Public Domain Dedication waiver
( applies to the data made available in this article, unless otherwise stated.
Namani et al. BMC Cancer (2018) 18:46
Background
Head and neck squamous cell cancer (HNSCC) is the
sixth most prevalent form of cancer. It has a high incidence worldwide, and 90% of cases are histologically
identified as squamous cell carcinomas [1, 2]. HNSCC is
a broad category of cancers that predominantly arise in
the oral cavity, oropharynx, hypopharynx, larynx, soft
tissues of the neck, salivary glands, skin, and mucosal
membranes [3, 4]. The most common causes are the
consumption of tobacco and alcohol, and human papillomavirus infection [5].
NRF2 is the master transcription factor that regulates
the genes involved in antioxidant and detoxification
pathways. Under normal conditions, Kelch like-ECHassociated protein 1 (KEAP1) negatively regulates the
NRF2 expression by cullin-3 (CUL3)-mediated ubiquitination and proteasomal degradation [6]. Under oxidative
stress, NRF2 is liberated from the tight control of the
KEAP1/CUL3 complex, is relocated to the nucleus
where it forms heterodimers with small Maf proteins,
and transactivates its downstream genes through binding
with antioxidant responsive elements (AREs) [7]. Genetic alterations such as mutations (gain of function mutations of NRF2 and loss of function mutations in
KEAP1 and CUL3), and copy-number changes (amplification of NRF2 and deletion of KEAP1 and CUL3) leads
to oncogenesis and drug- and radio-resistance in different types of cancers including HNSCC [8, 9]. Due to the
dysregulated NRF2 activity in different cancers, it is
emerging as a promising therapeutic target in drug discovery [10, 11].
Stacy et al. [12] first reported the increased expression
of NRF2 in HNSCC patients and suggested that NRF2
might be a biomarker. Another report from Huang et al.
[13] found the increased expression of KEAP1 and
NRF2 in oral squamous cell carcinoma. However, in
their report, overall survival analysis of patients with increased expression of KEAP1 and NRF2 did not reveal
significant differences. Recently, The Cancer Genome
Atlas (TCGA) has provided a wealth of information
about KEAP1-NRF2-CUL3 changes in HNSCC patients
[14]. Therefore, examining the molecular mechanisms
involved in these alterations by using publicly available
data may contribute to the development and design of
therapeutic targets for personalized/precision medicine
in subsets of patients. Several emerging studies including
our recent study on lung cancer have identified an
NRF2-regulated gene signature and potential biomarkers
for patient survival and NRF2 activity [15–18].
Given the importance of KEAP1-NRF2-CUL3 changes in
HNSCC, it is important to identify the biomarkers that determine patient survival and NRF2 activity. A recent analysis on TCGA-HNSCC data revealed that patients with
disruption of the KEAP1/CUL3/RBX1 E3-ubiquitin ligase
Page 2 of 11
complex have significantly poorer survival than nondisrupted counterparts [19]. However, their study specifically focused on the data from patients with a disrupted
KEAP1/CUL3/RBX1 complex, but not the data from samples in which NRF2 was altered. In addition they utilized
302 patients data which contains provisional information in
their study and overall survival analysis was limited to one
cohort. In our study, we restricted the patients samples
number (n = 279) which were reported in the TCGA publication [14] and excluded provisional data. Moreover, we
analyzed the TCGA-HNSCC [14] RNA-Seq data and identified a 17-gene signature that was highly expressed in samples with altered KEAP1-NRF2-CUL3 compared with both
normal and wild-type counterparts. Further, we showed
that genomic changes in KEAP1-NRF2-CUL3 were key effectors of the overexpression of genes dependent on the
NRF2 pathway. Furthermore, we identified known NRF2regulated genes involved in drug and glutathione metabolism, along with 4 putative KEAP1-NRF2-CUL3-regulated
genes. Finally, we found that higher expression of this gene
signature was significantly associated with poorer survival
in 4 HNSCC cohorts.
Methods
Samples and transcriptomic profile datasets
We obtained RNA-Seq gene expression version2 (RNASeqV2) level 3 data (Illumina Hiseq platform) from
HNSCC patients along with adjacent normal tissues from
the Broad GDAC Firehose website ( We carried out the analysis of RNA-Seq data of
279 tumor samples and 37 adjacent normal samples listed
in the TCGA network study [14]. All the alteration data for
KEAP1-NRF2-CUL3 (KEAP1-mutation/deletion, NRF2mutation/amplification, and CUL3-muatation/deletion)
used in the present study was obtained from cBioportal [20,
21]. In addition to the TCGA-HNSCC RNA-Seq data, three
independent HNSCC cohorts microarray data– Saintigny
et al. (GSE26549) [22], Jung et al. (E-MTAB-1328) [23], and
Cohen et al. (GSE10300) [24] – were also used for overall
survival analysis. Our study meets the publication guidelines listed by the TCGA network.
RNA-Seq data analysis
The conventional method of differentially-expressed
gene (DEG) analysis involves the comparison of tumor
transcriptomic data with normal cell data. However, in
recent studies, due to the availability of large sets of
tumor samples and fewer adjacent normal datasets, researchers have performed DEG analysis of TCGA data
by applying a new method in which the DEGs are identified by comparing altered or mutated tumor samples
(including a particular gene/set of genes) with wild-type
tumors (caused by factors other than alterations or mutations) [15, 25, 26].
Namani et al. BMC Cancer (2018) 18:46
Despite the fact that these two methods have been
used separately for DEG analysis, in this study, we applied a combinatorial approach to obtain DEGs from
HNSCC patients by using both conventional and new
methods. We then integrated the resulting upregulated
genes from both datasets to obtain overlapping genes.
This approach led to the robust identification of more
markedly upregulated genes specific to the samples with
altered KEAP1-NRF2-CUL3 than in both normal and
wild-type samples. Moreover, our method not only identified specific genes targeted by the KEAP1-NRF2-CUL3
axis but also minimized false-positive results.
We segregated the 279 HNSCC tumor samples into two
groups: 54 altered KEAP1-NRF2-CUL3 samples (referred
to below as ‘altered’) and 225 wild-type samples. Before performing transcriptomic data analysis, the TCGA barcodes
of patient data were cross-checked to avoid technical errors. First, we carried out DEG analysis in the 54 altered
versus 37 normal samples followed by 54 altered versus 225
wild-type samples using the R/Bioconductor package [27] –
edgeR [28]. To crosscheck how our combinatorial approach
effectively found specific genes targeted by the KEAP1NRF2-CUL3 axis, we also subjected the 225 wild-type and
37 normal samples to DEG analysis. Briefly, the raw counts
of RNA-SeqV2 level 3 data were filtered by removing the
genes containing zero values. We then considered the genes
with >100 counts per million in at least two samples for
normalization using the trimmed mean of M-values
method, followed by the estimation of dispersions using
generalized linear models. Up- and down-regulated genes
for altered versus normal and altered versus wild-type samples were identified separately by applying a BenjaminiHochberg (BH) false-discovery rate (FDR) p < 0.01 with a
log-fold change (logFC) > 1.5 and <−1.5. Finally, we used
the overlapping upregulated genes obtained from both
datasets using ‘Venny 2.1’ ( />tools/venny/index.html) for further analysis. Hierarchical
clustering of overlapping upregulated genes was performed
using the ‘Heatmapper’ web tool [29]. Box plots of the overlapping upregulated genes that represent the log (counts
per million) expression values were generated using Rpackage ‘ggplot2’ [30]. The overall workflow of the study
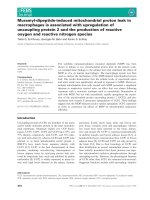
design is presented in Fig. 1.
Functional annotation and protein-protein interaction
(PPI) network analysis
Functional annotation (Gene Ontology (GO) and Kyoto
Encyclopedia of Genes and Genomes (KEGG) analysis)
of overlapping upregulated genes was performed using
the updated version of the Database for Annotation,
Visualization and Integrated Discovery (DAVID) v6.8
web tool [31]. PPI network analysis was performed using
the STRING v10 database [32].
Page 3 of 11
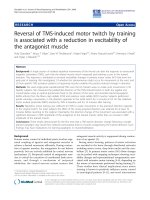
Fig. 1 Overview of transcriptomic analysis of TCGA-HNSCC RNA-Seq
data. DEG, differentially-expressed genes
Identification of NRF2-binding sites by in silico analysis
To identify the NRF2 binding sites within the promoter
regions of the putative KEAP1-NRF2-CUL3-regulated
genes, we used the transcription factor-binding site finding tool LASAGNA-Search 2.0 [33] with cutoff p-values ≤
0.001. The search was limited to the -5 kb upstream promoter region relative to the transcription start site.
Survival analysis
Cox proportional hazard regression was performed using
the online survival analysis and biomarker validation tool
SurvExpress [34]. We considered the data from a total of
502 patients in 4 independent HNSCC cohorts available
in the SurvExpress database: the TCGA-HNSCC cohort
(n = 283) with other three HNSCC cohorts – Saintigny et
al. (GSE26549) (n = 86) [22], Jung et al. (E-MTAB-1328)
(n = 89) [23], and Cohen et al. (GSE10300) (n = 44) [24] –
for survival analysis. In the case of microarray-based survival data, we considered the average values for genes
whose expression was associated with multiple probe sets
such as duplicates or alternatives. SurvExpress separated
the patient samples into two groups, high - and low-risk,
based on average expression of the 17 genes signature
values, and performed statistical analysis of survival probability of the two groups using the log-rank method. SurvExpress used the log-rank test to generate Kaplan-Meir
plots based on the ‘Survival’ package of the R platform,
which is integrated into its website. Log-rank test p-values
< 0.05 were considered to be statistically significant.
Results
Overview of genetic alterations in the KEAP1-NRF2-CUL3axis
In HNSCC, changes in the KEAP1-NRF2-CUL3 axis occurred in ~20% of patients; of these, KEAP1 alterations
accounted for 4.6%, NRF2 for 11.8%, and CUL3 for
Namani et al. BMC Cancer (2018) 18:46
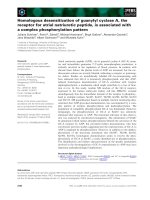
5.7%. However, few samples overlapped (Fig. 2a). In
order to better understand the KEAP1-NRF2-CUL3 mutational landscape in HNSCC, we used the cBioportal
cancer genomics website [20, 21] to examine the types
of mutation and their positions in the domain structure
of proteins. All 13 KEAP1 and 18 NRF2 mutations were
missense mutations, while 70% of the CUL3 mutations
(7/10) were missense, 20% (2/10) were nonsense, and
10% (1/10) were splice mutations (Fig. 2b).
KEAP1 consists of 605 amino-acids with 3 domains in
which 6 mutations were reported in the BTB (broad-complex, tramtrack, and bric-a-brac) domain, 1 in the IVR
Page 4 of 11
(intervening region), 1 in the C-terminal, 1 in the Nterminal region, and another 4 were in the Kelch domain,
which is essential for the binding of NRF2. In the case of
NRF2 structure, the majority of mutations (16) occurred
in the crucial KEAP1-binding domain Neh2, and another
2 were found in each of the Neh7 and Neh3 domains.
CUL3 contained 4 mutations in the N-terminal domain, 5
in the C-terminal domain, and 1 in the cullin repeat 3 domain (Fig. 2c). Overall, two samples contained both
KEAP1 and NRF2 mutations, while one sample contained
both NRF2 and CUL3 mutations. KEAP1 and CUL3 mutations were mutually exclusive.
Identification of genes regulated by the KEAP1-NRF2CUL3 axis in HNSCC
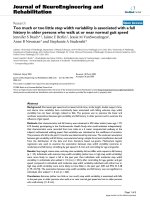
Fig. 2 Overview of genetic changes in KEAP1-NRF2-CUL3 in TCGAHNSCC patients. a Pie chart showing individual percentages of genetic
alterations in the KEAP1-NRF2-CUL3 complex. b Bar chart showing the
types and percentages of mutations of the KEAP1-NRF2-CUL3 complex.
c cBioportal-predicted mutation maps (lollipop plots) showing the
positions of mutations on the functional domains of KEAP1, NRF2, and
CUL3 proteins. The colored lollipops show the positions of the
mutations as identified by whole-exon sequencing
In order to identify the genes regulated by the KEAP1NRF2-CUL3 axis in HNSCC, we focused on the identification of differentially expressed genes by analyzing the RNASeq expression profiles in 54 altered versus 37 normal, and
54 altered versus 225 wild-type samples. A total of 215 upregulated genes and 9 downregulated genes were found in
the altered versus normal analysis (Additional file 1: Table
S1), and 25 upregulated genes and 13 downregulated genes
in the altered versus wild-type analysis (Additional file 2:
Table S2) with logFC >1.5 (p < 0.01 with BH-FDR adjustment). Since the ultimate effect of KEAP1-NRF2-CUL3
axis gene alterations leads to overexpression of NRF2 and
its downstream genes, we focused on the upregulated genes
for further analysis. By integrating both datasets using
Venny web tool ( />index.html), we obtained 17 overlapping upregulated genes
(Fig. 3a). We carried out literature survey to verify whether
the downregulated genes obtained from both methods contains previously reported NRF2 regulated genes or not.
Notably, we didn’t observe any previously reported NRF2
target genes among all downregulated genes.
We also carried out DEG analysis in 225 wild-type versus 37 normal samples to assess the specificity of the 17
genes regulated by the KEAP1-NRF2-CUL3 axis. Strikingly, none of the 17 genes were found in the list of
upregulated genes in the wild-type versus normal samples
with logFC > 1.5 (p < 0.01 with BH-FDR adjustment;
Additional file 3: Table S3). Thus, our analysis clearly
showed that these 17 genes were significantly overexpressed in altered KEAP1-NRF2-CUL3 samples compared
with their normal and wild-type counterparts (Fig. 3b, c).
We then designated these 17 genes as the signature of
gene expression regulated by the KEAP1-NRF2-CUL3 axis
based on their specificity and higher expression (Table 1).
Among these 17 genes, 13 – AKR1B10, AKR1C1,
AKR1C2, AKR1C3, G6PD, GCLC, GCLM, GSTM3,
OSGIN1, SRXN1, TXNRD1, SLC7A11 [11, 35, 36], and
SPP1 [37]– are well-known NRF2-regulated genes, listed
and reviewed in a wide variety of studies.
Namani et al. BMC Cancer (2018) 18:46
Page 5 of 11
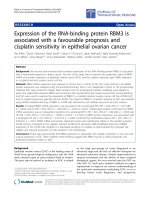
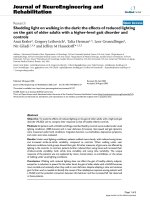
Fig. 3 Identification of expression signature of genes regulated by KEAP1-NRF2-CUL3 axis in TCGA-HNSCC. a Venn diagram of overlapping genes
from both altered versus normal and altered versus wild-type upregulated gene analysis in HNSCC. b Hierarchical clustering of normal, altered,
and wild-type cases showing the specific expression pattern of the 17-gene signature. Green, relatively high expression; red, relatively low
expression. c Box plots of 17-gene signature illustrating significant differences of expression in normal, altered, and wild-type cases. X-axis, RNASeq V2 log CPM (counts per million) values
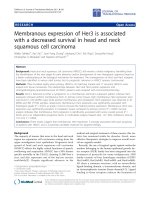
NRF2 binds with the ARE sequences of 3 putative genes
identified in the 17-gene signature
Since the ultimate effect of KEAP1-NRF2-CUL3 gene
alterations results in the overexpression of NRF2 and
its target genes, it was not surprising that the majority of genes in our results were well-characterized
NRF2-regulated genes. In addition, we found 4 putative KEAP1-NRF2-CUL3-regulated genes, NTRK2
(neurotrophic receptor tyrosine kinase 2), RAB6B,
TRIM16L, and UCHL1 and investigated whether
they were also regulated by NRF2. Interestingly, further in silico analysis using the ‘LASAGNA-Search
2.0’ [33] bioinformatics tool identified NRF2-ARE sequences within the -5 kb upstream promoter regions
of the human RAB6B, UCHL1 and TRIM16L genes
(Fig. 4a,b,c; Additional file 4: Table S4). However, we
did not find an ARE sequence in the promoter
region of the NTRK2 gene. Together, our results
suggest that NRF2 directly binds with the promoter
regions of 16 of the genes in the signature and triggers their overexpression; NTRK2 is the exception.
Functional annotation of the gene expression signature
regulated by the KEAP1-NRF2-CUL3 axis
Functional annotation analysis from GO and KEGG
pathway predictions using both DAVID and STRING
v10 revealed that the 17 genes were significantly
enriched (p < 0.001) in the biological processes
daunorubicin metabolic process, doxorubicin metabolic process, oxidation-reduction process, cellular
response to jasmonic acid stimulus, progesterone
metabolic process, response to oxidative stress, and
steroid metabolic process. In KEGG pathway analysis, we found significant enrichment (p < 0.005) in
Namani et al. BMC Cancer (2018) 18:46
Table 1 List of 17 upregulated KEAP1-NRF2-CUL3 axis genes
identified in HNSCC
Gene symbol
Description
AKR1B10
Aldo-keto reductase family 1 member B10
AKR1C1
Aldo-keto reductase family 1 member C1
AKR1C2
Aldo-keto reductase family 1 member C2
AKR1C3
Aldo-keto reductase family 1 member C3
G6PD
Glucose-6-phosphate dehydrogenase
GCLC
Glutamate-cysteine ligase catalytic subunit
GCLM
Glutamate-cysteine ligase modifier subunit
GSTM3
Glutathione S-transferase mu 3
NTRK2
Neurotrophic receptor tyrosine kinase 2
OSGIN1
Oxidative stress induced growth inhibitor 1
RAB6B
RAB6B, member RAS oncogene family
SLC7A11
Solute carrier family 7 member 11
SPP1
Secreted phosphoprotein 1
SRXN1
Sulfiredoxin 1
TRIM16L
Tripartite motif containing 16-like
TXNRD1
Thioredoxin reductase 1
UCHL1
Ubiquitin C-terminal hydrolase L1
the three pathways glutathione metabolism, steroid
hormone biosynthesis, and metabolism of xenobiotics
by cytochrome P450 (Table 2).
The 17-gene signature is significantly associated with
poor survival in TCGA-HNSCC patients
To evaluate the prognostic value of the 17-gene signature
in patient survival, we first analyzed overall survival in the
TCGA-HNSCC cohort available in the SurvExpress web
tool. A total of 283 patient samples were divided into
Fig. 4 In silico analysis of NRF2 binding sites. Schematic representation
shows positions of in silico predicted NRF2 binding sites (AREs) in the
promoter regions of human (a), RAB6B, (b), UCHL1, (c), TRIM16L genes
Page 6 of 11
high-risk (n = 141) and low-risk groups (n = 142) based on
their expression pattern (Fig. 5a). The survival probability
estimates in the two risk groups were visualized as
Kaplan-Meier plots. Strikingly, overall survival analysis revealed that the patients in the high-risk group had poorer
survival (HR = 2.28; CI = 1.56–3.32; p = 1.221e-05) than
the low-risk group (Fig. 5b). Thus, our analysis strongly
suggests that genes regulated by the KEAP1-NRF2-CUL3
axis are powerful predictors of a poor prognosis in
HNSCC patients. In addition, we also carried out the
multivariate analysis with the limited variables present in
Survexpress database. Consistent with the above results,
patients with high-risk scores for clinical variables such as
tumor grades G2 and G3, pathological stages T1 and T2,
and pathological disease stages II and III were significantly
associated with poor survival whereas the results were
insignificant in other variables (Additional file 5: Table
S5). Kaplan-Meier survival plots with log-rank test results
for the significant clinical variables are shown in
Additional file 6: Figure S1.
Association of 17-gene signature with disease-free survival
(DFS), metastasis-free survival (MFS), and recurrence in
HNSCC patients
After analyzing the prognostic value of the 17-gene signature in the TCGA cohort, we evaluated its prognostic
value in another 3 HNSCC cohorts containing DFS,
MFS, and recurrence data. Among these, Saintigny et al.
(GSE26549) [22] contains DFS data, while Jung et al. (EMTAB-1328) [23] contains MFS data. The third cohort,
Cohen et al. (GSE10300) [24], contains recurrence data.
Interestingly, our DFS analysis using the Saintigny et al.
(GSE26549) [22] cohort showed that patients in the
high-risk group with increased expression of the 17-gene
signature had poorer survival (HR = 2.28; CI = 1.56–3.32;
p = 1.221e-05) than the low-risk group (Fig. 6a). Likewise, we found a markedly shorter MFS (HR = 2.83, CI
= 1.47–5.48; p = 0.001) in the high-risk group of the Jung
et al. (E-MTAB-1328) [23] cohort (Fig. 6b). In the Cohen
et al. (GSE10300) [24] cohort, we found lower
recurrence-free survival (HR = 4.15; CI = 1.14–15.05; p <
0.01) in the high-risk group with the17-gene signature
than in the low-risk group (Fig. 6c). Thus, log-rank analysis revealed that the 17-gene signature was associated
with a significantly increased risk of recurrence in
HNSCC. The multivariate analysis results for the above
cohorts were listed in Additional file 5: Table S5.
Discussion
The TCGA network provides valuable information about
genetic changes in key genes involved in the oxidativestress pathway, such as KEAP1, NRF2, and CUL3, in
HNSCC patients. These particular data permit researchers to identify potential biomarkers, druggable
Namani et al. BMC Cancer (2018) 18:46
Page 7 of 11
Table 2. GO and KEGG pathway analysis of 17 KEAP1-NRF2-CUL3 axis regulated genes in HNSCC
Term
p-value
Genes
3.22E-08
AKR1C3, AKR1C2, AKR1B10, AKR1C1
GO_Biological Proceess (GO_BP)
GO:0044597~daunorubicin metabolic process
GO:0044598~doxorubicin metabolic process
3.22E-08
AKR1C3, AKR1C2, AKR1B10, AKR1C1
GO:0055114~oxidation-reduction process
3.29E-07
AKR1C3, AKR1C2, G6PD, AKR1B10,
OSGIN1, TXNRD1, AKR1C1, SRXN1
GO:0071395~cellular response to jasmonic acid stimulus
4.46E-06
AKR1C3, AKR1C2, AKR1C1
GO:0042448~progesterone metabolic process
2.67E-05
AKR1C3, AKR1C2, AKR1C1
GO:0006979~response to oxidative stress
1.18E-04
GCLC, GCLM, SRXN1, SLC7A11
GO:0008202~steroid metabolic process
6.58E-04
AKR1C3, AKR1C2, AKR1B10
hsa00480:Glutathione metabolism
5.9956E-05
GSTM3, G6PD, GCLC, GCLM
hsa00140:Steroid hormone biosynthesis
0.00362777
AKR1C3, AKR1C2, AKR1C1
hsa00980:Metabolism of xenobiotics by cytochrome P450
0.00584594
AKR1C2, GSTM3, AKR1C1
KEGG Pathway
Fig. 5 Correlation of 17-gene signature with poor survival in TCGAHNSCC patients. a Box plots of the expression differences of the 17-gene
signature in low (green) and high (red) risk groups of TCGA-HNSCC
patients. X-axis, gene expression value of each gene; above the box plot,
p-values of the expression difference between risk groups. b Kaplan-Meier
survival plots showing that high expression of the 17-gene signature is
associated with poor survival in TCGA-HNSCC patients. Red, high-risk
group; green, low-risk group; top right corner inset, numbers of high- and
low-risk samples, numbers of censored samples marked with + and
concordance index (CI) of each risk group; X-axis, time (months); Y-axis,
overall survival probability; HR, hazard ratio; CI, confidence interval
mutations, and therapeutic targets for personalized
medicine. In this study, using a new approach that consisted of two RNA-Seq DEG analysis methods, we identified a common set of 17 genes regulated by the
KEAP1-NRF2-CUL3 axis that constitute an expression
signature in TCGA-HNSCC patients. We further tested
this signature in 4 independent clinical cohorts including
the TCGA-HNSCC cohort. Kaplan-Meier survival plots
generated for all 4 cohorts showed that higher expression of this gene signature is significantly correlated with
poor survival outcomes.
The DFS data of Saintigny et al. (GSE26549) [22] suggested that patients with an increased 17-gene signature
had poor benefit from chemotherapy because of aggressive
expression of genes downstream of NRF2 that are involved
in chemoresistance. Our GO and KEGG analysis of the 17gene signature strongly supported the above conclusion.
The top two enriched GO biological process terms were
‘daunorubicin metabolic process’ and ‘doxorubicin metabolic process’, clearly indicating that the genes involved in
these processes, such as AKR (aldo-keto reductase) 1C3,
AKR1C2, AKR1B10, and AKR1C1, are crucial drugmetabolizing enzymes whose overexpression is strongly associated with drug resistance in many cancers [38, 39]
(Table 2). Aldo-keto reductases are well-characterized
NRF2-regulated genes which contain consensus ARE sequences in their promoter regions for the binding and
transactivation of NRF2 [39–41]. A recent lung cancer
study emphasized that a panel of aldo-keto reductase family
genes are markedly upregulated in patients harboring somatic alterations in the NRF2 pathway and considered to be
biomarkers of NRF2 hyperactivation in lung cancer [17].
Consistent with their study, we showed that aldo-keto reductases were not only highly expressed in lung cancer but
also in HNSCC patients with a dysregulated NRF2 pathway
and could be used as biomarkers.
Namani et al. BMC Cancer (2018) 18:46
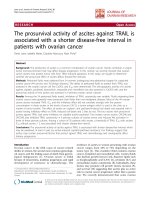
Fig. 6 17-gene signature predicts poor survival in three independent
cohorts. Kaplan-Meier survival plots showing that high expression of the
17-gene signature is associated with poor survival in 3 independent
HNSCC cohorts: a Saintigny et al. (GSE26549). b Jung et al. (E-MTAB-1328).
c Cohen et al. (GSE10300). Red, high-risk group; green, low-risk group
More interestingly, the top hit in the KEGG pathway
analysis of the 17-gene signature identified an important
pathway involved in oxido-reductase activity known as
‘glutathione metabolism’(Table 2). The genes listed in this
pathway, such as GSTM3, G6PD, GCLC, and GCLM, play
major roles in redox balance in normal cells. The redox
imbalance in cancer cells because of the overexpression of
these genes mainly leads to tumor growth and drug resistance [42]. Thus, our study revealed that NRF2 drives the
expression of genes involved in glutathione metabolism,
so the development of NRF2 inhibitors could be a means
of altering tumor growth and drug resistance in HNSCC.
Page 8 of 11
A very interesting recent study on the inhibition of NRF2,
glutathione (GSH), and thioredoxin (Trx) in head and
neck cancer (HNC) strongly supports our prediction that
combined inhibition of the GSH, Trx, and NRF2 pathways
could be an effective strategy to overcome therapeutic resistance in HNC [43].
In addition to the GO and KEGG analyses, we used the
STRING v10 database to construct a PPI network of the
17-gene signature along with the KEAP1, NRF2, and
CUL3 genes to reveal the complex associations between
these genes. The enrichment results based on functional
association between these genes revealed that the majority
were closely associated with each other through a coordinated interactive network (Fig. 7). Thus, PPI network analysis suggested that the cross-talk of KEAP1, NRF2, and
CUL3 with the 17-gene signature coordinately drives
tumor progression and therapeutic resistance in HNSCC.
Apart from known NRF2-regulated genes, we found 4 putative KEAP1-NRF2-CUL3 axis-regulated genes: NTRK2,
RAB6B, TRIM16L, and UCHL1. NTRK2, also known as
tropomyosin receptor kinase B, is a neurotrophin-binding
protein that phosphorylates members of the MAPK pathway. This receptor plays a major role in cell differentiation,
specifically neuronal proliferation, differentiation, and survival, through its kinase signaling cascade [44]. Emerging
evidence suggests that NTRK2 plays an important role in
different cancers. For instance, it has been reported to be
highly expressed in non-small cell lung cancer A549 cells
[45] and is associated with a worse outcome in patients with
Wilms’ tumor [46].
Although NRF2-ARE sequences were not found in the
NTRK2 promoter region, we looked into why NTRK2
was highly upregulated in altered samples. Surprisingly,
a recent report revealed that NTRK2 inhibits KEAP1 expression in breast cancer cells and is involved in cancer
proliferation, survival, and metastasis [47]. Thus, the
overexpression of NTRK2 in altered samples clearly suggests that NTRK2 inhibits the expression of KEAP1, initiates the hyperactivation of genes downstream of NRF2,
and is involved in HNSCC tumorigenesis. Another putative KEAP1-NRF2-CUL3 gene, UCHL1 (ubiquitin Cterminal hydrolase L1), has also been implicated in different types of human cancer such as breast [48, 49],
melanoma [50], ovarian [51], colorectal [52], osteosarcoma [53], and gastric [54, 55] cancers, and multiple
myeloma [56]. Most of the cancer studies on UCHL1
have revealed that overexpression and promoter methylation of UCHL1 are key reasons for UCHL1-mediated
metastasis. Due to the adverse effect of overexpression
of UCHL1, it is considered to be a biomarker and a
therapeutic target in many cancers. The exact functions
of the other two putative KEAP1-NRF2-CUL3axis-regulated genes, RAB6B and TRIM16L, are unknown in cancer cells and therefore are under investigation in our lab.
Namani et al. BMC Cancer (2018) 18:46
Page 9 of 11
Fig. 7 Protein-protein interaction network analysis of the 17-gene signature predicting the functional correlation of the KEAP1-NRF2-CUL3 axis
with genes involved in drug metabolism and glutathione metabolic pathways in HNSCC
Altogether, the above evidence suggests an oncogenic
role of the 17-gene signature in many cancers.
Conclusions
In conclusion, we have identified a comprehensive gene
signature of the KEAP1-NRF2-CUL3 axis, increased expression of which predicts poor survival in HNSCC.
Moreover, the components of this 17-gene signature can
be used as potential biomarkers to identify genetic alterations of the NRF2 pathway in HNSCC. Furthermore,
the development of combined inhibitors for this 17-gene
signature, along with NRF2, could pave the way for the
development of personalized/precision medicine to suppress NRF2-mediated tumor growth and drug resistance.
Additional files
Additional file 1: Table S1. List of differentially expressed genes
obtained from the RNA-Seq analysis of altered versus normal samples.
(XLS 48 kb)
Additional file 2: Table S2. List of differentially expressed genes
obtained from the RNA-Seq analysis of altered versus wild-type samples.
(XLS 29 kb)
Additional file 3: Table S3. List of differentially expressed genes
obtained from the RNA-Seq analysis of wild-type versus normal samples.
(XLS 49 kb)
Additional file 4: Table S4. List of NRF2-AREs identified in the -5 kb
promoter regions of RAB6B, UCHL1 and TRIM16L genes. (XLS 38 kb)
Additional file 5: Table S5. Multivariate analysis of 17-gene signature
in 4 independent cohorts (XLS 25 kb)
Additional file 6: Figure S1. Kaplan-Meier plots showing the survival
analysis of TCGA-HNSCC cohort clinical variables: tumor grades G2 (A)
and G3 (B); pathologic T stagesT1 (C) and T2 (D); and pathologic disease
stages II (E) and III (F). (TIFF 798 kb)
Abbreviations
AKR1B10: Aldo-keto reductase family 1 member B10; AKR1C1: Aldo-keto
reductase family 1 member C1; AKR1C2: Aldo-keto reductase family 1
member C2; AKR1C3: Aldo-keto reductase family 1 member C3;
ARE: Antioxidant responsive element; BH: Benjamini-Hochberg; CUL3: Cullindependent E3 ligase; DAVID: Database for annotation visualization and
integrated discovery; DEG: Differential Expression Genes; DFS: Disease free
survival; edgeR: Empirical Analysis of Digital Gene Expression Data in R;
FDR: False discovery rate; G6PD: Glucose-6-phosphate dehydrogenase;
GCLC: Glutamate-cysteine ligase catalytic subunit; GCLM: Glutamate-cysteine
ligase modifier subunit; GDAC: Genome Data Analysis Center; GO: Gene
ontology; GSH: glutathione; GSTM3: Glutathione S-transferase mu 3;
HNSCCC: Head and Neck Squamous Cell Cancer; KEAP1: Kelch like-ECHassociated protein 1; KEGG: Kyoto Encyclopedia of Genes and Genomes;
MFS: Metastasis-free survival; NRF2: Nuclear factor erythroid 2-related factor;
NTRK2: Neurotrophic receptor tyrosine kinase 2; OSGIN1: Oxidative stress
induced growth inhibitor 1; PPI: Protein-Protein interaction; RAB6B: RAB6B,
member RAS oncogene family; RBX1: Ring-Box 1; RT-qPCR: Reverse
transcription–quantitative polymerase chain reaction; SLC7A11: Solute carrier
family 7 member 11; SPP1: Secreted phosphoprotein 1; SRXN1: Sulforedoxin
1; TCGA: The Cancer Genome Atlas; TRIM16L: Tripartite motif containing 16like; TrkB: Tropomyosin receptor kinase B; Trx: Thioredoxin;
TXNRD1: Thioredoxin reductase 1; UCHL1: Ubiquitin C-terminal hydrolase L1
Acknowledgements
The authors would like to thank the TCGA network for providing publicly
available NGS data.
Namani et al. BMC Cancer (2018) 18:46
Funding
This work was supported by the National Natural Science Foundation of
China to XT (31,170,743 and 81,172,230).
Availability of data and materials
The TCGA dataset and other patients microarray datas utilized in this study
are publicly available and mentioned in the article.
Authors’ contributions
XT and AN conceived the project; AN, Md-MR, MC and XT analyzed the data
and drafted the manuscript; MC had critically read the manuscript; XT edited
and reviewed the manuscript. All authors read and approved the final
manuscript.
Ethics approval and consent to participate
Not required.
Consent for publication
Not applicable.
Competing interests
The authors declare that they have no competing interests.
Publisher’s Note
Springer Nature remains neutral with regard to jurisdictional claims in
published maps and institutional affiliations.
Received: 8 June 2017 Accepted: 12 December 2017
References
1. Mehanna H, Paleri V, West CM, Nutting C. Head and neck cancer–part 1:
epidemiology, presentation, and prevention. BMJ. 2010;341:c4684.
2. Ferlay J, Soerjomataram I, Dikshit R, Eser S, Mathers C, Rebelo M, Parkin DM,
Forman D, Bray F. Cancer incidence and mortality worldwide: sources, methods
and major patterns in GLOBOCAN 2012. Int J Cancer. 2015;136(5):E359–86.
3. Pai SI, Westra WH. Molecular pathology of head and neck cancer: implications
for diagnosis, prognosis, and treatment. Annu Rev Pathol. 2009;4:49–70.
4. Marron M, Boffetta P, Zhang ZF, Zaridze D, Wunsch-Filho V, Winn DM, Wei
Q, Talamini R, Szeszenia-Dabrowska N, Sturgis EM, et al. Cessation of alcohol
drinking, tobacco smoking and the reversal of head and neck cancer risk.
Int J Epidemiol. 2010;39(1):182–96.
5. Leemans CR, Braakhuis BJ, Brakenhoff RH. The molecular biology of head
and neck cancer. Nat Rev Cancer. 2011;11(1):9–22.
6. Namani A, Li Y, Wang XJ, Tang X. Modulation of NRF2 signaling pathway by
nuclear receptors: implications for cancer. Biochim Biophys Acta. 2014;
1843(9):1875–85.
7. Ahmed SM, Luo L, Namani A, Wang XJ, Tang X. Nrf2 signaling pathway:
pivotal roles in inflammation. Biochim Biophys Acta. 2017;1863(2):585–97.
8. Jaramillo MC, Zhang DD. The emerging role of the Nrf2-Keap1 signaling
pathway in cancer. Genes Dev. 2013;27(20):2179–91.
9. Wang H, Liu K, Geng M, Gao P, Wu X, Hai Y, Li Y, Luo L, Hayes JD, Wang XJ,
et al. RXRalpha inhibits the NRF2-ARE signaling pathway through a direct
interaction with the Neh7 domain of NRF2. Cancer Res. 2013;73(10):3097–108.
10. Tang X, Wang H, Fan L, Wu X, Xin A, Ren H, Wang XJ. Luteolin inhibits Nrf2
leading to negative regulation of the Nrf2/ARE pathway and sensitization of
human lung carcinoma A549 cells to therapeutic drugs. Free Radic Biol
Med. 2011;50(11):1599–609.
11. Suzuki T, Motohashi H, Yamamoto M. Toward clinical application of the
Keap1-Nrf2 pathway. Trends Pharmacol Sci. 2013;34(6):340–6.
12. Stacy DR, Ely K, Massion PP, Yarbrough WG, Hallahan DE, Sekhar KR,
Freeman ML. Increased expression of nuclear factor E2 p45-related
factor 2 (NRF2) in head and neck squamous cell carcinomas. Head
Neck. 2006;28(9):813–8.
13. Huang CF, Zhang L, Ma SR, Zhao ZL, Wang WM, He KF, Zhao YF, Zhang WF,
Liu B, Sun ZJ. Clinical significance of Keap1 and Nrf2 in oral squamous cell
carcinoma. PLoS One. 2013;8(12):e83479.
14. The Cancer Genome Atlas Network (348 collaborators). Comprehensive
genomic characterization of head and neck squamous cell carcinomas.
Nature. 2015;517(7536):576–82.
Page 10 of 11
15. Cescon DW, She D, Sakashita S, Zhu CQ, Pintilie M, Shepherd FA, Tsao MS.
NRF2 pathway activation and adjuvant chemotherapy benefit in lung
Squamous cell carcinoma. Clin Cancer Res. 2015;21(11):2499–505.
16. Qian Z, Zhou T, Gurguis CI, Xu X, Wen Q, Lv J, Fang F, Hecker L, Cress AE,
Natarajan V, et al. Nuclear factor, erythroid 2-like 2-associated molecular
signature predicts lung cancer survival. Sci Rep. 2015;5:16889.
17. MacLeod AK, Acosta-Jimenez L, Coates PJ, McMahon M, Carey FA, Honda T,
Henderson CJ, Wolf CR. Aldo-keto reductases are biomarkers of NRF2
activity and are co-ordinately overexpressed in non-small cell lung cancer.
Br J Cancer. 2016;115(12):1530–9.
18. Namani A, Cui QQ, Wu Y, Wang H, Wang XJ, Tang X. NRF2-regulated
metabolic gene signature as a prognostic biomarker in non-small cell lung
cancer. Oncotarget. 2017;8(41):69847–62.
19. Martinez VD, Vucic EA, Thu KL, Pikor LA, Lam S, Lam WL. Disruption of
KEAP1/CUL3/RBX1 E3-ubiquitin ligase complex components by multiple
genetic mechanisms: association with poor prognosis in head and neck
cancer. Head Neck. 2015;37(5):727–34.
20. Cerami E, Gao J, Dogrusoz U, Gross BE, Sumer SO, Aksoy BA, Jacobsen A,
Byrne CJ, Heuer ML, Larsson E, et al. The cBio cancer genomics portal: an
open platform for exploring multidimensional cancer genomics data.
Cancer Discovery. 2012;2(5):401–4.
21. Gao J, Aksoy BA, Dogrusoz U, Dresdner G, Gross B, Sumer SO, Sun Y, Jacobsen
A, Sinha R, Larsson E, et al. Integrative analysis of complex cancer genomics
and clinical profiles using the cBioPortal. Sci Signal. 2013;6(269):pl1.
22. Saintigny P, Zhang L, Fan YH, El-Naggar AK, Papadimitrakopoulou VA, Feng
L, Lee JJ, Kim ES, Ki Hong W, Mao L. Gene expression profiling predicts the
development of oral cancer. Cancer Prev Res (Phila). 2011;4(2):218–29.
23. Jung AC, Job S, Ledrappier S, Macabre C, Abecassis J, de Reynies A, Wasylyk
B. A poor prognosis subtype of HNSCC is consistently observed across
methylome, transcriptome, and miRNome analysis. Clin Cancer Res. 2013;
19(15):4174–84.
24. Cohen EE, Zhu H, Lingen MW, Martin LE, Kuo WL, Choi EA, Kocherginsky M,
Parker JS, Chung CH, Rosner MR. A feed-forward loop involving protein kinase
Calpha and microRNAs regulates tumor cell cycle. Cancer Res. 2009;69(1):65–74.
25. Goldstein LD, Lee J, Gnad F, Klijn C, Schaub A, Reeder J, Daemen A,
Bakalarski CE, Holcomb T, Shames DS, et al. Recurrent loss of NFE2L2 exon 2
is a mechanism for Nrf2 pathway activation in human cancers. Cell Rep.
2016;16(10):2605–17.
26. Morris VK, Lucas FA, Overman MJ, Eng C, Morelli MP, Jiang ZQ, Luthra R,
Meric-Bernstam F, Maru D, Scheet P et al: Clinicopathologic characteristics
and gene expression analyses of non-KRAS 12/13, RAS-mutated metastatic
colorectal cancer. Ann Oncol 2014, 25(10):2008-2014.
27. Gentleman RC, Carey VJ, Bates DM, Bolstad B, Dettling M, Dudoit S, Ellis B,
Gautier L, Ge Y, Gentry J, et al. Bioconductor: open software development
for computational biology and bioinformatics. Genome Biol. 2004;5(10):R80.
28. Robinson MD, McCarthy DJ, Smyth GK. edgeR: a bioconductor package for
differential expression analysis of digital gene expression data.
Bioinformatics. 2010;26(1):139–40.
29. Babicki S, Arndt D, Marcu A, Liang Y, Grant JR, Maciejewski A, Wishart DS.
Heatmapper: web-enabled heat mapping for all. Nucleic Acids Res. 2016;
44(W1):W147–53.
30. Wickham H. ggplot2: elegant graphics for data analysis. New York: SpringerVerlag; 2009.
31. Huang d W, Sherman BT, Lempicki RA. Systematic and integrative analysis
of large gene lists using DAVID bioinformatics resources. Nat Protoc. 2009;
4(1):44–57.
32. Szklarczyk D, Morris JH, Cook H, Kuhn M, Wyder S, Simonovic M, Santos A,
Doncheva NT, Roth A, Bork P, et al. The STRING database in 2017: qualitycontrolled protein-protein association networks, made broadly accessible.
Nucleic Acids Res. 2017;45(D1):D362–8.
33. Lee C, Huang CH. LASAGNA-search 2.0: integrated transcription factor
binding site search and visualization in a browser. Bioinformatics. 2014;
30(13):1923–5.
34. Aguirre-Gamboa R, Gomez-Rueda H, Martinez-Ledesma E, Martinez-Torteya
A, Chacolla-Huaringa R, Rodriguez-Barrientos A, Tamez-Pena JG, Trevino V.
SurvExpress: an online biomarker validation tool and database for cancer
gene expression data using survival analysis. PLoS One. 2013;8(9):e74250.
35. Chorley BN, Campbell MR, Wang X, Karaca M, Sambandan D, Bangura F,
Xue P, Pi J, Kleeberger SR, Bell DA. Identification of novel NRF2-regulated
genes by ChIP-Seq: influence on retinoid X receptor alpha. Nucleic Acids
Res. 2012;40(15):7416–29.
Namani et al. BMC Cancer (2018) 18:46
36. Hayes JD, Dinkova-Kostova AT. The Nrf2 regulatory network provides an
interface between redox and intermediary metabolism. Trends Biochem Sci.
2014;39(4):199–218.
37. Shibata T, Saito S, Kokubu A, Suzuki T, Yamamoto M, Hirohashi S. Global
downstream pathway analysis reveals a dependence of oncogenic NF-E2related factor 2 mutation on the mTOR growth signaling pathway. Cancer
Res. 2010;70(22):9095–105.
38. Ma J, Luo DX, Huang C, Shen Y, Bu Y, Markwell S, Gao J, Liu J, Zu X, Cao Z,
et al. AKR1B10 overexpression in breast cancer: association with tumor size,
lymph node metastasis and patient survival and its potential as a novel
serum marker. Int J Cancer. 2012;131(6):E862–71.
39. Jung KA, Choi BH, Nam CW, Song M, Kim ST, Lee JY, Kwak MK. Identification
of aldo-keto reductases as NRF2-target marker genes in human cells. Toxicol
Lett. 2013;218(1):39–49.
40. Lou H, Du S, Ji Q, Stolz A. Induction of AKR1C2 by phase II inducers:
identification of a distal consensus antioxidant response element regulated
by NRF2. Mol Pharmacol. 2006;69(5):1662–72.
41. Penning TM, Drury JE. Human aldo-keto reductases: function, gene
regulation, and single nucleotide polymorphisms. Arch Biochem Biophys.
2007;464(2):241–50.
42. Trachootham D, Alexandre J, Huang P. Targeting cancer cells by ROSmediated mechanisms: a radical therapeutic approach? Nat Rev Drug
Discov. 2009;8(7):579–91.
43. Roh JL, Jang H, Kim EH, Shin D. Targeting of the glutathione, Thioredoxin,
and Nrf2 antioxidant Systems in Head and Neck Cancer. Antioxid Redox
Signal. 2017;27(2):106–14.
44. Minichiello L. TrkB signalling pathways in LTP and learning. Nat Rev
Neurosci. 2009;10(12):850–60.
45. Zhang S, Guo D, Luo W, Zhang Q, Zhang Y, Li C, Lu Y, Cui Z, Qiu X. TrkB is
highly expressed in NSCLC and mediates BDNF-induced the activation of
Pyk2 signaling and the invasion of A549 cells. BMC Cancer. 2010;10:43.
46. Eggert A, Grotzer MA, Ikegaki N, Zhao H, Cnaan A, Brodeur GM, Evans AE.
Expression of the neurotrophin receptor TrkB is associated with unfavorable
outcome in Wilms' tumor. J Clin Oncol Off J Am Soc Clin Oncol. 2001;19(3):689–96.
47. Kim MS, Lee WS, Jin W. TrkB promotes breast cancer metastasis via suppression
of Runx3 and Keap1 expression. Molecules Cells. 2016;39(3):258–65.
48. Schroder C, Milde-Langosch K, Gebauer F, Schmid K, Mueller V, Wirtz RM, MeyerSchwesinger C, Schluter H, Sauter G, Schumacher U. Prognostic relevance of
ubiquitin C-terminal hydrolase L1 (UCH-L1) mRNA and protein expression in
breast cancer patients. J Cancer Res Clin Oncol. 2013;139(10):1745–55.
49. Jin Y, Zhang W, Xu J, Wang H, Zhang Z, Chu C, Liu X, Zou Q. UCH-L1 involved
in regulating the degradation of EGFR and promoting malignant properties in
drug-resistant breast cancer. Int J Clin Exp Pathol. 2015;8(10):12500–8.
50. Wulfanger J, Biehl K, Tetzner A, Wild P, Ikenberg K, Meyer S, Seliger B.
Heterogeneous expression and functional relevance of the ubiquitin carboxylterminal hydrolase L1 in melanoma. Int J Cancer. 2013;133(11):2522–32.
51. Suong DN, Thao DT, Masamitsu Y, Thuoc TL. Ubiquitin carboxyl hydrolase L1
significance for human diseases. Protein Peptide Letters. 2014;21(7):624–30.
52. Heitzer E, Artl M, Filipits M, Resel M, Graf R, Weissenbacher B, Lax S, Gnant
M, Wrba F, Greil R, et al. Differential survival trends of stage II colorectal
cancer patients relate to promoter methylation status of PCDH10, SPARC,
and UCHL1. Modern Pathol. 2014;27(6):906–15.
53. Zheng S, Qiao G, Min D, Zhang Z, Lin F, Yang Q, Feng T, Tang L, Sun Y, Zhao
H, et al. Heterogeneous expression and biological function of ubiquitin
carboxy-terminal hydrolase-L1 in osteosarcoma. Cancer Lett. 2015;359(1):36–46.
54. Wang G, Zhang W, Zhou B, Jin C, Wang Z, Yang Y, Chen Y, Feng X. The
diagnosis value of promoter methylation of UCHL1 in the serum for
progression of gastric cancer. Biomed Res Int. 2015;2015:741030.
55. YY G, Yang M, Zhao M, Luo Q, Yang L, Peng H, Wang J, Huang SK, Zheng ZX,
Yuan XH, et al. The de-ubiquitinase UCHL1 promotes gastric cancer metastasis
via the Akt and Erk1/2 pathways. Tumor Biol. 2015;36(11):8379–87.
56. Hussain S, Bedekovics T, Chesi M, Bergsagel PL, Galardy PJ. UCHL1 is a
biomarker of aggressive multiple myeloma required for disease progression.
Oncotarget. 2015;6(38):40704–18.
Page 11 of 11
Submit your next manuscript to BioMed Central
and we will help you at every step:
• We accept pre-submission inquiries
• Our selector tool helps you to find the most relevant journal
• We provide round the clock customer support
• Convenient online submission
• Thorough peer review
• Inclusion in PubMed and all major indexing services
• Maximum visibility for your research
Submit your manuscript at
www.biomedcentral.com/submit