Outcome of breast cancer screening in Denmark
Bạn đang xem bản rút gọn của tài liệu. Xem và tải ngay bản đầy đủ của tài liệu tại đây (771.64 KB, 9 trang )
Lynge et al. BMC Cancer (2017) 17:897
DOI 10.1186/s12885-017-3929-6
RESEARCH ARTICLE
Open Access
Outcome of breast cancer screening in
Denmark
Elsebeth Lynge1* , Martin Bak2, My von Euler-Chelpin3, Niels Kroman4, Anders Lernevall5, Nikolaj Borg Mogensen6,
Walter Schwartz7, Adam Jan Wronecki8 and Ilse Vejborg9
Abstract
Background: In Denmark, national roll-out of a population-based, screening mammography program took place in
2007–2010. We report on outcome of the first four biennial invitation rounds.
Methods: Data on screening outcome were retrieved from the 2015 and 2016 national screening quality reports.
We calculated coverage by examination; participation after invitation; detection-, interval cancer- and false-positive
rates; cancer characteristics; sensitivity and specificity, for Denmark and for the five regions.
Results: At the national level coverage by examination remained at 75–77%; lower in the Capital Region than in
the rest of Denmrk. Detection rate was slightly below 1% at first screen, 0.6% at subsequent screens, and one
region had some fluctuation over time. Ductal carcinoma in situ (DCIS) constituted 13–14% of screen-detected
cancers. In subsequent rounds, 80% of screen-detected invasive cancers were node negative and 40% ≤10 mm.
False-positive rate was around 2%; higher for North Denmark Region than for the rest of Denmark. Three out of 10
breast cancers in screened women were diagnosed as interval cancers.
Conclusions: High coverage by examination and low interval cancer rate are required for screening to decrease
breast cancer mortality. Two pioneer local screening programs starting in the 1990s were followed by a decrease in
breast cancer mortality of 22–25%. Coverage by examination and interval cancer rate of the national program were
on the favorable side of values from the pioneer programs. It appears that the implementation of a national
screening program in Denmark has been successful, though regional variations need further evaluation to assure
optimization of the program.
Keywords: Breast cancer, Ductal carcinoma in situ., Screening., Mammography.
Background
Breast cancer has been the most common cancer disease
in Danish women ever since national cancer registration
started in 1943. However, the disease has been on a
steady increase with a doubling of the age-standardised
rate (Nordic standard population) from 69 per 100,000
in the early 1940s to 145 today [1]. This development is
not surprising, given that the risk of breast cancer is
closely related to the woman’s reproductive history.
Women born in 1929–1947 reported an average age of
menarche at 13.56 years [2], while this had decreased to
13.30 years for women born primarily in 1960–1980 [3].
* Correspondence:
1
Department of Public Health, University of Copenhagen, Øster
Farimagsgade 5, 1014 Copenhagen, Denmark
Full list of author information is available at the end of the article
At the same time, the age at first birth has increased, it
was 23 years around 1960 and 29 years in 2015 [4]. The
proportion of obese women increased from 1994 to
2010 [5]. With this considerable extension of the time
window from menarche to first birth and with increased
obesity, Danish women became more vulnerable to
breast cancer, and primary prevention is difficult.
Since the late 1970s, node negative and moderately
node positive breast cancers dominated the increasing
incidence, probably as a result of emerging breast awareness [6]. Furthermore, new treatment modalities in the
form of staging with axillary lymph node dissection; and
hormonal and adjuvant chemotherapy treatment have
helped to keep breast cancer mortality in control. Breast
cancer mortality was at the level of 45 per 100,000 in
the early 1940s and only increased to 51 per 100,000 in
© The Author(s). 2017 Open Access This article is distributed under the terms of the Creative Commons Attribution 4.0
International License ( which permits unrestricted use, distribution, and
reproduction in any medium, provided you give appropriate credit to the original author(s) and the source, provide a link to
the Creative Commons license, and indicate if changes were made. The Creative Commons Public Domain Dedication waiver
( applies to the data made available in this article, unless otherwise stated.
Lynge et al. BMC Cancer (2017) 17:897
the mid 1990s, where after a decrease has been observed
to 33 per 100,000 in 2014 [1]. However, breast cancer
still causes 1100 deaths per year; being the second cause
of cancer death in Danish women.
In the 1980s, a number of randomized controlled trial
– first of all from Sweden – showed that screening
mammography with early detection of small breast
cancers could help to reduce breast cancer mortality [7].
In 2003, the European Union recommended populationbased breast cancer screening [8]. In Denmark, this
development led to the start of some regional screening
programs in the early 1990s, and to national roll-out of
screening in 2007–2010.
The long-tem purpose of breast cancer screening is to
reduce breast cancer mortality [9]. When a screening
program is implemented, it is, however, necessary to
know relatively quickly whether or not the program is
on the right track. The randomized controlled trials
showed that short-term indicators of the screening
program like the interval cancer rate, rate of screendetected cancers, etc. correlated well with the later
decline in breast cancer mortality [10]. It has therefore
become standard to evaluate the early outcome of a
screening program based on a set of short term indicators [11]. We report here on the short-term outcomes of
the national Danish screening program.
Methods
Breast cancer screening program
In the 1990s, Denmark was divided into 16 administrative areas. A population-based screening program started
in one of these areas; the municipality of Copenhagen;
in April 1991 [12]. This was followed by programs in the
county of Funen in November 1993 [13], and in the
municipality of Frederiksberg in June 1994. Women
aged 50–69 years were personally invited to biennial
screening at dedicated screening clinics being stationary
or mobile. One invitation, eventually followed by two
reminders or another invitation, were sent to all women
unless they had informed the program that they did not
want to be invited. Furthermore women terminally ill, in
breast cancer treatment/control, or with mammography
within the last 12 months were not invited if this information was known to the screening program.
Trained radiographers took the mammograms, and
screening did not include clinical breast examination.
Two-view mammography was used at the first examination, and during the first ten years of the programs,
women with fatty breast tissue would be scheduled for
one-view at next screen, whereas women with mixed/
dense tissue would be scheduled for two-view mammography. From around 2001, two-view mammography was
used in all examinations. Mammograms were read
independently by two trained radiologists. Women with
Page 2 of 9
suspicious finding were recalled for diagnostics at the
hospital radiology departments. In 2006, the programs
switched from analog to digital mammography.
In 1999, it became mandatory for Danish counties to
offer breast cancer screening, but it was up to the minister of health to decide on the time of implementation of
this law [14]. Screening started in the small county of
Bornholm in 2001, and in Zealand county in 2004. In
2005, the breast cancer screening program in the municipality of Copenhagen was reported to have been
followed by a 25% reduction in breast cancer mortality
in the target population and a 37% reduction amongst
participants [15]. Based on these results, the minister of
health required that the new regions (from 1 January
2007) should start breast cancer screening before the
end of 2007 and that the rollout should be completed at
the end of 2009 [16]. A national quality database was
implemented, and a steering committee was appointed
with the responsibilities to monitor quality and to draw
up national clinical guidelines for the screening [17].
The national screening program was in all aspects organized similarly to the pioneer programs.
Danish quality assurance Data Base on mammography
screening – DKMS
The breast cancer screening program is monitored
annually based on 11 quality assurance indicators [11]
inspired by the European guidelines [18]: radiation dose;
participation after invitation; adherence to screening
intervals; recall; interval cancers; invasive cancers as proportion of screen-detected cancers (invasive + ductal
carcinoma in situ (DCIS)); node negative as proportion
of invasive cancers; invasive cancers ≤10 mm as proportion of invasive cancers; benign vs. malignant operations;
and response time. Using a slightly modified version of
these indicators, we report here on: coverage by examination; participation after invitation; detection rate; interval cancer rate; and cancer characteristics (proportion
invasive, node-negative, and size). From the data we
furthermore calculated number of false positive screens;
sensitivity; and specificity. The reported data covered the
first four approximately biennial invitation rounds. Interval cancer data were not available for the fourth round.
Data in the DKMS on the target population for screening are retrieved from the Central Population Register
(CPR) including all persons with a permanent address at
any time since 1968. Data on invitations to screening are
retrieved from the regional booking systems, which are
based on always updated versions of CPR. Data on
participation in screening and on screening outcome are
retrieved from the Danish Patient Register. This register
includes information on all out-and inpatient contacts to
Danish hospitals. As all screening, assessment of women
with suspicious screens, and eventual treatment take
Lynge et al. BMC Cancer (2017) 17:897
place in hospitals, all contacts related to the screening
program will be recorded in the Danish Patient
Register. Data on screen-detected and interval breast
cancers are retrieved from the Danish Pathology
Register (Patobank), which records data on all
pathology specimens from Denmark. Opportunistic
screening is rare in Denmark [19], and data on mammography outside the program are not included in
the DKMS. Annual DKMS reports have been
published since 2010. However, due to updates and
correction of data files reported numbers vary somewhat from one report to another. We have used data
from the reports from 2015 [20] and 2016 [21],
respectively. The DKMS data are published without
age-specification. This should, however, not affect the
results, as the age-distribution for women aged 50–69 years
varies for each 5-year age-group by only +/−1% across the
five Danish regions [22].
Page 3 of 9
women with invasive breast cancer 6–23 months after a
positive screen would be counted both as interval cancers and as false-positives, but it was not possible from
the published data to separate out this very small group.
The screen-detection rate was: ((women with screendetected invasive cancer + DCIS)/screened women). The
false-positive rate: ((screen-positive women-(women with
screen-detected invasive cancer + DCIS))/screened women).
Interval cancer rate was: (Interval cancers/(interval cancers
+ screen-detected invasive cancer + DCIS)). Sensitivity was:
(Screen-detected cancer/(Screen-detected cancer + interval
cancers)). Specificity was: ((Screened women-(Screen-detected cancer + interval cancers)-(false-positive))/(Screened
women-(Screen-detected cancer + interval cancers)). The
cumulative false-positive risk after four rounds of screening
as calculated as [1-(1-fp1)(1-fp2)(1-fp3)(1-fp4)], where fpi
was the false-positive rate in a given invitation round [23].
95% confidence intervals (CI) were calculated under the
assumption of a binomial distribution of the numerator.
Statistics
The target population for screening is defined as women
aged 50–69 years and living in a given region at the start
of an invitation round; in practice these dates have been
defined as 1 January 2008 for first, 2010 for second,
2012 for third, and 2014 for fourth round. Invited to
screening are women aged 50–69 years defined in running age during the invitation round meaning that
women start to be invited when they turn 50 years and
end being invited when they turn 70 years. The open
population of invited women could thus be larger than
the target population. Some invitation rounds furthermore lasted longer than 24 months, Additional file 1:
Table S1. However, in some rounds in the Southern
Denmark and the Capital regions women who had not
responded to three previous invitations or reminders
were excluded from invitation in the following invitation
round. Here we report coverage by examination
calculated as number of screened women divided by the
target population, and participation after invitation as
number of screened women divided by the number of
invited women.
Screened women with abnormal findings (positive
screens) were referred for assessment, while women with
normal findings (negative screens) were returned to routine screening. A screen-detected cancer was defined as
a woman with a positive screen and diagnosed with invasive breast cancer or ductal carcinoma in situ (DCIS)
within the next 6 months. Interval cancer was defined as
invasive breast cancer diagnosed in women with negative
screen within 24 months of the screening date (or before
next screen), and in women with positive screen within
6–23 months of the sceening date. A false-positive
screen was a women with a positive screen and no
screen-detected cancer. The very small number of
Ethics
All data in this paper were quoted from publicly
available databases.
Results
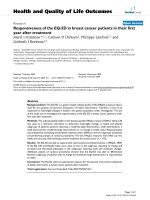
Coverage by examination has remained stable at 75–77%
throughout the first four rounds of the Danish screening
mammography program, Table 1. While most of the regions had a coverage by examination fluctuating around
the national average, the Capital Region was systematically below the average, being 68.0% (95% CI, 67.8–68.2)
at its lowest in the second invitation round 2010–2011,
Additional file 2: Table S2, Fig. 1. Participation after
invitation was 77–84%.
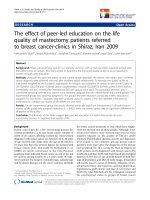
The detection rate was 0.93% in the first invitation
round which for the majority of screened women was
the prevalence screen, and the detection rate fluctuated
between 0.61 and 0.67% the the next three invitations
rounds. There was limited regional difference in the detection rate during the first round. However, in the third
round the Capital Region had a detection rate of 0.77%
(95% CI, 0.73–0.82), and considerable variation was seen
in the detection rate in Region Zealand from 0.69% in
the third round to 0.53% (95% CI, 0.48–0.58) in the
fourth round, Fig. 2. The proportion of DCIS out of all
screen-detected cases was stable over time being 13% in
the first invitation round and 14% in the fourth. The regional variations were limited apart from fluctuations
over time the in the small North Denmark Region. At
the national level, the false-positive rate was fairly stable
varying from 1.88% (95% CI, 1.84–1.92) to 2.08% (95%
CI, 2.04–2.12) between rounds, Table 1. Region North
Denmark was, however, systematically above the other
regions, with false-positive rates varying from 2.7% (95%
Lynge et al. BMC Cancer (2017) 17:897
Page 4 of 9
Table 1 Overview of performance indicators in screening mammography in Denmark 2008–2015
Performance indicator
Invitation round
First 2008–2009%
Second 2010–2011%
Third 2012–2013%
Fourth 2014–2015%
Coverage of examination
75.4 (75.3–75.5)
75.0 (74.8–75.1)
76.7 (76.6–76.8)
76.4 (76.3–76.5)
Participation after invitation
76.4 (76.3–76.5)
81.8 (81.7–81.9)
84.3 (84.3–84.4)
82.1 (82.0–82.2)
Detection rate
0.93 (0.91–0.96)
0.62 (0.60–0.64)
0.67 (0.65–0.69)
0.61 (0.59–0.64)
False-positive rate
2.04 (2.00–2.08)
2.08 (2.04–2.12)
2.07 (2.03–2.11)
1.88 (1.84–1.92)
Invasive
87.5 (86.5–88.4)
86.3 (85.0–87.5)
86.4 (85.2–87.4)
85.8 (84.5–86.9)
DCIS
12.6 (11.6–13.5)
13.7 (12.5–15.0)
13.6 (12.6–14.8)
14.2 (13.1–15.5)
Lymph node neg
69.8 (68.4–71.2)
74.5 (72.8–76.2)
78.2 (76.7–79.6)
80.4 (78.8–81.8)
Small tumor
36.1 (34.4–37.8)
40.1 (38.2–42.1)
39.8 (38.0–41.5)
40.1 (38.3–42.0)
Interval cancer rate
17.9 (16.9–19.1)
28.9 (27.3–30.5)
26.3 (24.9–27.8)
NA
Sensitivity
82.1 (81.1–83.1)
71.2 (69.8–72.5)
73.7 (72.5–74.8)
NA
Specificity
97.9 (97.9–98.0)
97.9 (97.9–97.9)
97.9 (97.9–98.0)
NA
Notes:
NA not available
Percent and 95% confidence intervals
CI, 2.6–2.9) to 3.2% (95% CI, 3.0–3.3), Additional file 3:
Table S3.
At the national level, invasive breast cancer as proportion of screen-detected cancers remained at 86–87%
throughout the four rounds, Table 1, but during the first
round there was a variation from 96% (95% CI, 93–97)
in North Denmark to 85% (95% CI, 83–87) in South
Denmark; a variation that diminished over time,
Additional file 3: Table S3. As expected, the proportions
of lymph node negative and small cancers were lower in
Fig. 1 Coverage in screening mammography in Denmark 2008–2015
by invitation round and region. Percent and 95% confidence intervals.
Notes: 1 South Denmark omitted in 1st round because only 70% of
target population was invited. 2 Zealand omitted in 2nd round
because the round was stopped before time to synchronize time
periods across regions
the first round than later; 70% (95% CI, 68–71) and 36%
(95% CI, 34–39), respectively. These proportions had
increased to 80% (95% CI, 79–82) and 40% (95% CI,38–42),
respectively, in the fourth round, Additional file 4: Table S4.
As the first round was the prevalence screen for most
women, the interval cancer rate at the national level was
low, 18% (1032/(4724 + 1023), and the sensitivity was
high, 82% (100–18%), Table 1. In the second and third
rounds these numbers had changed to 26–29% and 71–74%,
respectively. The specificity remained at 98% throughout the
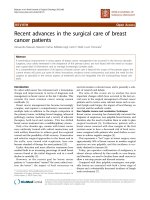
three rounds. There was, however, some variation across
regions in sensitivity and specificity. The North Denmark
Region had systematically lower specificity than the other
Fig. 2 Detection rate in screening mammography in Denmark
2008–2015 by region and invitation round. Percent and 95%
confidence intervals
Lynge et al. BMC Cancer (2017) 17:897
regions. In the third invitation round, the specificity in the
North Denmark Region was 97.0% (95% CI 96.9–97.1) as
compared with 97.9% (95% CI 97.7–98.0) for all of
Denmark, Additional file 5: Table S5. The outlier position of
the North Denmark region is illustrated in Fig. 3.
Discussion
Main findings
Three quarters of Danish women followed the screening
mammography program. Slightly below 1% of these
women had a breast cancer (invasive or DCIS) detected
at their first screen, and around 0.6% in subsequent
screens. The proportion of DCIS remained constant 13–
14% during the four invitation rounds; and in subsequent rounds 75–80% of the screen-detected invasive
breast cancers were lymph node negative and 40% had a
diameter equal to or below 10 mm. The screening program thus detected mainly invasive, lymph-node negative breast cancers with a high proportion of small
cancers.
The false-positive rate remained around 2%, indicating
that only a very small proportion of screened women
underwent assessment without having breast cancer. On
the other hand in subsequent rounds, a negative screen
was no guarantee against breast cancer developing
shortly after or having been overlooked in the first place.
Three out of 10 breast cancers in screened women were
diagnosed as interval cancers.
However, some regional differences were seen even in
this population with only a total of 700,000 screen-
Page 5 of 9
targeted women. As seen in other urban settings [24],
the coverage was relatively low in the Capital Region.
This was in particular the case in the second round,
where the coverage was 68% in the Capital Region as
compared to the national average of 75%. The second
round coincided with the publication of a study that
claimed that screening lead to heavy overdiagnosis, and
that one third of breasts were removed without reason
[25]. Women in the Capital Region may have been more
sensitive than other women to negative messages
reported in the media. It is noteworthy that coverage in
the Capital Region in the third and fourth rounds were
back to the higher level from the first round.
The detection rate was surprisingly high in the Capital
Region in the third round, 0.77% versus the national
average of 0.67%. This was probably due a longer time
interval between screens; the third invitation round
lasted 28 months, and some women screened in the
third round had skipped screening in the second round.
In Region Zealand the detection rate fluctuated over
time, in contrast to the situation in the other regions.
Worrisome was the low detection rate of 0.53% in the
third round where the national average was 0.61%. One
possible explanation could be that the detection rate was
high in the third round and that the prevalent pool of
breast cancers was depleted at that time. But this should
then have been followed by a high sensitivity which was
not the case, Additional file 4: Table S4. The region has
suffered from shortage of experienced radiologists. It
remains to be seen what the sensitivity will be in Region
Zealand after the fourth round.
The proportion of women with a false-positive screen
was higher in the North Denmark Region than in
Denmark on average; the cumulative risk being 11.4% as
compared with the average of 7.9%. The region also had
a conservative diagnostic practice, as both the detection
rates and the proportion of DCIS were generally in the
low end of the spectrum.
Strengths and weaknesses
Fig. 3 Sensitivity versus 1-specificity in screening mammography in
Denmark 2015 by region and invitation round
The DKMS data are nationwide and based on individually registered events. Several circumstances have, however, complicated the reporting. First, Denmark does not
have a national invitation database. In order to follow
the fate of an individual woman, data from the regional
booking systems have to be linked with data from the
Danish Patient Register and the Patobank; and these
matches were not always perfect. It is though unlikely
that this would have affected the results; e g. in the first
invitation round a total of 509,932 women were screened
and results were missing for only 88 of these women.
Second, an invitation round should ideally have a length
of 24 months. But due to lack of manpower this has not
always been possible, and even the fourth round lasted
Lynge et al. BMC Cancer (2017) 17:897
27 months in 3 of the 5 regions. This led to problems
with allocation of data to the correct round; reflected in
changes in numbers from one annual DKMS report to
the next. For this reason only the latest updated data
were quoted in this paper.
Perspective for reduction in breast cancer mortality
Given the correlation observed in the randomised
controlled trial between favourable outcomes of the
short-term indicators and the later decline in breast
cancer mortality [10], one may ask whether the Danish
national program is on the right track. Here it might be
reasonably to compare with the outcomes of the two
pilot programs. There is, however, some confusion in
the literature about the impact of these two pilot programs on breast cancer mortality and overdiagnosis.
Before turning to a comparison with the present national
program, it is therefore necessary to understand these
seemingly contradictory results from the pilot programs.
The fact that two Danish administrative areas introduced
breast cancer screening up to 17 years before the rest of
Denmark constituted almost a “natural experiment”, and
this has provided the basis for several evaluations of the
effect of screening. Using individually linked cohort data
from the Copenhagen program, Olsen et al. [15] found that
breast cancer mortality in Copenhagen had decreased by
25% more than expected in the absence of screening; and
Njor et al. [26] found a decrease of 22% for the Funen program. Using routine breast cancer mortality data from fixed
age-groups, Jørgensen et al. [27] concluded that they “were
unable to detect any effect of the Danish screening programmes on breast cancer mortality”.
There is, however, explanations for these seemingly
contradictory results. First, the routine data used by
Jørgensen et al. included breast cancer deaths from
women diagnosed with breast cancer prior to the start of
the screening program, and these women had no chance
to benefit from screening. Olsen et al. used incidencebased mortality including only deaths from breast cancer
in women diagnosed after the start of the screening program, and thus having had a chance to benefit from
screening. Second, Jørgensen et al. looked only at average
annual change in the trends of breast cancer mortality before and after start of screening. They left out observations
from the first 7 years after start of the screening programs,
and thus ignored changes in breast cancer mortality during this period. In fact, a recalculation of the data reported
by Jørgensen et al. showed a decline of 13% in breast cancer mortality in the screening areas as compared with the
decline in the non-screening areas [28]. Given that the
Jørgensen et al. data were contaminated with breast cancer deaths in women diagnosed prior to screening, this
13% decline is fairly much in line with the 22–25% decline
Page 6 of 9
observed by Olsen et al. and Njor et al. in the noncontaminated data.
Overdiagnosis has been studied also based on the early
Danish data. Using individually linked data from cohorts
of women offered screening and followed for a minimum of 8 years after end of screening age, Njor et al.
[29] estimated overdiagnosis to amount to 2.3%. Using
routine data from fixed age-groups, Jørgensen et al. [25, 30]
concluded that “1 in every 3 women aged 50 to 69 years
diagnosed with breast cancer was overdiagnosed”. However,
screening introduces a dynamic in the incidence of breast
cancer with a prevalence peak, an artificial aging, and a
compensatory dip [31, 32]. This dynamic is captured
correctly only by following the cohorts of screened women.
With the method used by Jørgensen et al., they were unable
to capture the compensatory dip correctly. Jørgensen et al.,
furthermore measured differences instead of proportions,
and thus inflated their estimate of overdiagnosis by
geographical differences in breast cancer incidence prior to
the introduction of screening [33].
The differences between the study approaches used by
Olsen et al. and Njor et al. and the one used by Jørgensen
et al. stress the superiority of using individually linked cohort data as opposed to routine statistics data in evaluation
of screening outcomes. The most accurate estimate of the
decline in breast cancer mortality in the pilot programs is
therefore 25% for Copenhagen and 22% for Funen. The
short-term indicators from the first four invitation rounds
of the two Danish pilot programs in the municipality of
Copenhagen ([12, 34] + unpublished material) and the
county of Funen ([13, 34] + unpublished data) are summarized in Table 2.
Table 2 Coverage, interval cancer and false positive rates
during the first four invitation rounds of the Danish pioneer
screening mammography programs in the municipality of
Copenhagen (1991–1998) and the county of Funen (1994–2001)
Invitation round
First %
Second %
Third %
Fourth %
Coverage by
examination
71 (70–71)
63 (63–64)
63 (62–63)
63 (63–64)
Interval cancer
rate
14 (11–17)
28 (23–35)
27 (22–34)
33 (27–39)
False positive
rate
5.5 (5.2–5.7) 3.9 (3.6–4.1) 2.5 (2.3–2.7) 2.4 (2.2–2.6)
Copenhagen
Funen
Coverage by
examination
85 (84–85)
83 (83–84)
82 (82–83)
84 (84–84)
Interval cancer
rate
18 (15–22)
34 (30–39)
39 (34–44)
32 (28–37)
False positive
rate
1.7 (1.6–1.9) 1.1 (1.0–1.2) 1.1 (1.0–1.2) 1.0 (0.9–1.1)
Percent and 95% confidence intervals
Lynge et al. BMC Cancer (2017) 17:897
Page 7 of 9
Fig. 4 Coverage by examination, interval cancers rate and false positive rate in the first four invitation rounds of the pilot screening programs in
Copenhagen and Funen and in the Danish national program. Percent and 95% confidence interval.
In the randomised controlled trials a low interval cancer rate, a high screen-detection rate, a low proportion
of stage II+ tumors, and a high proportion of small tumors were predictors of a later decline in breast cancer
mortality [10]. At the population level one might add
coverage by examination to this list of predictors.
Copenhagen had a lower interval cancer rate than Funen
during the first three rounds, which can probably explain why screened women in Copenhagen had a larger
decrease in breast cancer mortality than screened
women from Funen. Funen on the other had higher
coverage by examination, and the two pioneer programs
ended up with largely similar decreases in breast cancer
mortality for screen-targeted women. It should be
taken into account that breast cancer patients in
Funen already prior to the implementation of screening had a better survival then breast cancer patients
in the rest of Denmark [35], and that the Funen
program deliberately aimed for a lower false positive
rate than found in the start of the Copenhagen program, Table 2.
In the first four invitation rounds of the national program, the coverage by examination has been almost at the
average of the coverage by examination in the pilot programs, Fig. 4. During the first three invitation rounds the
interval cancer rate has been in line with the rate observed
in the Copenhagen program. This means that the national
program has both avoided the low coverage by examination in the pilot Copenhagen program and the high interval cancer rate in the pilot Funen program. On this basis
one might expect that the national program will also result in a reduction in breast cancer mortality. Thorough
cohort studies on incidence-based mortality are needed in
order to investigate this. Women in the national program
paid a price in terms of false-positive screens exceeding
the low level in the pilot program in Funen.
Furthermore, as the majority of screen-detected
breast cancers are node negative, Additional file 4:
Table S4, women are spared axillary dissection. Given
that 40% of screen detected tumors were ≤10 mm
and that 80% were lymph node negative, a significant
proportion of screen-detected tumors are expected to
be low risk not in need of chemotherapy, but the
DKMS data are too sparse on tumor biology to estimate the precise proportion.
Conclusion
Fulfillment of short-term quality indicators is a prerequisite for a screening mammography program to
achieve its purpose of reducing breast cancer mortality [10]. Our study showed that even within the small
Danish population the variations in both screendetection and false-positives rates were surprisingly
large but all regions are working quite well in accordance with European and national guidelines. Screening mammography is a delicate balance between
benefits and harms [36], and the Danish experiences
illustrate the importance of close monitoring of shortterm quality indicators.
Additional files
Additional file 1: Table S1. Date of start and foreseen date of end of
invitations rounds by region and length (in months) of invitation round.
(DOCX 12 kb)
Additional file 2: Table S2. Number of women in target population,
invited women and screened women by invitation round and region in
screening mammography, Denmark 2008–2015. (DOCX 15 kb)
Additional file 3: Table S3. Number of screened women, recalled
women, screen-detected breast cancers (incl. DCIS) and women with
false positive screen by invitation round and region in screening
mammography in Denmark, 2008–2015. (DOCX 15 kb)
Additional file 4: Table S4. Number of screen-detected cancers (Invasive
+ DCIS), screen-detected cancers (invasive only) and interval cancers (invasive
only) by invitation round and region in screening mammography in Denmark
2008–2015. (DOCX 15 kb)
Additional file 5: Table S5. Number of screened women, screen-detected
cancers (invasive + DCIS) interval cancers and women with false positive
screens by invitations round and region in screening mammography in
Denmark 2008–2015. (DOCX 15 kb)
Lynge et al. BMC Cancer (2017) 17:897
Acknowledgements
None.
Page 8 of 9
2.
Funding
This study was financially supported by Kirsten and Freddy Johansen’s Fund.
3.
Availability of data and materials
The datasets used and analysed during the current study are available from
publicly available data sources:
4.
1) Dansk Kvalitetsdatabase for Brystkræftscreening. [Danish Quality
database for breast cancer screening. Annual report 2015], Denmark,
2015. (in Danish). />2) Dansk Kvalitetsdatabase for Brystkræftscreening. [Danish Quality
database for breast cancer screening. Annual report 2016], Denmark,
2016. (in Danish). />4678_dkms-rapport-2016-7-version.pdf
Authors’ contributions
EL designed and drafted paper. EL and MvEC independently retrieved and
checked all data. AL, NBM, WS, AW, IV contributed with expertise concerning
the mammography, MB contributed with expertise concerning the
pathology outcome, NK and IV contributed with expertise concerning the
background information and details concerning the screening organization.
All authors contributed with input to two rounds of revision of the
manuscript. All authors approved the final version of the manuscript.
Ethics approval and consent to participate
Data for this study were downloaded from public data sources available in
the format of tables. Use of such tables does not require ethical approval
and/or participant consent.
Consent for publication
Not applicable.
Competing interests
The authors declare that they have no competing interests.
Publisher’s Note
5.
6.
7.
8.
9.
10.
11.
12.
13.
14.
Springer Nature remains neutral with regard to jurisdictional claims in
published maps and institutional affiliations.
15.
Author details
1
Department of Public Health, University of Copenhagen, Øster
Farimagsgade 5, 1014 Copenhagen, Denmark. 2Department of Pathology,
Odense University Hospital, J. B. Winsløws Vej 15, 5000 Odense, Denmark.
3
Department of Public Health, University of Copenhagen, Øster
Farimagsgade 5, 1014 Copenhagen, Denmark. 4Department of Breast
Surgery, Copenhagen University Hospital Herlev, Blegdamsvej 9, 2100
Copenhagen, Denmark. 5Department of Public Health Programmes, Randers
Regional Hospital, Skovlyvej 15, 8930 Randers NØ, Denmark. 6Radiology
Department, Ringsted Hospital, Bøllingsvej 30, 4100 Ringsted, Denmark.
7
Mammography Centre, Odense University Hospital, J. B. Winsløws Vej 15,
5000 Odense, Denmark. 8Radiology Department, Aalborg Univeristy Hospital,
Hobrovej 18-22, 9000 Aalborg, Denmark. 9Radiology Department,
Copenhagen University Hospital Rigshospitalet, Blegdamsvej 9, 2200
Copenhagen, Denmark.
16.
17.
18.
19.
20.
21.
22.
23.
Received: 3 August 2017 Accepted: 18 December 2017
24.
References
1. Engholm G, Ferlay J, Christensen N, Kejs AMT, Hertzum-Larsen R,
Johannesen TB, Khan S, Leinonen MK, Ólafsdóttir E, Petersen T, Schmidt
LKH, Trykker H, Storm HH. NORDCAN: Cancer Incidence, Mortality,
Prevalence and Survival in the Nordic Countries, Version 7.3 (08.07.2016).
Association of the Nordic Cancer Registries. Danish Cancer Society. Available
from. [Accessed on 4 May 2017].
25.
26.
Onland-Moret NC, Peeters PHM, van Gills CH, Clavel-Chapelon F, Key T,
Tjønneland A, Trichopoulou A, Kaaks R, Manjer J, Panico S, Palli D, Teherd B,
Stoikidao M, Bueno-deMesquita HB, Boeing H, Overvad K, Lenner P, Quirós
JR, Chirlaque MD, Miller AB, Khaw KT, Riboli E. Age at menarche in relation
to adult height. Am J Epidemiol. 2005;162:623–32.
Nielsen NM, Harpsøe M, Simonsen J, Stenager E, Magyari M, Koch-Henriksen
N, Baker JL, Hjalgrim H, Frisch M, Bager P. Age at menarch and risk of
multiple sclerosis: a prespoctive cohort study based in the Danish national
birth cohort. Am J Epidemiol. 2017;185:712–9.
Danmarks Statistik. [Population development 2015]. København: Danmarks
Statistik, 2016. (in Danish).
Hoffmann K, de Gelder R, Hu Y, Bopp M, Vitrai J, Lahelma E, Menvielle G,
Santana P, Regidor E, Ekholm O, Mackenbach JP, van Lenthe FJ. Trends in
educational inequalities in obesity in 15 European countries between 1990
and 2010. Int J Behaviour Nutr. 2017;14:63. doi: 10.1186/s12966-017-0517-8.
Rostgaard K, Væth M, Rootzén H, et al. Why did the breast cancer lymph
node status distribution improve in Denmark in the pre-mammography
screening period of 1978–1994? Acta Oncol. 2010;49:313–21.
Nyström L, Rutqvist LE, Wall S, Lindgren A, Lindqvist M, Rydén S, Andersson
I, Bjurstam N, Fagerberg G, Frisell J, et al. Breast cancer screening with
mammography: overview of Swedish randomised trials. Lancet. 1993;341:
973–8. Erratum in: Lancet 1993;342:1372
Council recommendation of 2 December 2003 on cancer screening (2003/
878/EC). Off J Eur Union L327/34, 16.12.2003.
Marmot MG, Altman DG, Cameron DA, Dewar JA, Thompson SG, Wilcox M,
The Independent UK Panel on Breast Cancer Screening. Thebenefits and
hars oif breast cnacer screening: an independent review. Br J Cancer. 2013;
108:2205–40.
Day NE, Williams DR, Khaw KT. Breast cancer screening programmes: the
development of a monitoring and evaluation system. Br J Cancer. 1989;59:4–8.
Perry N, Broeders M, de Wolf C, Törnberg S, Holland R, von Karsa L. (Eds).
European guidelines for quality assurance in breast cancer screening and
diagnosis. Fourth edition. Luxembourg: office for Offocial Publications of the
European Comminities, 2006.
Lynge E. Mammography screening for breast cancer in Copenhagen April
1991-march 1997. APMIS. 1998;106(Suppl 83):1–44.
Njor SH, Olsen AH, Bellstrøm T, Dyreborg U, Bak M, Axelsson C, Graversen
HP, Schwartz W, Lynge E. Mammography screening in the county of Fyn
November 1993-December 1999. APMIS. 2003;111(Suppl 110):1–33.
Lov om ændring af lov om sygehusvæsenet (Tilbud om brystundersøgelse
af kvinder mellem 50 og 69 år). Vedtaget af Folketinget 17. December 1999.
(in Danish).
Olsen AH, Njor SH, Vejborg I, et al. Breast cancer mortality in
Copenhagen after introduction of mammography screening: cohort
study. BMJ. 2005;330:220.
Bekendtgørelse om ikrafttræden af § 85, stk.1–3 i sundhedsloven om
brystundersøgelse. 28. November 2008. (in Danish).
Vejborg I, Mikkelsen E, Garne JP, Bak M, Lernevall A, Mogensen NB, Schwartz
W, Lynge E. Mammography screening in Denmark. Clinical guidelines. Dan
Med Bull. 2011;58(6):C4287.
Mikkelsen EM, Njor SH, Vejborg I. Danish quality database on
mammography screening. Clin Epidemiol. 2016;8:661–6.
Jensen A, Olsen AH, von Euler-Chelpin M, et al. Do nonattenders in
mammography screening programmes seek mammography elsewhere? Int
J Cancer. 2005;113:464–70.
Dansk Kvalitetsdatabase for Brystkræftscreening. [Danish Quality database for
breast cancer screening. Annual report 2015], Denmark, 2015. (in Danish).
Dansk Kvalitetsdatabase for Brystkræftscreening. [Danish Quality database for
breast cancer screening. Annual report 2016], Denmark, 2016. (in Danish).
Statistics Denmark. www.statistikbanken.dk/FOLK1A. Accessed 23 Oct 2017.
Njor SH, Olsen AH, Schwartz W, Vejborg I, Lynge E. Predicting the risk of a
false- positive test for women following a mammography screening
programme. J Med Screen. 2007;14:94–7.
Lynge E, Olsen AH, Fracheboud J, Patnick J. Reporting of performance
indicators of mammography screening in Europe. Eur J Cancer Prev. 2003;
12:213–22. Review
Jørgensen KJ, Zahl P-H, Gøtzsche PC. Overdiagnosis in organised
mammography screening in Denmark. A comparative study. BMC Womens
Health. 2009;9:36. doi:10.1186/1472-6874-9-36.
Njor SH, Schwartz W, Blichert-Toft M, et al. Decline in breast cancer mortality:
how much is attributable to screening? J Med Screen. 2015;22:20–7.
Lynge et al. BMC Cancer (2017) 17:897
Page 9 of 9
27. Jørgensen KJ, Zahl P-H, Gøtzsche PC. Breast cancer mortality in
organised mammography screening in Denmark: comparative study.
BMJ. 2010;340:c1241.
28. Olsen AH, Njor S, Lynge E. />re-j%C3%B8rgensen-et-al-breast-cancer-mortality-organised-mammographyscreening. Accessed 10 Mar 2014.
29. Njor SH, Olsen AH, Blichert-Toft M, Schwartz W, Vejborg I, Lynge E.
Overdiagnosis in screening mammography in Denmark: population based
cohort study. BMJ. 2013;346:f1064.
30. Jørgensen KJ, Gøtzsche PC, Kalager M, Zahl P-H. Breast cancer screening in
Denmark: a cohort study of tumor size and Overdiagnosis. Ann Intern Med.
2017;166:313. doi:10.7326/M16-0270.
31. Boer R, Warmerdam P, de Koning H, van Oortmarssen G. Extra incidence
caused by mammographic screening. Lancet. 1994;343:979. />10.1016/S0140-6736(94)90105-8.
32. Møller B, Weedon-Fekjaer H, Hakulinen T, Tryggvadóttir L, Storm HH, Talbäck
M, et al. The influence of mammographic screening on national trends in
breast cancer incidence. Eur J Cancer Prev. 2005;14:117–28.
33. Lynge E, Beau AB, Christiansen P, von Euler-Chelpin M, Kroman N, Njor S,
Vejborg I. Overdiagnosis in breast cancer screening: the impact of study
design and calculations. Eur Cancer ;80:26–29. doi: 10.1016/j.ejca.2017.04.
018. Epub 2017 ay 20.
34. Jacobsen KK, Abraham L, Buist DSM, Hubbard RA, O’Meara ES, Sprague BL,
Kerlikowske K, Vejborg I, von Euler-Chelpin M, Njor SH. Comparison of
cumulative false-positive risk of screening mammography in the United
States and Denmark. Cancer Epidemiol. 2015;39:656–63.
35. Grabau DA, Jensen M-B, Blichert-Toft M, Andersen JA, Dyreborg U,
Carstensen B, Al-Suliman NN, Graversen HP, Rose C. The importante of
surgery and accurate axillary staging for survival in breast cancer. Eur J Surg
Oncol. 1998;24:499–507.
36. Beau AB, Lynge E, Njor SH, Vejborg I, Lophaven S. Benefit-to-harm ratio of
the Danish breast cancer screening programme. Int J Cancer 2017 May 3.
doi: 10.1002/ijc.30758. [Epub ahead of print] May 3. doi: 10.1002/ijc.30758.
[Epub ahead of print].
Submit your next manuscript to BioMed Central
and we will help you at every step:
• We accept pre-submission inquiries
• Our selector tool helps you to find the most relevant journal
• We provide round the clock customer support
• Convenient online submission
• Thorough peer review
• Inclusion in PubMed and all major indexing services
• Maximum visibility for your research
Submit your manuscript at
www.biomedcentral.com/submit