The potential predictive value of DEK expression for neoadjuvant chemoradiotherapy response in locally advanced rectal cancer
Bạn đang xem bản rút gọn của tài liệu. Xem và tải ngay bản đầy đủ của tài liệu tại đây (3.45 MB, 11 trang )
Martinez-Useros et al. BMC Cancer (2018) 18:144
DOI 10.1186/s12885-018-4048-8
RESEARCH ARTICLE
Open Access
The potential predictive value of DEK
expression for neoadjuvant
chemoradiotherapy response in locally
advanced rectal cancer
J. Martinez-Useros1*, I. Moreno1, M. J. Fernandez-Aceñero2, M. Rodriguez-Remirez1, A. Borrero-Palacios1, A. Cebrian1,
T. Gomez del Pulgar1, L. del Puerto-Nevado1, W. Li1, A. Puime-Otin3, N. Perez3, M. S. Soengas4 and J. Garcia-Foncillas1*
Abstract
Background: Limited data are available regarding the ability of biomarkers to predict complete pathological response
to neoadjuvant chemoradiotherapy in locally advanced rectal cancer. Complete response translates to better patient
survival. DEK is a transcription factor involved not only in development and progression of different types of cancer,
but is also associated with treatment response. This study aims to analyze the role of DEK in complete pathological
response following chemoradiotherapy for locally advanced rectal cancer.
Methods: Pre-treated tumour samples from 74 locally advanced rectal-cancer patients who received chemoradiation
therapy prior to total mesorectal excision were recruited for construction of a tissue microarray. DEK immunoreactivity
from all samples was quantified by immunohistochemistry. Then, association between positive stained tumour cells
and pathologic response to neoadjuvant treatment was measured to determine optimal predictive power.
Results: DEK expression was limited to tumour cells located in the rectum. Interestingly, high percentage of tumour
cells with DEK positiveness was statistically associated with complete pathological response to neoadjuvant treatment
based on radiotherapy and fluoropyrimidine-based chemotherapy and a marked trend toward significance between
DEK positiveness and absence of treatment toxicity. Further analysis revealed an association between DEK and the
pro-apoptotic factor P38 in the pre-treated rectal cancer biopsies.
Conclusions: These data suggest DEK as a potential biomarker of complete pathological response to treatment in
locally advanced rectal cancer.
Keywords: DEK, Chemoradiotherapy, Neoadjuvant treatment, Rectal cancer, Predictive biomarker, Complete
pathological response
Background
Colorectal cancer is one of the most common gastrointestinal malignant tumours in the world and has one of the
highest rates of morbidity and mortality worldwide. It is
not only the third most common malignancy in United
States but also the third leading cause of cancer-related
deaths [1]. Rectal cancer accounts for between 27% and
* Correspondence: ; ;
1
Translational Oncology Division, OncoHealth Institute, Health Research
Institute - University Hospital “Fundación Jiménez Díaz”-UAM, Av. Reyes
Católicos 2, 28040 Madrid, Spain
Full list of author information is available at the end of the article
58% of all cases of colorectal cancer, with variations attributable to the cancer registry studied and the method used
to classify rectosigmoid tumours [2]. Of the 304,930 new
cases of digestive-tract cancer diagnosed in 2016 in the
United States, 39,220 were rectal, with higher incidence
seen among males than females (23,110 vs. 16,110) [1].
Further information about the global incidence of rectal
cancer can be obtained from the World Health
Organization (WHO)-GLOBOCAN [3, 4].
A distinction must be made between rectal and colon
carcinoma, as rectal cancer has a distinct dissemination
pattern. Furthermore, surgical resection is the mainstay
© The Author(s). 2018 Open Access This article is distributed under the terms of the Creative Commons Attribution 4.0
International License ( which permits unrestricted use, distribution, and
reproduction in any medium, provided you give appropriate credit to the original author(s) and the source, provide a link to
the Creative Commons license, and indicate if changes were made. The Creative Commons Public Domain Dedication waiver
( applies to the data made available in this article, unless otherwise stated.
Martinez-Useros et al. BMC Cancer (2018) 18:144
of curative treatment for rectal adenocarcinomas [5].
Colon carcinoma is located in the peritoneal cavity, an
area that is highly accessible and facilitates surgical
intervention with wide resection margins. In contrast,
rectal cancer is located extraperitoneally, within the pelvis, thus it makes harder the surgical resection that in
most of cases involve low anterior or abdominoperineal
resection. Some rectal tumours are superficial (T0/T1)
and small enough (< 3 cm) to be successfully resected by
local excision. However, most patients have more deeply
invasive tumours that are adherent or fixed to adjoining
structures (e.g., sacrum, pelvic sidewalls, prostate, or
bladder) that requires more extensive resection [6].
Rectal tumours tend toward local recurrence, and surgery alone only provides a high cure rate for patients
with early-stage disease [7]. In fact, the five-year survival
rate for patients with stage I tumours is around 80 to
90%, while this rate is below 80 for those with stage II or
III disease [8].
To increase long-term survival, the Swedish Study
Group has introduced neoadjuvant treatment for locally
advanced tumours based on chemotherapy combined
with radiation [9]. The effects of chemoradiotherapy are
the results of DNA damage produced directly by ionizing radiations; or indirectly, by the action of chemical
radicals generated from ionization [10]. Chemoradiotherapy improves survival rates and local recurrence by
reducing tumour size and stage, and also has the ability
to achieve pathologic downstaging [11, 12]. For these
reasons, neoadjuvant chemotherapy is the standard of
care for stage II–III rectal tumours, not only to increase
the effectiveness of radiotherapy but also to attain negative surgical margins [13] and enhance the possibility for
sphincter-preserving surgery [14]. As described by Ryan
et al., tumour regression grade is a useful method of
scoring pathologic response to chemoradiotherapy in
rectal carcinomas [15]. However, complete pathological
response has been reported in only 10% to 30% of patients, and around 40% show partial or no response [16].
To predict response to neoadjuvant treatment, translational research has focused on the search for potential biomarkers of response to preoperative treatment [17–19].
DEK was identified fusioned with the CAN nucleoporin due to the translocation t (6;9) in a subtype of
acute myeloid leukemia [20]. DEK is overexpressed in
multiple neoplasms, including bladder cancer [21],
breast cancer [22], glioblastoma [23], hepatocellular carcinoma [24], melanoma [25], retinoblastoma [26, 27],
and other types, such as oral, ovarian, or uterine-cervical
cancer [28–31].
Functionally, DEK is involved in the DNA damage repair machinery from the interaction with PARP-1 [32],
suppresses apoptosis, senescence, differentiation, and
promotes cell transformation both in vitro and in vivo
Page 2 of 11
[33–35]. Our group has previously associated DEK
expression with adjuvant-treatment response in colorectal cancer [36]. Here, we observed a significant increase in apoptotic cells after the combination of
irinotecan treatment and DEK knock-down, compared
to those treated with irinotecan or DEK knock-down
individually. However, this effect was not observed
with 5FU or oxaliplatin treatments alone or in combination with DEK knock-down [36].
DEK has also been described to have a high statistical
power to predict pathological complete response for
neoadjuvant chemotherapy in breast cancer [37].
Therefore, our hypothesis to link DEK with neoadjuvant therapy in rectal cancer has been based on the
above-mentioned reports that associated DEK with treatment response.
This study aimed to explore the precise role of DEK as a
novel biomarker of pathologic response in rectal
adenocarcinoma. To achieve this, 74 biopsies obtained
from pre-treated locally advanced rectal-adenocarcinoma
patients were immunostained with DEK. Association with
neoadjuvant chemoradiotherapy response was assessed in
light of these findings.
Methods
Patient samples
The follow-up of 91 consecutive patients with stage II or
stage III rectal adenocarcinoma according to American
Joint Committee on Cancer [38] who underwent
standardized neoadjuvant chemoradiotherapy followed
by total mesorectal excision, from December 2006 to
January 2014, were reviewed for the study. However,
only those patients with available endoscopic biopsies
for immunohistochemical analysis were selected for this
study. A total of 74 patients with locally advanced rectal
adenocarcinoma, from General and Digestive-Tract
Surgery Department of University Hospital Fundación
Jiménez Díaz were assessed for eligibility.
Sixty-three percent of the rectal tumours included in
the study were determined to be of a high grade based
on the recommendations of the College of American
Pathologists [39]. Magnetic resonance imaging (MRI),
computed tomography, endorectal ultrasound, and/or
endoscopy revealed a high prevalence of stage III
tumours (93%). The criteria published by Ryan et al.
were applied to classify patients according to response
to neoadjuvant treatment [15]. According to this classification system, complete pathological response was
indicated by an absence of tumour cells; partial pathologic response by fibrosis with presence of isolated
tumour cells; and minimum pathologic response by
tumour nests outgrown by fibrosis or no tumour kill. Tand N-downstaging were also assessed. Radiotherapy
administered as neoadjuvant treatment was dosed over
Martinez-Useros et al. BMC Cancer (2018) 18:144
28 sessions (45 Gy to the pelvic area and 50.4 Gy to the
tumour area).
Tissue microarray
Samples from 74 patients were used to construct a
paraffin block containing 148 cores (2 cores per patient) to allow for immunohistochemistry analysis. A
hollow needle (MTA-1 tissue arrayer, Beecher Instruments, Sun Prairie, USA) was used to perform a
punch biopsy from pre-selected tumour areas in
paraffin-embedded (FFPE) tissues. These tissue cores
were then inserted in a recipient paraffin block. Sections from this FFPE block were cut using a microtome and mounted on a microscope slide to be
analyzed by immunohistochemistry.
Page 3 of 11
Table 1 Clinico-pathologic characteristics of rectal cancer patients
Characteristics
Patients (N = 74)
Median age-years (range)
72 (46–89)
> 60 years
60 (81%)
< 60 years
14 (19%)
Sex
Male
45 (61%)
Female
29 (39%)
ECOG
0
41 (55%)
1
31 (42%)
2
2 (3%)
Status
Death
Immunohistochemistry and quantification
Staining was conducted in 2-μm sections. Slides
were deparaffinized by incubation at 60 °C for
10 min and then incubated with PT-Link (Dako,
Denmark) for 20 min at 95 °C in a high pH-buffered
solution. To block endogenous peroxidase, holders
were incubated with peroxidase blocking reagent
(Dako, Denmark). Biopsies were stained for 20 min
with a 1:50 dilution of DEK antibody (610,948, BD
Biosciences) and with 1:150 of phospho-P38
(ab38238, Abcam) followed by incubation with antiIg horseradish peroxidase-conjugated polymer (EnVision, Dako, Denmark) to detect antigen-antibody
reaction. A single human normal rectum tissue was
used as a positive control for immunohistochemical
staining. Sections were then visualized with 3,3′-diaminobenzidine as the chromogen for 5 min and
counterstained with hematoxylin. Photographs were
taken with a stereo microscope (Leica DMi1,
Wetzlar, Germany). Immunoreactivity was quantified
by two independent pathologists as the percentage of
positive stained cells over the total number of
tumour cells. Positiveness was defined as medium to
high DEK expression levels according to The Human
Protein Atlas () and quantification of each biopsy was calculated using the
average of both cores.
Statistical analysis
The association between DEK expression (categorized as low or high percentage of positive stained
cells) and clinicopathologic variables, including
pathologic response, was evaluated by Fisher’s exact
or Chi-square (χ2) test. χ2 test was used to analyze
the relationship between DEK expression and
clinicopathologic parameters. Fisher’s exact test was
used when one or more variable had a frequency of
five or less. Association between phospho-P38
7 (10%)
Alive without disease
59 (78%)
Alive with disease
7 (10%)
N/A
1 (1%)
T Downstaging
0
28 (38%)
1
39 (53%)
N/A
7 (9%)
N Downstaging
0
20 (27%)
1
47 (64%)
N/A
7 (9%)
Grade
Low
19 (26%)
High
47 (63%)
N/A
8 (11%)
Stage
II
4 (6%)
III
69 (93%)
N/A
1 (1%)
Neoadjuvant Treatment
RT + Fluoropyrimidines based
73 (99%)
Other
1 (1%)
Treatment toxicity
Yes
30 (41%)
No
44 (59%)
Pathological Response
Complete
9 (12%)
Partial
27 (37%)
Minimun
38 (51%)
DEK
Low
26 (35%)
High
48 (65%)
N/A not available, RT Radiotherapy
Martinez-Useros et al. BMC Cancer (2018) 18:144
expression (categorized as low or high percentage of positive stained cells) with pathologic response was assessed
by Fisher’s exact test. Association between DEK and
phospho-P38 expression was analysed by χ2 test. P values
≤0.05 were considered significant. Analysis was performed
with the IBM SPSS program, version 20.0.
Results
Patient characteristics
The clinical features of the resected rectal-cancer
patients are summarized in Table 1. The median age of
Page 4 of 11
the patients was 72 years (range 46–89 years), and male
population has higher incidence (n = 45; 61%) with good
performance status (ECOG 0) (n = 41; 55%).
Neoadjuvant treatment was based on fluoropyrimidines (5FU or FOLFOX) and combined with radiotherapy was administered in 73 patients (99%). The
majority of patients did not present treatment toxicity (n = 44; 59%). Concerning pathological response,
complete response was achieved in 9 patients (12%)
and partial and minimum response in 27 patients
(37%), and 38 patients (51%) respectively.
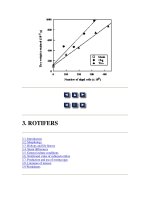
Fig. 1 Differential pattern of DEK positive stained cells of locally advanced rectal tumours. a and b representative images of tumour samples with
high percentage of DEK positive stained cells. c and d representative images of tumour samples with low percentage of DEK positive stained cells. Scale
bar is 50 μm. e Histogram of patient samples according to percentage of DEK positive tumour cells
Martinez-Useros et al. BMC Cancer (2018) 18:144
Page 5 of 11
High DEK expression associated with complete response
to neoadjuvant chemoradiotherapy
DEK expression associated with phospho-P38 expression
in pre-treated rectal cancer biopsies
Based on our previous reports [36], we hypothesized that
DEK could be related to neoadjuvant response and serve
as a predictive biomarker in patients with rectal adenocarcinoma prior to surgery. For this purpose, a tissue
microarray was constructed and stained to quantify the
percentage of DEK positive cells over the total number
of tumour cells. All samples were obtained before the
patients received neoadjuvant treatment. After immunohistochemical staining, the biopsies were observed to
have nuclear localization and DEK stained only tumour
cells (Fig. 1a to d). Distribution of samples according to
the percentage of positive tumour cells staining showed
a uniform cumulative distribution (Fig. 1e). The biopsies
were then stratified into low or high DEK expression
using the mean percentage of positive stained tumor
cells as a cut-off point. The results showed that 9 (19%)
patients out of the 45 patients with high DEK expression
achieved a complete response to neoadjuvant treatment;
while none of those with low DEK expression obtained a
complete response. In fact, all patients who showed
complete response (n = 9) had high DEK expression.
Moreover, 82% of patients (n = 39) with high expression
achieved partial or minimal response, while all patients (n
= 26; 100%) with low DEK expression achieved partial or
none response (Table 2). Statistical analysis showed
significant differences between both groups of response to
neoadjuvant chemoradiotherapy (complete vs. partial or
minimal) and the low or high DEK expression (Chisquared: P = 0,018; Fisher’s exact: P = 0,023) (Table 2).
Further analysis revealed no statistical association between DEK expression and the rest of the clinicopathologic variables studied, including gender (P = 0.553), age
(P = 0.758), T-downstaging (P = 0.840), N-downstaging
(P = 0.626), grade (P = 0.312), ECOG (P = 0.843), status
(P = 0.544), tumour size (P = 0.703), and stage (P =
0.613). Concerning treatment toxicity, a considerable
trend was observed between high DEK expression and
the absence of treatment toxicity (P = 0.086) (Table 3).
P38 is an important component of the mitogen-activated
protein kinases (MAPK) [40] and plays a central role in
cell proliferation and apoptosis in multiple neoplasias
[41]. Furthermore, P38 has been recently associated to
chemotherapy response in colorectal cancer [42]. Therefore, we quantified the immunoreactivity of the active
form of P38 (phospho-P38) in all rectal cancers biopsies
by immunohistochemistry. Phospho-P38 expression was
then categorized as low or high according to median
percentage of positive stained tumor cells as cut-off
point. Although we did not find statistically significant
Table 2 Statistical association between neoadjuvant treatment
response and low- or high-percentage of DEK positive tumor cells
High
No. Complete (% of No. Partial or
P
P
DEK subpopulation) minimum (% of
(chi-square) (Fisher)
DEK subpopulation)
9
n = 48 (19%)
39
(82%)
0,018
Low
0
n = 26 (0%)
No Number of patients
DEK
Parameter
Low
High
Male
17
28
Female
9
20
Gender
26
(100%)
0,023
P
0.553
Age
0.758
< 60 years
4
10
> 60 years
22
38
No
10
18
Yes
13
26
T_Downstaging
0.840
N_Downstaging
0.626
No
6
14
Yes
17
30
Low
9
10
High
16
31
Grade
0.312
Treatment toxicity
0.086
Yes
14
16
No
12
32
0
14
27
1–2
12
21
ECOG
0.843
Status
Treatment Response
DEK
Table 3 Statistical association between low- or high-percentage of
DEK positive stained tumor cells and clinico-pathological parameters
0.544
Alive with disease or death
6
8
Alive without disease
20
40
< 3 cm
2
6
> 3 cm
24
41
Tumor size
0.703
Stage
0.613
II
2
2
III
24
45
Martinez-Useros et al. BMC Cancer (2018) 18:144
Page 6 of 11
association between phospho-P38 expression and pathological response to neoadjuvant treatment (P = 0.296;
data not shown), a direct association was found between
phospho-P38 and DEK expression (P = 0.027; Table 4).
In fact, seven patients of whom showed not only
complete response but also high DEK expression (n = 9)
revealed high expression of phospho-P38, while two
patients presented low phospho-P38 expression.
These results suggest that high DEK expression in
tumour biopsies could be used as a potential biomarker
of pathological response that follows neoadjuvant therapy in rectal cancer. Moreover, the association between
DEK and phospho-P38 expression supports and provides
a highly robust predictive model of cell-death revealed
by the complete response to neoadjuvant treatment.
Discussion
Neoadjuvant chemoradiotherapy is the standard care approach for stage II and III rectal-cancer patients. The
aim of this treatment is to achieve pathologic downstaging and complete response. Therefore, extensive investigation is currently being devoted to biomarkers that
predict response to neoadjuvant treatment. Genetic profiling platforms have become a useful tool for analyzing
DNA, RNA, and other factors that may or may not be
translated into protein, such as miRNA. In the era of
genomics, transcriptomics, and proteomics, these methodologies have helped elucidate potential biomarkers of
treatment response in rectal cancer [17, 43–47]. DNA
microarrays have been used to differentiate rectal-cancer
patients into responders and non-responders. A study
using DNA microarrays to assess 17 rectal-cancer samples discovered 17 genes differentially expressed between
responders and non-responders [44]. Some of these
genes included MMP, NFKB2, TGFB1, TOP1, and ITGB1
[44]. The most highly overexpressed gene, MMP7, was
validated by immunohistochemistry, and it was found
that none of the non-responders (n = 7) overexpressed
the gene. However, only four of the responders (n = 10)
overexpressed MMP7 [44]. Palma et al. analyzed the
gene-expression profiles of 26 pre-treatment biopsies by
expression microarray and demonstrated that high levels
Table 4 Statistical association between phospho-P38 and DEK
positiveness in rectal cancer patients treated with neoadjuvant
chemoradiotherapy
DEK \ phospho-P38
Low
High
Total
Low
15
15
30
(%)
(20%)
(20%)
(40%)
High
11
33
44
(%)
(15%)
(45%)
(60%)
Total
26
48
74
(%)
(35%)
(65%)
(100%)
P (chi-square)
0,027
of Gng4, c-Myc, Pola1, and Rrm1 expression were significant factors when predicting neoadjuvant response in
rectal cancer [45]. Others studies with 23 patient samples [17] and with 43 patient samples [43] revealed 54
and 43 differentially expressed genes, respectively,
though no concordance was found between both studies.
Some studies based on miRNA microarrays revealed
higher miR-223 levels in responders compared to nonresponders, one in a cohort of 43 rectal-cancer patients
[46], and a more recent in a cohort of 59 patients [47].
Post-translational modifications may affect the concordance between gene-expression profile and proteinexpression pattern, which could lead to controversial
results. Proteins are the main agents in biologic pathways, and thus the results of protein-expression analysis may be the key to treatment decision-making.
Regarding the prediction of response to chemoradiotherapy in rectal cancer by immunohistochemistry,
Kuremsky et al. reported that the most commonly biomarkers evaluated were p53, EGFR, TYMS, Ki-67, p21,
BCL-2, and BAX [48].
High DEK expression has been described previously
by our group as a crucial event for aggressive tumour
phenotype and as a biomarker for poor response to irinotecan in metastatic colorectal cancer [36]. In the
present study, high DEK expression was related to
pathological response in 74 locally advanced rectal
adenocarcinomas. This enabled us to establish a new
model based on DEK expression that was statistically associated with complete pathological response. Here, it is
supported that rectal cancer patients with high DEK expression have a 19% probability to achieve complete response. Otherwise, low DEK expression predicts lack of
complete response to neoadjuvant treatment. Moreover,
the fact that DEK expression associated with the proapoptotic factor P38 supports the role of DEK as a predictive biomarker for pathological complete response to
chemoradiotherapy prior to surgery in rectal cancer
patients.
The findings showed in the present study seem to disagree with those obtained in our previous work with
colorectal cancer [36]. However, our previous research
was performed with stage IV colorectal cancer samples,
while the present work only focused on stage II–III rectal tumours that only represent a part of colorectal tumors. Moreover, the potential effect of DEK in our
previous study to predict irinotecan response was not
observed with 5FU or oxaliplatin, drugs used in the
present study to evaluate pathological response. Indeed,
DEK has also been related to neoadjuvant treatment response in breast cancer, independently of estrogenreceptor status [49]. Consequently, our study agree with
Witkiewicz et al., who reported a strong association between high DEK expression and a low residual cancer
Age
> 70
> 60
> 70
> 70
> 60
> 70
> 40
> 40
> 70
> 70
> 70
> 50
> 70
> 50
> 70
> 60
> 60
> 80
> 70
> 60
> 70
> 70
> 80
> 70
> 80
> 70
> 50
> 80
> 80
> 60
> 50
> 60
Biopsy
1
2
3
4
5
6
7
8
9
10
11
12
13
14
15
16
17
18
19
20
21
22
23
24
25
26
27
28
29
30
31
32
0
1
0
1
1
0
1
1
1
1
1
2
0
1
0
0
1
1
0
0
0
0
0
0
1
0
0
0
0
0
1
1
ECOG_PS
alive without disease
alive with desease
alive without disease
alive without disease
alive without disease
alive without disease
alive without disease
alive without disease
alive without disease
alive without disease
Death
alive without disease
alive without disease
alive without disease
Death
N/A
alive without disease
alive without disease
alive without disease
alive without disease
alive without disease
alive without disease
alive without disease
alive without disease
alive with desease
alive with desease
alive without disease
alive with desease
alive without disease
Death
alive without disease
alive without disease
Status
N/A
1
0
1
N/A
1
1
1
N/A
N/A
0
1
0
0
1
0
1
1
1
1
0
N/A
1
1
1
0
1
0
0
1
0
0
T-Downstaging
Table 5 Dataset of patient biopsies recruited in the study
N/A
1
0
1
N/A
1
1
1
N/A
N/A
1
0
1
1
0
0
1
1
1
1
1
N/A
1
1
0
0
1
1
1
0
1
1
N-Downstaging
High
High
High
High
High
High
Low
Low
Low
High
High
N/A
High
Low
High
High
Low
High
Low
High
High
High
High
Low
High
High
High
Low
Low
High
High
High
Grade
III
III
III
III
N/A
III
III
III
III
III
III
II
III
III
III
III
III
III
III
III
III
III
III
III
II
III
III
III
III
III
III
III
Stage
RDT + 5FU
RDT + 5FU
RDT + 5FU
RDT + FOLFOX
RDT + 5FU
RDT + FOLFOX
RDT + 5FU
RDT + 5FU
RDT + 5FU
RDT + 5FU
RDT + 5FU
RDT + 5FU
RDT + 5FU
RDT + 5FU
RDT + 5FU
RDT + FOLFOX
RDT + 5FU
RDT + 5FU
RDT + 5FU
RDT + 5FU
RDT + 5FU
RDT + FOLFOX
RDT + FOLFOX
RDT + 5FU
RDT + 5FU
RDT + 5FU
RDT + FOLFOX
RDT + FOLFOX
RDT + 5FU
RDT + FOLFOX
RDT + 5FU
RDT + FOLFOX
Neoadjuvant
treatment
No
No
No
Yes
No
Yes
No
No
Yes
No
Yes
Yes
No
Yes
Yes
Yes
No
Yes
No
No
Yes
No
Yes
No
Yes
Yes
Yes
Yes
No
Yes
No
No
Treatment
toxicity
Complete
Complete
Minimum
Minimum
Complete
Minimum
Partial
Partial
Partial
Partial
Partial
Minimum
Minimum
Minimum
Partial
Minimum
Partial
Minimum
Minimum
Partial
Minimum
Minimum
Minimum
Partial
Minimum
Partial
Partial
Minimum
Minimum
Minimum
Minimum
Partial
Pathological
Response
> 3 cm
< 3 cm
> 3 cm
> 3 cm
> 3 cm
> 3 cm
> 3 cm
> 3 cm
> 3 cm
> 3 cm
> 3 cm
> 3 cm
> 3 cm
> 3 cm
> 3 cm
> 3 cm
> 3 cm
< 3 cm
> 3 cm
> 3 cm
> 3 cm
> 3 cm
> 3 cm
> 3 cm
> 3 cm
> 3 cm
> 3 cm
> 3 cm
> 3 cm
< 3 cm
> 3 cm
> 3 cm
Tumor size
60
60
60
60
60
60
55
50
45
45
45
40
40
40
40
40
35
35
35
35
35
35
35
30
20
20
15
15
10
7
3
3
DEK (% positive
tumor cells)
45
100
40
75
60
80
80
80
80
40
65
100
65
85
90
5
90
90
25
25
70
10
55
45
25
25
80
45
80
65
35
35
Phospho-P38 (%
positive tumor cells)
Martinez-Useros et al. BMC Cancer (2018) 18:144
Page 7 of 11
Age
> 40
> 80
> 80
> 80
> 70
> 70
> 60
> 60
> 40
> 80
> 70
> 70
> 40
> 60
> 80
> 60
> 70
> 80
> 70
> 60
> 70
> 60
> 70
> 80
> 50
> 50
> 60
> 80
> 60
> 50
> 70
> 70
Biopsy
33
34
35
36
37
38
39
40
41
42
43
44
45
46
47
48
49
50
51
52
53
54
55
56
57
58
59
60
61
62
63
64
0
1
0
0
0
0
1
0
0
1
0
1
0
1
1
0
1
0
0
1
0
1
1
0
0
1
0
1
0
1
0
1
ECOG_PS
alive without disease
alive without disease
alive without disease
alive without disease
alive without disease
alive without disease
alive without disease
alive without disease
alive without disease
alive without disease
alive without disease
alive without disease
alive without disease
alive without disease
Death
Death
alive with desease
alive without disease
alive without disease
alive without disease
alive without disease
alive with desease
alive without disease
alive without disease
alive without disease
alive without disease
alive without disease
alive without disease
alive without disease
alive without disease
alive without disease
alive without disease
Status
0
1
N/A
1
1
1
0
1
0
1
0
1
0
0
0
1
0
0
1
1
N/A
1
1
1
1
1
1
1
1
1
1
0
T-Downstaging
1
1
N/A
1
1
1
0
1
1
1
0
0
1
0
0
1
1
1
1
1
N/A
0
1
1
0
1
1
1
1
0
1
0
N-Downstaging
Table 5 Dataset of patient biopsies recruited in the study (Continued)
High
High
Low
Low
High
Low
High
Low
High
N/A
N/A
N/A
High
High
High
Low
High
High
Low
N/A
High
Low
High
Low
High
High
Low
N/A
N/A
High
High
High
Grade
III
III
III
III
III
III
III
III
III
III
II
III
III
III
III
III
III
III
III
III
III
III
III
III
III
III
III
III
III
III
III
III
Stage
RDT + 5FU
RDT + 5FU
RDT + FOLFOX
RDT + 5FU
RDT + 5FU
RDT + 5FU
RDT + 5FU
RDT + 5FU
RDT + 5FU
RDT + FOLFOX
RDT + 5FU
RDT + 5FU
RDT + 5FU
RDT + 5FU
RDT + FOLFOX
others
RDT + 5FU
RDT + 5FU
RDT + 5FU
RDT + 5FU
RDT + 5FU
RDT + FOLFOX
RDT + 5FU
RDT + 5FU
RDT + 5FU
RDT + 5FU
RDT + 5FU
RDT + 5FU
RDT + 5FU
RDT + 5FU
RDT + 5FU
RDT + FOLFOX
Neoadjuvant
treatment
No
No
No
No
No
No
No
No
Yes
No
No
No
Yes
No
Yes
Yes
Yes
Yes
Yes
No
No
No
No
Yes
No
No
No
No
Yes
No
Yes
Yes
Treatment
toxicity
Minimum
Minimum
Minimum
Partial
Minimum
Partial
Minimum
Partial
Minimum
Partial
Partial
Partial
Partial
Partial
Minimum
Minimum
Complete
Minimum
Complete
Complete
Minimum
Minimum
Complete
Partial
Partial
Partial
Minimum
Complete
Partial
Partial
Partial
Minimum
Pathological
Response
> 3 cm
N/A
> 3 cm
> 3 cm
> 3 cm
> 3 cm
> 3 cm
> 3 cm
> 3 cm
> 3 cm
> 3 cm
> 3 cm
< 3 cm
> 3 cm
> 3 cm
< 3 cm
> 3 cm
> 3 cm
< 3 cm
> 3 cm
> 3 cm
< 3 cm
> 3 cm
> 3 cm
> 3 cm
> 3 cm
> 3 cm
> 3 cm
< 3 cm
> 3 cm
> 3 cm
> 3 cm
Tumor size
65
65
65
65
65
90
90
85
85
85
85
85
85
85
85
80
80
80
80
80
80
75
75
75
75
75
75
75
70
65
65
65
DEK (% positive
tumor cells)
90
90
75
75
100
85
95
100
0
80
30
85
75
45
90
10
30
95
100
35
3
70
95
90
95
75
90
80
60
50
80
15
Phospho-P38 (%
positive tumor cells)
Martinez-Useros et al. BMC Cancer (2018) 18:144
Page 8 of 11
> 70
> 50
> 60
> 70
> 60
> 60
> 70
> 70
> 80
> 50
65
66
67
68
69
70
71
72
73
74
1
1
0
0
0
0
0
2
0
1
ECOG_PS
0
0
alive without disease
1
0
0
0
1
0
1
0
T-Downstaging
alive without disease
alive without disease
alive with desease
alive without disease
alive without disease
alive without disease
Death
alive without disease
Death
Status
N/A Not available, RDT radiotherapy
Age
Biopsy
1
1
0
1
1
1
0
0
1
0
N-Downstaging
Table 5 Dataset of patient biopsies recruited in the study (Continued)
High
High
High
High
High
High
N/A
High
Low
High
Grade
III
III
III
III
III
III
II
III
III
III
Stage
RDT + 5FU
RDT + 5FU
RDT + 5FU
RDT + 5FU
RDT + 5FU
RDT + 5FU
RDT + 5FU
RDT + 5FU
RDT + 5FU
RDT + 5FU
Neoadjuvant
treatment
No
No
No
No
Yes
No
No
Yes
No
Yes
Treatment
toxicity
Minimum
Minimum
Complete
Minimum
Minimum
Partial
Minimum
Minimum
Minimum
Minimum
Pathological
Response
> 3 cm
> 3 cm
> 3 cm
> 3 cm
> 3 cm
> 3 cm
> 3 cm
> 3 cm
> 3 cm
> 3 cm
Tumor size
100
100
95
95
95
95
95
95
90
90
DEK (% positive
tumor cells)
80
75
75
75
90
80
85
100
55
45
Phospho-P38 (%
positive tumor cells)
Martinez-Useros et al. BMC Cancer (2018) 18:144
Page 9 of 11
Martinez-Useros et al. BMC Cancer (2018) 18:144
burden, indicative of preferred response to neoadjuvant
chemotherapy [49].
Conclusions
This retrospective study supports DEK as a potential
predictive biomarker for neoadjuvant treatment response
in rectal cancer. Moreover, the methodology performed
here is easy and reproducible enough to be implemented
in the routine clinical practise.
Although further research is needed, this preliminary
study could be used to prospectively validate the predictive value of DEK expression in rectal and other types of
tumours prior neoadjuvant treatment.
Abbreviations
5FU: 5-Fluorouracil; BAX: BCL2-associated X protein; BCL-2: B-cell lymphoma
2; c-MYC: c-myelocytomatosis viral oncogene; DEK: DEK proto-oncogen;
ECOG: Eastern cooperative oncology group; EGFR: Epidermal growth factor
receptor; FFPE: Formalin-fixed paraffin-embedded; FOLFOX: Folinic acid + 5Fluorouracil + Oxaliplatin; GNG4: G protein subunit gamma 4; Gy: Gray;
ITGB1: Integrin subunit beta 1; Ki-67: Marker of proliferation Ki-67;
MAPK: Mitogen-activated protein kinases; MMP: Matrix metallopeptidases;
MRI: Magnetic resonance imaging; N/A: Not available; NFKB2: Nuclear factor
of kappa light polypeptide gene enhancer in B-cells 2; POLA1: Polymerase
(DNA) alpha 1; RRM1: Ribonucleotide reductase M1; RT: Radiotherapy;
TGFB1: Transforming growth factor beta 1; TOP1: Topoisomerase (DNA) I;
TYMS: Thymidylate synthetase
Acknowledgements
We thank Dr. Oliver Shaw (IIS-FJD) for editing the manuscript for English
usage, clarity, and style. We also thank Dr. Ignacio Mahillo (IIS-FJD), and Dr.
Ricardo Villa Bellosta (IIS-FJD) for his much-appreciated review and support
with statistical analysis.
Funding
This work has been carried out with the support of the RNA-Reg CONSOLIDER
Network CSD2009–00080 (J.M.-U. and J.G.-F.), and Spanish Health Research
Project Funds PI16/01468 from Instituto de Salud Carlos III- Fondos FEDER (A.C.
and J.G.-F.), both of the Spanish Ministry of Economy, Industry and Competitiveness.
The funding body had no role in the design of the study and collection, analysis,
and interpretation of data and in writing the manuscript.
Availability of data and materials
All data supporting the findings of the present manuscript can be found in
the additional supporting file (Table 5. Dataset of patient biopsies recruited
in the study).
Authors’ contributions
JM-U and JG-F designed research; JM-U, IM, MR-R, AB-P, AP-O, NP, and L
dP-N performed research; JM-U, AC, TG delP, MSS, MJF-A and JG-F contributed
to analytic tools; JM-U, W.L., and JG-F analysed data; and JM-U wrote the paper.
All authors read and approved the final manuscript.
Ethics approval and consent to participate
The clinical samples used in the study were kindly supplied by the BioBank
of the Fundacion Jimenez Diaz – Universidad Autonoma de Madrid (PT13/
0010/0012). All patients gave written informed consent for the use of their
biological samples for research purposes. The institutional review board (IRB)
of the Fundacion Jimenez Diaz Hospital evaluated the study, granting approval
on December 9, 2014 under approval number 17/14. The FJD-IRB also certified
that this study belongs to the RNA-Reg Consolider-Ingenio Network (CSD2009–
0080) and Spanish Health Research Project Funds (PI16/01468) from Instituto de
Salud Carlos III (ISCIII)-Fondos FEDER.
Consent for publication
Not applicable.
Page 10 of 11
Competing interests
The authors declare that they have no competing interest.
Publisher’s Note
Springer Nature remains neutral with regard to jurisdictional claims in published
maps and institutional affiliations.
Author details
1
Translational Oncology Division, OncoHealth Institute, Health Research
Institute - University Hospital “Fundación Jiménez Díaz”-UAM, Av. Reyes
Católicos 2, 28040 Madrid, Spain. 2Department of Pathology, Clinico San
Carlos University Hospital, Madrid, Spain. 3Department of Pathology,
University Hospital “Fundación Jiménez Díaz”-UAM, Madrid, Spain.
4
Melanoma Research Group, Spanish National Cancer Research Centre,
Madrid, Spain.
Received: 9 May 2016 Accepted: 24 January 2018
References
1. Siegel RL, Miller KD, Jemal A. Cancer statistics, 2016. CA Cancer J Clin. 2016;
66(1):7–30.
2. Ferlay J, Steliarova-Foucher E, Lortet-Tieulent J, Rosso S, Coebergh JW,
Comber H, et al. Cancer incidence and mortality patterns in Europe:
estimates for 40 countries in 2012. Eur J Cancer. 2013;49(6):1374–403.
3. Ferlay J SI, Ervik M, Dikshit R, Eser S, Mathers C, Rebelo M, Parkin DM,
Forman D, Bray F Cancer Incidence and Mortality Worldwide: IARC.
GLOBOCAN 2012 v10 2013, No. 11.
4. Ferlay J, Soerjomataram I, Dikshit R, Eser S, Mathers C, Rebelo M, et al.
Cancer incidence and mortality worldwide: sources, methods and major
patterns in GLOBOCAN 2012. Int J Cancer. 2014;136(5):E359–86.
5. McCourt M, Armitage J, Monson JR. Rectal cancer. Surgeon. 2009;7(3):162–9.
6. Fazeli MS, Keramati MR. Rectal cancer: a review. Med J Islam Repub Iran.
2015;29:171–2015.
7. Maeda K, Koide Y, Katsuno H. When is local excision appropriate for early
rectal cancer? Surg Today 2014;44(11):2000-2014 Epub 2013 Nov 21 doi:
101007/s00595-013-0766-3.
8. Minsky BD, Mies C, Recht A, Rich TA, Chaffey JT. Resectable adenocarcinoma
of the rectosigmoid and rectum. I. Patterns of failure and survival. Cancer.
1988;61(7):1408–16.
9. Dahlberg M, Glimelius B, Pahlman L. Improved survival and reduction in
local failure rates after preoperative radiotherapy: evidence for the
generalizability of the results of Swedish rectal cancer trial. Ann Surg. 1999;
229(4):493–7.
10. Katz D, Ito E, Liu FF. On the path to seeking novel radiosensitizers. Int J
Radiat Oncol Biol Phys. 2009;73(4):988–96.
11. van Gijn W, Marijnen CA, Nagtegaal ID, Kranenbarg EM, Putter H, Wiggers T,
et al. Preoperative radiotherapy combined with total mesorectal excision for
resectable rectal cancer: 12-year follow-up of the multicentre, randomised
controlled TME trial. Lancet Oncol. 2011;12(6):575–82.
12. Yoon WH, Kim HJ, Kim CH, Joo JK, Kim YJ, Kim HR. Oncologic impact of
pathologic response on clinical outcome after preoperative
chemoradiotherapy in locally advanced rectal cancer. Ann Surg Treat Res.
2015;88(1):15–20.
13. Schrag D. Evolving role of neoadjuvant therapy in rectal cancer. Curr Treat
Options in Oncol. 2013;14(3):350–64.
14. Dimitriou N, Michail O, Moris D, Griniatsos J. Low rectal cancer: sphincter
preserving techniques-selection of patients, techniques and outcomes.
World J Gastrointest Oncol. 2015;7(7):55–70.
15. Ryan R, Gibbons D, Hyland JM, Treanor D, White A, Mulcahy HE, et al.
Pathological response following long-course neoadjuvant
chemoradiotherapy for locally advanced rectal cancer. Histopathology. 2005;
47(2):141–6.
16. Wheeler JM, Dodds E, Warren BF, Cunningham C, George BD, Jones AC, et
al. Preoperative chemoradiotherapy and total mesorectal excision surgery
for locally advanced rectal cancer: correlation with rectal cancer regression
grade. Dis Colon rectum. 2004;47(12):2025–31.
17. Ghadimi BM, Grade M, Difilippantonio MJ, Varma S, Simon R, Montagna C,
et al. Effectiveness of gene expression profiling for response prediction of
rectal adenocarcinomas to preoperative chemoradiotherapy. J Clin Oncol.
2005;23(9):1826–38.
Martinez-Useros et al. BMC Cancer (2018) 18:144
18. Smith FM, Reynolds JV, Miller N, Stephens RB, Kennedy MJ. Pathological and
molecular predictors of the response of rectal cancer to neoadjuvant
radiochemotherapy. Eur J Surg Oncol. 2006;32(1):55–64.
19. Grade M, Wolff HA, Gaedcke J, Ghadimi BM. The molecular basis of
chemoradiosensitivity in rectal cancer: implications for personalized
therapies. Langenbeck's Arch Surg. 2012;397(4):543–55.
20. von Lindern M, Breems D, van Baal S, Adriaansen H, Grosveld G.
Characterization of the translocation breakpoint sequences of two DEK-CAN
fusion genes present in t(6;9) acute myeloid leukemia and a SET-CAN fusion
gene found in a case of acute undifferentiated leukemia. Genes
Chromosomes Cancer. 1992;5(3):227–34.
21. Datta A, Adelson ME, Mogilevkin Y, Mordechai E, Sidi AA, Trama JP.
Oncoprotein DEK as a tissue and urinary biomarker for bladder cancer. BMC
Cancer. 2011;11:234.
22. Privette Vinnedge LM, McClaine R, Wagh PK, Wikenheiser-Brokamp KA,
Waltz SE, Wells SI. The human DEK oncogene stimulates beta-catenin
signaling, invasion and mammosphere formation in breast cancer.
Oncogene. 2011;30(24):2741–52.
23. Kroes RA, Jastrow A, McLone MG, Yamamoto H, Colley P, Kersey DS, et al.
The identification of novel therapeutic targets for the treatment of
malignant brain tumors. Cancer Lett. 2000;156(2):191–8.
24. Kondoh N, Wakatsuki T, Ryo A, Hada A, Aihara T, Horiuchi S, et al.
Identification and characterization of genes associated with human
hepatocellular carcinogenesis. Cancer Res. 1999;59(19):4990–6.
25. Khodadoust MS, Verhaegen M, Kappes F, Riveiro-Falkenbach E, Cigudosa JC,
Kim DS, et al. Melanoma proliferation and chemoresistance controlled by
the DEK oncogene. Cancer Res. 2009;69(16):6405–13.
26. Grasemann C, Gratias S, Stephan H, Schuler A, Schramm A, Klein-Hitpass L,
et al. Gains and overexpression identify DEK and E2F3 as targets of
chromosome 6p gains in retinoblastoma. Oncogene. 2005;24(42):6441–9.
27. Paderova J, Orlic-Milacic M, Yoshimoto M, da Cunha Santos G, Gallie B,
Squire JA. Novel 6p rearrangements and recurrent translocation breakpoints
in retinoblastoma cell lines identified by spectral karyotyping and mBAND
analyses. Cancer Genet Cytogenet. 2007;179(2):102–11.
28. Carro MS, Spiga FM, Quarto M, Di Ninni V, Volorio S, Alcalay M, et al. DEK
expression is controlled by E2F and deregulated in diverse tumor types. Cell
Cycle. 2006;5(11):1202–7.
29. Han S, Xuan Y, Liu S, Zhang M, Jin D, Jin R, et al. Clinicopathological
significance of DEK overexpression in serous ovarian tumors. Pathol Int.
2009;59(7):443–7.
30. Wu Q, Li Z, Lin H, Han L, Liu S, Lin Z. DEK overexpression in uterine cervical
cancers. Pathol Int. 2008;58(6):378–82.
31. Nagpal JK, Das BR. Identification of differentially expressed genes in tobacco
chewing-mediated oral cancer by differential display-polymerase chain
reaction. Eur J Clin Investig. 2007;37(8):658–64.
32. Gamble MJ, Fisher RP. SET and PARP1 remove DEK from chromatin to
permit access by the transcription machinery. Nat Struct Mol Biol. 2007;
14(6):548–55.
33. Wise-Draper TM, Allen HV, Thobe MN, Jones EE, Habash KB, Munger K, et al.
The human DEK proto-oncogene is a senescence inhibitor and an
upregulated target of high-risk human papillomavirus E7. J Virol. 2005;
79(22):14309–17.
34. Wise-Draper TM, Allen HV, Jones EE, Habash KB, Matsuo H, Wells SI.
Apoptosis inhibition by the human DEK oncoprotein involves interference
with p53 functions. Mol Cell Biol. 2006;26(20):7506–19.
35. Kim D, Kim J, Kang SS, Jin EJ. Transforming growth factor-beta3-induced
Smad signaling regulates actin reorganization during chondrogenesis of
chick leg bud mesenchymal cells. J Cell Biochem. 2009;107(4):622–9.
36. Martinez-Useros J, Rodriguez-Remirez M, Borrero-Palacios A, Moreno I,
Cebrian A, Gomez del Pulgar T, et al. DEK is a potential marker for
aggressive phenotype and irinotecan-based therapy response in metastatic
colorectal cancer. BMC Cancer. 2014;14:965.
37. Witkiewicz AK, Balaji U, Knudsen E. Systematically defining single gene
determinants of response to neoadjuvant chemotherapy reveals specific
biomarkers. Clin Cancer Res.
38. Edge SB, Compton CC. The American joint committee on cancer: the 7th
edition of the AJCC cancer staging manual and the future of TNM. Ann
Surg Oncol. 2010;17(6):1471–4.
39. Adsay NV, Basturk O, Bonnett M, Kilinc N, Andea AA, Feng J, et al. A
proposal for a new and more practical grading scheme for pancreatic
ductal adenocarcinoma. Am J Surg Pathol. 2005;29(6):724–33.
Page 11 of 11
40. Zarubin T, Han J. Activation and signaling of the p38 MAP kinase pathway.
Cell Res. 2005;15(1):11–8.
41. Cuenda A, Rousseau S. p38 MAP-kinases pathway regulation, function and
role in human diseases. Biochim Biophys Acta. 2007;1773(8):1358–75.
42. Marzi L, Combes E, Vie N, Ayrolles-Torro A, Tosi D, Desigaud D, et al.
FOXO3a and the MAPK p38 are activated by cetuximab to induce cell death
and inhibit cell proliferation and their expression predicts cetuximab
efficacy in colorectal cancer. Br J Cancer. 2016;115(10):1223–33.
43. Rimkus C, Friederichs J, Boulesteix AL, Theisen J, Mages J, Becker K, et al.
Microarray-based prediction of tumor response to neoadjuvant
radiochemotherapy of patients with locally advanced rectal cancer. Clin
Gastroenterol Hepatol. 2008;6(1):53–61.
44. Nishioka M, Shimada M, Kurita N, Iwata T, Morimoto S, Yoshikawa K, et al. Gene
expression profile can predict pathological response to preoperative
chemoradiotherapy in rectal cancer. Cancer Genomics Proteomics. 2011;8(2):87–92.
45. Palma P, Cano C, Conde-Muino R, Comino A, Bueno P, Ferron JA, et al.
Expression profiling of rectal tumors defines response to neoadjuvant
treatment related genes. PLoS One. 2014;9(11):2014.
46. Hotchi M, Shimada M, Kurita N, Iwata T, Sato H, Morimoto S, et al. microRNA
expression is able to predict response to chemoradiotherapy in rectal
cancer. Mol Clin Oncol. 2013;1(1):137–42.
47. Nakao T, Iwata T, Hotchi M, Yoshikawa K, Higashijima J, Nishi M, et al.
Prediction of response to preoperative chemoradiotherapy and
establishment of individualized therapy in advanced rectal cancer. Oncol
Rep. 2015;34(4):1961–7.
48. Kuremsky JG, Tepper JE, McLeod HL. Biomarkers for response to
neoadjuvant chemoradiation for rectal cancer. Int J Radiat Oncol Biol Phys.
2009;74(3):673–88.
49. Witkiewicz AK, Balaji U, Knudsen ES. Systematically defining single-gene
determinants of response to neoadjuvant chemotherapy reveals specific
biomarkers. Clin Cancer Res. 2014;20(18):4837–48.
Submit your next manuscript to BioMed Central
and we will help you at every step:
• We accept pre-submission inquiries
• Our selector tool helps you to find the most relevant journal
• We provide round the clock customer support
• Convenient online submission
• Thorough peer review
• Inclusion in PubMed and all major indexing services
• Maximum visibility for your research
Submit your manuscript at
www.biomedcentral.com/submit