Expression of glycolytic enzymes in ovarian cancers and evaluation of the glycolytic pathway as a strategy for ovarian cancer treatment
Bạn đang xem bản rút gọn của tài liệu. Xem và tải ngay bản đầy đủ của tài liệu tại đây (3.11 MB, 15 trang )
Xintaropoulou et al. BMC Cancer (2018) 18:636
/>
RESEARCH ARTICLE
Open Access
Expression of glycolytic enzymes in ovarian
cancers and evaluation of the glycolytic
pathway as a strategy for ovarian cancer
treatment
Chrysi Xintaropoulou1, Carol Ward1,2, Alan Wise3, Suzanna Queckborner1, Arran Turnbull1, Caroline O. Michie4,
Alistair R. W. Williams5, Tzyvia Rye4, Charlie Gourley4 and Simon P. Langdon1*
Abstract
Background: Novel therapeutic approaches are required to treat ovarian cancer and dependency on glycolysis
may provide new targets for treatment. This study sought to investigate the variation of expression of molecular
components (GLUT1, HKII, PKM2, LDHA) of the glycolytic pathway in ovarian cancers and the effectiveness of
targeting this pathway in ovarian cancer cell lines with inhibitors.
Methods: Expression of GLUT1, HKII, PKM2, LDHA were analysed by quantitative immunofluorescence in a
tissue microarray (TMA) analysis of 380 ovarian cancers and associations with clinicopathological features were
sought. The effect of glycolysis pathway inhibitors on the growth of a panel of ovarian cancer cell lines was
assessed by use of the SRB proliferation assay. Combination studies were undertaken combining these inhibitors with
cytotoxic agents.
Results: Mean expression levels of GLUT1 and HKII were higher in high grade serous ovarian cancer (HGSOC), the most
frequently occurring subtype, than in non-HGSOC. GLUT1 expression was also significantly higher in advanced stage
(III/IV) ovarian cancer than early stage (I/II) disease. Growth dependency of ovarian cancer cells on glucose
was demonstrated in a panel of ovarian cancer cell lines. Inhibitors of the glycolytic pathway (STF31, IOM-1190, 3PO
and oxamic acid) attenuated cell proliferation in platinum-sensitive and platinum-resistant HGSOC cell line models in a
concentration dependent manner. In combination with either cisplatin or paclitaxel, 3PO (a novel PFKFB3 inhibitor)
enhanced the cytotoxic effect in both platinum sensitive and platinum resistant ovarian cancer cells. Furthermore,
synergy was identified between STF31 (a novel GLUT1 inhibitor) or oxamic acid (an LDH inhibitor) when combined
with metformin, an inhibitor of oxidative phosphorylation, resulting in marked inhibition of ovarian cancer cell growth.
Conclusions: The findings of this study provide further support for targeting the glycolytic pathway in ovarian cancer
and several useful combinations were identified.
Keywords: Ovarian cancer, Glycolytic pathway, Inhibitors, Combination strategies, Cisplatin, Metformin
* Correspondence:
1
Cancer Research UK Edinburgh Centre and Division of Pathology
Laboratory, Institute of Genetics and Molecular Medicine, University of
Edinburgh, Edinburgh EH4 2XU, UK
Full list of author information is available at the end of the article
© The Author(s). 2018 Open Access This article is distributed under the terms of the Creative Commons Attribution 4.0
International License ( which permits unrestricted use, distribution, and
reproduction in any medium, provided you give appropriate credit to the original author(s) and the source, provide a link to
the Creative Commons license, and indicate if changes were made. The Creative Commons Public Domain Dedication waiver
( applies to the data made available in this article, unless otherwise stated.
Xintaropoulou et al. BMC Cancer (2018) 18:636
Background
Ovarian cancer is the 7th most common female cancer
worldwide with an estimated 239,000 new diagnoses
worldwide each year [1]. Standard treatment of ovarian
cancer consists of debulking surgery followed by
systemic platinum and taxane-based chemotherapy. Even
though platinum-based chemotherapy has a high
response rate, it is estimated that approximately 70% of
patients will relapse with resistant disease and new treatments are required [2]. High-grade serous ovarian
cancer (HGSOC) accounts for approximately 70% of
epithelial ovarian cancers while non-HGSOC which
includes endometrioid, clear cell, mucinous and
low-grade serous ovarian cancer, among others, comprise important subgroups [2].
Many cancer cells rely on glycolysis as their primary
source of energy regardless of oxygen availability; the
persistence of glycolysis in cancer cells even under
aerobic conditions is termed aerobic glycolysis or the
Warburg effect. This metabolic alteration in tumours
has been extensively demonstrated in a wide variety of
cancers and considered a ‘hallmark’ of advanced malignancy [3–5]. It has been estimated that many tumour
cells under aerobic conditions produce up to 60% of
their ATP requirement through glycolysis [6, 7]. This
‘metabolic reprogramming’ is an adaptation to meet the
requirements of highly proliferative malignant tissues,
providing the precursors needed to support biosynthesis
[8, 9]. Furthermore, the metabolic alteration of cancer
cells can provide them with a selective advantage for
survival and growth in low oxygen tumour microenvironments. As tumours grow and expand away from a
functional blood supply, glycolysis is an evolutionary
adaptation of cells to survive and thrive in a hypoxic environment [3, 7, 10]. This reliance on glycolysis provides
a possible therapeutic opportunity and the enzymes
comprising the glycolytic pathway may be potential targets for cancer treatment [6, 10–17]. Several glycolytic
inhibitors have emerged as exhibiting promising anticancer activity both in vitro and in vivo and a number have
reached clinical trials [10–13, 16].
Glucose transporter 1 (GLUT1) is the first component
of the glycolysis pathway, transporting glucose into the
cell, and is up-regulated in many tumour types. High
expression has been associated with poor clinical outcome
and adverse prognosis [18–20]. STF31 [4-[[[[4-(1,
1-Dimethylethyl) phenyl] sulfonyl] amino] methyl]-N-3pyridinylbenzamide] is a pyridyl-anilino-thiazole that
impairs glycolytic metabolism and binds to the GLUT1
transporter [21]. Based on molecular modelling, STF31
was predicted to interact directly with the central pore of
the transporter and was shown to inhibit glucose uptake
and induce necrotic cell death selectively in glycolytic
cancer cells. In vivo efficacy of the compound was also
Page 2 of 15
demonstrated [21]. IOM-1190 is a GLUT1 inhibitor
that suppresses 2-deoxy-D-glucose (2-DG) uptake and
lactate production in A549 lung cancer cells resulting
in rapid apoptotic cell death. High affinity for GLUT1
binding of the radiolabelled compound has also been
documented [22].
Hexokinase catalyses the first rate-controlling irreversible reaction of the glycolytic pathway; phosphorylating
glucose to glucose-6-phosphate coupled with ATP
de-phosphorylation. The mitochondrial-bound isoform
HKII is considered to play a pivotal role in carcinogenesis and is overexpressed in many tumours [23, 24].
6-Phosphofructo-2-kinase/fructose-2,6-biphosphatase
(3PFKFB3), which converts fructose-6-phosphate to
fructose-2,6-bisP (F2,6BP), is downstream of HKII.
PFKFB3 overexpression has been documented in several
tumour types including ovarian cancers [25]. In 2008,
Clem et al. identified a competitive inhibitor of PFKFB3,
3PO, using computational modelling and virtual
database in silico screening. 3PO [3-(3-Pyridinyl)-1-(4pyridinyl)-2-propen-1-one] is a novel small molecule,
dipyridinyl-propenone based compound that reduced
intracellular F2,6BP levels, glucose uptake and lactate
production followed by induction of G2-M phase cell
cycle arrest. 3PO treatment suppressed tumour growth
in vivo in mice bearing leukaemia, lung and breast
adenocarcinoma xenografts [26].
Further downstream is the M2 isozyme of pyruvate
kinase (PKM2) which catalyses the irreversible conversion of phosphoenolpyruvate (PEP) to pyruvate coupled
with ADP phosphorylation and is found overexpressed
in various tumour types and plays a pivotal role in carcinogenesis [27, 28].
Lactate dehydrogenase A (LDHA) is the enzyme catalysing the reduction of pyruvate in the final step of the
glycolytic pathway. LDHA upregulation has been reported in ovarian cancers when compared to normal tissues [29]. LDHA overexpression is considered to have a
crucial role in tumorigenesis and is often associated with
poor clinical outcome and resistance to therapy [30–32].
Oxamic acid is an established pyruvate analogue (a
structural isostere of pyruvic acid) described as a well
characterised substrate-like competitive inhibitor of
LDH. Promising anti-proliferative effects of oxamic acid
have been reported in vitro in hepatocellular and breast
carcinoma cell lines [33–36].
Several successful combinations of glycolytic
inhibitors with cytotoxic drugs have recently been
identified and glycolytic inhibitors have been demonstrated to resensitise drug-resistant cells to conventional regimens [12, 14, 15, 37–39].
We have previously demonstrated antitumour activity
of glycolytic inhibitors against panels of ovarian and
breast cancer cell lines [40]. In the present study, we
Xintaropoulou et al. BMC Cancer (2018) 18:636
evaluated the levels of expression of four selected glycolytic targets (GLUT1, HKII, PKM2 and LDHA) in a large
series of ovarian cancers to investigate possible associations with histological subtype and stage of disease. We
have then used four inhibitors to target prime components of the pathway and compared these agents against
paired chemosensitive and chemoresistant ovarian
cancer cell lines. Novel combinations between cisplatin
and paclitaxel with inhibitors of the glycolytic pathway
were then investigated and evaluated quantitatively by
comparison of their combination indices.
Methods
Study population
Primary Ovarian cancer patients treated at the
Edinburgh Cancer Centre between 1991 and 2006 were
retrospectively identified from the Edinburgh Ovarian
Cancer Database. Tissues were formalin-fixed and
paraffin-embedded. Haematoxylin-eosin stained slides
were reviewed by a subspecialist gynaecological pathologist, and histological classification of tumour type
confirmed. Three separate Tissue Microarray (TMA)
replicates containing cores of 380 ovarian tumours were
constructed. The number of samples available for histology and stage analysis is shown in Additional file 1:
Table S1 and the full dataset used for analysis is given in
Additional file 2.
No informed consent was obtained for use of retrospective tissue samples from the patients within this study,
most of whom were deceased, since this was not deemed
necessary by the Ethics Committee. The TMA material
was kindly provided by the Edinburgh Experimental
Cancer Medicine Centre (ECMC ID: SR319). Ethical
approval for the use of tumour material and correlation
with associated clinical data was obtained from South East
Scotland Human Annotated Bioresource (East of Scotland
Research Ethics Service Reference 15/ES/0094).
Immunofluorescence of clinical ovarian cancer tissues
Microscope slides of TMA sections were deparaffinised
and rehydrated followed by heat-induced antigen retrieval being performed in sodium citrate buffer at pH 6.
Endogenous peroxidase activity was blocked with 3%
hydrogen peroxide for 10 min and non-specific binding
was blocked by a 10 min incubation in serum-free protein block (DAKO). Primary antibodies were diluted in
antibody diluent (DAKO) and were applied overnight at
4 °C. The following primary rabbit antibodies, validated
for the protocol, were used: GLUT1 (Merck Millipore),
HKII (Cell Signaling Technology), LDHA (Cell Signaling
Technology) and PKM2 (Cell Signaling Technology).
The following day, tissue sections were washed with
0.05% PBS Tween 20 (PBS-T), and were then incubated
with primary mouse anti-cytokeratin antibody (M3515/
Page 3 of 15
DAKO) diluted 1:25 in the same antibody diluent in
order to mask the tumour areas. This incubation was
performed at room temperature, lasted 1 h and was
followed by PBS-T washes. To enable epithelial mask
visualisation, slides were then incubated with the secondary goat anti-mouse antibody conjugated with Alexa
Fluor 555 (Thermo Fisher Scientific) diluted 1:25 in the
goat anti-rabbit peroxidase-conjugated Envision reagent
(DAKO). This incubation was conducted at room
temperature protected from light for 90 min and was
followed by PBS-T washes. Target visualisation was
implemented by a 10 min incubation with Cyanine 5
(Cy5) Tyramide, diluted at 1:50 in amplification diluent
(PerkinElmer), at room temperature protected from
light. Subsequently, tissue sections were washed with
PBS-T and dehydrated. Finally, slides were counterstained with 45 μl Prolong Gold Antifade Mountant with
DAPI (4′, 6-diamidino-2-phenylindole) (Thermo Fisher
Scientific) to visualise the nuclei and a coverslip was
mounted.
AQUA image analysis
Protein expression in the ovarian tumour cores was
quantitatively evaluated by Automated Quantitative
Analysis (AQUA) [41]. High resolution monochromatic
images of each TMA core were captured at 20× objective using an Olympus AX-51 epifluorescence microscope
and were analysed by AQUAnalysis software. DAPI,
Cy-3 and Cy-5 filters were applied to visualise the nuclei,
the cytokeratin tumour mask and the target protein respectively. The Cy-5 fluorescent signal intensity of the
target antigen was quantified in each image pixel. A
quantitative score was attributed to each histospot based
on the average Cy5 signal in the cytoplasmic compartment within the epithelial tumour mask, as identified by
the cytokeratin Cy3 stain. Damaged cores or cores containing imaging errors as well as those consisting of less
than 5% epithelium were excluded from further analysis.
Target expression in the cytoplasmic compartment of
each core was quantified and assigned an AQUA score.
Data were filtered and only samples that had at least two
replicate values were considered. Expression values were
averaged from either two or three replicates. Spearman
non-parametric correlation and network analysis were
conducted using TMA Navigator [42]. Correlation heatmaps were generated using the same software (http://
www.tmanavigator.org/). For this analysis, expression
data of different markers had been log2 transformed,
mean-centred and quantile-normalised to compensate
for differences in the staining. The expression of examined glycolytic targets was compared across the different
pathological stages and histological types of ovarian
tumours using one-way ANOVA and statistical
significance was determined by the Tukey’s multiple
Xintaropoulou et al. BMC Cancer (2018) 18:636
comparisons test. The Spearman correlation coefficient was calculated for each pair of markers and
statistical significance was determined using the Algorithm AS89 [43]. Spearman’s correlation P-values were
adjusted for multiple hypothesis testing according to
Benjamini-Yekutieli FDR correction. The P-value significance threshold was set at 0.01.
Cell lines
A panel of four ovarian cancer cell lines were used initially. OVCAR5, OVCAR3 and CAOV3 are HGSOC cell
lines [44] while TOV112D is of endometrioid ovarian cancer origin [45]. OVCAR5 and OVCAR3 were gifts from
Dr. Tom Hamilton, Fox Chase Institute, Philadelphia, PA
USA while CAOV3 and TOV112D were obtained from
American Type Culture Collection, Manassas, Virginia,
USA. Two cell line pairs derived from two patients with
HGSOC at different stages of platinum-based chemotherapy were also used – PEA1 / PEA2 and PE01/PE04 respectively [46]. The first cell line of each pair was regarded
as chemosensitive and the second cell line (which was isolated following the development of platinum resistance),
chemoresistant [46, 47]. These were developed within our
laboratory and are now available at the European Collection of Cell Cultures, Porton Down, UK. All cell lines used
in this study were authenticated using Short Tandem
Repeat profiling (STR) (by ECACC) and were routinely
subjected to mycoplasma testing.
Cell culture
All cell line work was conducted in sterile conditions in
a class II Laminar Air Flow hood at room temperature.
Cells were incubated in a humidified atmosphere of 5%
CO2 at 37 °C. The panel of four ovarian cancer cell lines
(OVCAR5, TOV112D, OVCAR3 and CAOV3) were all
maintained in Dulbecco’s Modified Eagle Medium without HEPES modification (DMEM, Thermo Fisher Scientific), containing glucose (5.56 mM), Sodium Pyruvate
(1 mM) and L-glutamine (3.97 mM). The two ovarian
cancer cell line pairs (PEA1-PEA2, PEO1-PEO4) were
maintained in RPMI 1640 (Thermo Fisher Scientific)
containing 11.11 mM glucose and 2 mM L-glutamine. In
both cases the media contained phenol red and were
supplemented with 10% heat inactivated fetal bovine
serum FBS (Fetal Bovine Serum, Thermo Fisher Scientific) and 1% Penicillin-Streptomycin (Penicillin-Streptomycin 10,000 U/mL, Thermo Fisher Scientific).
In the deprivation experiments where the effect of
glucose availability on cell growth of different cell lines
was examined, medium without glucose was used
(DMEM, Thermo Fisher Scientific). Phenol red free
media were supplemented with 10% heat inactivated
dialysed fetal bovine serum (Thermo Fisher Scientific)
and 1% Penicillin-Streptomycin. In the glucose depleted
Page 4 of 15
medium the desired concentration of D-Glucose (Sigma
Aldrich) was added along with a standard 4 mM L-Glutamine (Sigma Aldrich) concentration.
Cells were routinely maintained in T175cm3 tissue
culture flasks and were sub-cultured at least once a
week, when reaching 70–80% confluence as described
below. Medium was discarded and cells were washed
with preheated phosphate buffered saline. Cells were
then incubated for a few minutes with a trypsin/EDTA
solution (Trypsin-EDTA 0.05%, Thermo Fisher Scientific) to cause cell detachment and cell suspension was
centrifuged at 1200 rpm for 5 min. Pelleted cells were
resuspended in fresh media and transferred into new
flasks. When setting up an experiment cells were
counted using a Neubauer hemocytometer and were
seeded in cell culture plates or dishes at the desired
dilution.
Sulphorhodamine B assay (SRB)
The SRB assay is a colorimetric cell density assay based
on the quantification of cellular protein content [48].
Cells were seeded in flat-bottom 96-well plates. After
48 h incubation, cells were treated with or without the
relevant treatment as indicated. STF31 and metformin
were obtained from Tocris Bioscience, 3PO from Merck
Millipore and oxamic acid from Sigma Aldrich.
IOM-1190 was provided by IOmet Pharma. The compound is example 187 in patent WO2014/187922 and
has an imidazo pyrazine core (gle.
com/patent/WO2014187922A1/en).
Cisplatin (Teva UK Limited) and paclitaxel (Actavis)
were obtained as formulated drugs. Stock solutions of
compounds were prepared in DMSO except for oxamic
acid and metformin which were dissolved in PBS. A
series of 10 dilutions with 1:2 steps of each inhibitor in
six replicates was applied. Once the treatment period
was completed, cell monolayers were fixed on the day of
treatment (Day 0 control) and on selected time points
thereafter with cold 25% trichloroacetic acid (TCA,
Sigma Aldrich). Then cell monolayers were stained with
0.4% SRB dye solution (Sigma Aldrich) and unbound excess dye was removed by 1% glacial acetic acid (VWR
International) washes. The protein bound stain was solubilised in 10 mM Tris buffer solution pH 10.5 (Sigma
Aldrich). Finally absorbance was measured at 540 nm
using a plate reader.
Measurements were corrected for background absorbance and values are presented as percentage of absorbance of untreated control. The half maximal inhibitory
concentration (IC50), indicating the concentration
needed to reduce cell viability by half, was used as a
quantitative indication of the effectiveness of each compound as a cancer cell growth inhibitor. IC50 values were
generated through sigmoidal concentration response
Xintaropoulou et al. BMC Cancer (2018) 18:636
Page 5 of 15
curves fitted using the XL fit tool within Microsoft
Excel.
Combinatorial treatments
In combination drug studies, glycolytic inhibitors were
assessed in combination with traditional drugs. For these
treatments a range of different concentrations of the
glycolytic inhibitor were combined with a constant fixed
concentration, around the IC20 or less, of the other drug.
Both drugs were delivered at the same time and cancer
cell proliferation was examined by the SRB assay after a
3-day treatment period. Concentration response curves of
each examined combination along with curves of the two
compounds as single agents were analysed using Calcusyn
Software (Biosoft). To quantitatively evaluate the effectiveness of each combination, CI values were generated for
each combination point indicating synergy, additivity or
antagonism [49]. CI values lower than 0.8 indicate synergy, values between 0.8 and 1.2 imply additivity while
values higher than 1.2 indicate antagonism [49].
Statistical analysis
Statistical tests were undertaken using GraphPad Prism
software version 6. Student’s t-test was used to compare
a GLUT1
7,915
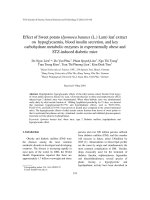
Expression of glycolytic enzymes in ovarian tumours and
association with histological subtypes and stage
To assess the variation in expression of key components
of the glycolytic pathway in ovarian cancers, expression
levels of GLUT1, HKII, PKM2 and LDHA were investigated in a series of 380 ovarian tumours by Automated
Quantitative Analysis (AQUA). A three label immunofluorescent protocol was used generating a quantitative
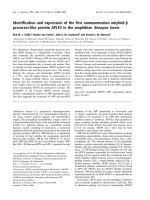
score for each tumour core. Representative immunofluorescence images illustrating the expression of the
four glycolytic targets in TMA cores of ovarian cancers
are shown in Fig. 1a-d. GLUT1 showed membrane as
well as cytoplasmic localisation while HKII, PKM2 and
LDHA demonstrated cytoplasmic localisation (Fig. 1a-d).
In Fig. 1e, the expression of the four proteins is shown
for an individual ovarian cancer case illustrating high
10,701
LDHA
2,395
6,134
e
7,267
13,638
PKM2
3,507
Results
d
b HKII
c
two groups and ANOVA followed by the Tukey
post-test was used to compare more than two groups.
For survival analysis, we undertook Kaplan Meier analysis using X-tile [50] which allows determination of the
minimal p-value using the Miller-Siegmund minimal P
correction.
7,143
GLUT1
HKII
9,102
3,200
PKM2
LDHA
2,169
5,800
Fig. 1 a-d. Representative immunofluorescence images showing GLUT1, HKII, PKM2 and LDHA expression in TMA cores of ovarian cancers. e.
Immunofluorescence images showing expression of four glycolytic enzymes in TMA cores of an individual ovarian cancer patient. Blue colour
visualises DAPI nuclear counterstain, green colour cytokeratin tumour mask and red colour target staining. Quantified target expression (AQUA
value) in the cytoplasmic compartment of each core is indicated
Xintaropoulou et al. BMC Cancer (2018) 18:636
expression for all four consistent with a glycolytic
phenotype.
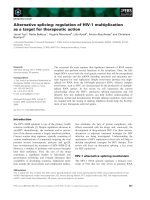
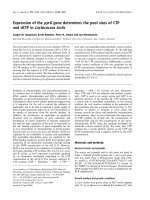
Associations between the level of expression of the
four molecules and the histological subtype of ovarian
cancer were then examined (Fig. 2). High-grade serous
ovarian cancer (HGSOC) accounts for approximately
70% of epithelial ovarian cancers [2] and was first compared with non-HGSOC disease. Mean expression of
GLUT1 was higher in HGSOC than in non-HGSOC
samples (P = 0.0011; t-test) (Fig. 2a). Similarly, HKII expression was higher in HGSOC than non-HGSOC (P =
0.031; t-test) and this was reflected in a difference between HGSOC and clear cell disease (P < 0.05; Tukey
test post ANOVA) (Fig. 2b). In contrast, LDHA expression was lower in HGSOC than in non-HGSOC (P =
0.022; t-test) and again this difference was reflected in
HGSOC being lower than clear cell (P < 0.01; Tukey test
post ANOVA) (Fig. 2c). For PKM2, there were no statistically significant differences between the histological
subtypes (Fig. 2d).
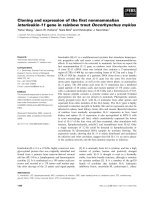
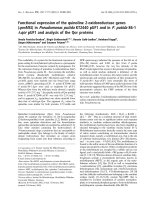
When stage of disease was analysed, GLUT1 expression was higher in advanced disease (stages III/IV) than
AQUA SCORE
AQUA SCORE
p = 0.022 (HGSOC vs rest)
p = 0.031(HGSOC vs rest)
AQUA SCORE
b
p = 0.0011 (HGSOC vs rest)
c
early disease (stages I/II) (P = 0.023; t-test) (Fig. 3a). In
contrast, LDHA expression was lower in Stage IV than
stage I disease (P < 0.05; Tukey test post ANOVA)
(Fig. 3c) while no obvious differences emerged for
HKII or PKM2. Analysis of the HGSOC group alone
indicated no differences in expression between advanced and early stage HGSOC (data not shown).
Analysis of patient survival using x-Tile optimal
cut-point analysis [50] showed no significant differences in survival with varying expression levels of the
four molecules in any of the HGSOC, endometrioid
or clear cell cancer groups (data not shown).
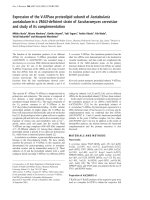
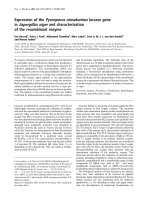
A heatmap correlating the expression of the four examined glycolytic enzymes across the dataset is shown
in Fig. 4a. Spearman non-parametric correlation was
performed and the correlation heatmap was generated
using TMA Navigator [43]. The expression of the four
targets across the ovarian cancers gave positive rho correlation values when compared to each other. Based on
the dendrogram, LDHA expression appeared more
closely correlated with PKM2 expression; in contrast
HKII expression was more distant to the expression of
d
AQUA SCORE
a
Page 6 of 15
Fig. 2 Expression levels of four glycolytic enzymes in different histological subtypes of ovarian cancer. AQUA levels of a) GLUT1, b) HKII, c) LDHA
and d) PKM2 are shown. Values were measured as described in Methods section. The boxplot shows the median value, with the rectangle
representing the 2nd and 3rd quartiles. Statistical significance indicated (Student’s t-test)
Xintaropoulou et al. BMC Cancer (2018) 18:636
Page 7 of 15
p = 0.023 (I/IIvs III/IV)
b
d
AQUA SCORE
AQUA SCORE
c
AQUA SCORE
AQUA SCORE
a
Fig. 3 Expression levels of four glycolytic enzymes in different stages of ovarian cancer. AQUA levels of a) GLUT1, b) HKII, c) LDHA and d) PKM2
are shown. Values were measured as described in Methods section. The boxplot shows the median value, with the rectangle representing the
2nd and 3rd quartiles
the other three markers. Spearman correlation network
analysis was conducted to further interpret the relationship between the glycolytic markers and evaluate their
associations. The correlation network of expression of
the four glycolytic enzymes is presented in Fig. 4b. Significant relationships (FDR P < 0.01) are drawn as lines
that connect pairs of markers. Thickness of connection
lines reflects significance and positive significant relationships are displayed in grey colour. The colour of
each marker indicates the number of significant connections. High number of significant connections is
displayed in yellow colour while low in blue. The
correlation values (FDR P < 0.01) are summarised in
Additional file 3: Table S2.
and OVCAR3 are of HGSOC origin [45] while
TOV112D is of endometrioid cancer origin [46].
OVCAR5 and CAOV3 cells were unable to proliferate
when cultured in the absence of glucose for five days;
0.2 mM of glucose was required for significant growth of
OVCAR5 cells with higher concentrations leading to
higher growth rate until a plateau was reached at
1.6 mM glucose. CAOV3 cells demonstrated significant
growth, in comparison to the control samples, when cultured in a minimum of 0.4 mM glucose. In contrast,
OVCAR3 and TOV211D cells showed a threefold increase in their cell number in the absence of glucose
however were still able to grow more rapidly in the presence of added glucose (Fig. 5).
The effect of glucose on cell growth of a panel of ovarian
cancer cell lines
The effect of glycolytic inhibitors on cell growth of
chemosensitive and chemoresistant HGSOC ovarian
cancer cell lines
To assess the growth dependence of ovarian cancer cells
on glucose, the proliferation of a small panel of ovarian
cancer cell lines was monitored under a range of glucose
concentrations after a 5-day incubation period. Growth
was compared with controls in medium without glucose.
Fig. 5 illustrates the average optical density value generated via SRB assay (indicative of cell number) against
increasing concentration of glucose. OVCAR5, CAOV3
PEA1 / PEA2 and PEO1 / PEO4 are two pairs of cancer
cell lines established from two individual patients with
HGSOC [47]. The first cell line of each pair is platinum
sensitive (PEA1 and PE01 respectively) while the second
line (PEA2 and PE04 respectively) was acquired after platinum resistance had developed within the patient [47, 48].
Four glycolytic inhibitors (IOM-1190, STF31, 3PO and
Xintaropoulou et al. BMC Cancer (2018) 18:636
Page 8 of 15
a
HKII
GLUT1
LDHA
PKM2
b
Fig. 4 Heatmap and correlation network analysis of the expression of four glycolytic enzymes in a cohort of 380 ovarian cancers. a. Heatmap
showing the positive Spearman rho correlation values displayed in bright yellow colours and the negative Spearman rho correlation values in
dark blue colours. The heatmap was generated using TMA Navigator [42]. b: Spearman correlation network of the four glycolytic enzymes in the
cohort. Statistically significant correlations thresholded at FDR P < 0.01 are presented. High number of significant connections is displayed in
bright yellow colours while low in dark blue colours. Positive relationships are indicated in grey while negative in red. Thickness of connection
lines reflects significance (the adjusted P value). The network was generated using TMA Navigator [42]
oxamic acid) were investigated against these ovarian cancer cell line pairs (Fig. 6) and IC50 concentrations are
listed in Table 1. These inhibitors were selected based on
interest in targeting GLUT1 at the top and LDHA at the
bottom of the pathway and also on preliminary evidence
that the PFKFB3 inhibitor, 3PO, had interesting combinatorial activity in pilot experiments.
IOM-1190 is a novel specific GLUT1 inhibitor [22] and
attenuated cell proliferation of both chemosensitive and
chemoresistant cell lines. PEA1 had an IC50 value equal to
280 nM and PEA2 equal to 460 nM. In contrast, the
PEO4 platinum-resistant cell line presented greater sensitivity having a threefold lower IC50 value (equal to 1.6μΜ)
compared to the platinum sensitive PEO1 cell line (4.8
μΜ). STF31, another GLUT1 inhibitor [21] had similar inhibitory activity against both cell lines of each pair. Although also reported as an NAMPT inhibitor [51], it
reassuringly had a pattern of activity similar to that of
IOM-1190. The PEA2 cell line was slightly more resistant
to STF31 compared to its paired platinum naïve line
PEA1, with IC50 values of 1.3μΜ and 0.9μΜ respectively.
In contrast, the platinum-resistant line PEO4, having an
IC50 value of 0.9μΜ, showed increased sensitivity to the
inhibitor compared to its paired platinum-sensitive line
PEO1, with an IC50 value of 1.5μΜ. 3PO is a recently
identified PFKFB3 inhibitor [27]. Sensitivity to 3PO coincided with platinum sensitivity. Both platinum resistant
cell lines (PEA2 and PE04) presented greater resistance to
3PO compared to their platinum sensitive paired cell lines
with twofold higher IC50 value. Oxamic acid is an established LDH inhibitor [34–37]. The first ovarian cancer cell
line pair responded similarly to this agent with an almost identical IC50 value of 16 mM. Regarding the
second pair, the PEO4 platinum resistant cell line
proved to be more resistant to oxamic acid, having an
IC50 value threefold higher than the corresponding
value of PEO1 (Table 1). These results indicate that,
in general, platinum-resistant disease has comparable
Xintaropoulou et al. BMC Cancer (2018) 18:636
Page 9 of 15
2.0
1.5
OVCAR5
***
***
***
1.0
***
***
0.5
CAOV3
***
Average OD value
Average OD value
***
***
0.0
***
**
ns
0.5
0.0
Glucose Concentration, mM
***
***
***
***
*
TOV112D
***
2.5
ns
0.6
**
0.2
Average OD value
OVCAR3
***
Average OD value
***
***
1.0
3.0
0.4
***
1.5
Glucose Concentration, mM
0.8
***
***
***
***
***
***
2.0
***
1.5
***
**
1.0
0.5
0.0
0.0
Glucose Concentration, mM
Glucose Concentration, mM
Fig. 5 Growth response of a panel of four ovarian cancer cell lines in the presence of varying concentrations of glucose. Glucose concentrations
between 0 and 25.6mΜ were evaluated and cells grown for a 5-day period. Optical density was determined by an SRB assay. Mean results of 6
replicates are reported and error bars represent standard deviations. Faint coloration at the bottom of the columns represents OD value on the
day of treatment (Day 0). Statistical significance indications: ns not significant P > 0.05, * P < 0.05, ** P < 0.01, *** P < 0.001 compared with the
mean of the depleted controls (one-way ANOVA followed by Tukey-Kramer multiple comparisons test)
sensitivity to these glycolysis inhibitors when compared to chemo-sensitive disease.
The PFKFB3 inhibitor, 3PO, potentiated the
antiproliferative effect of cisplatin and paclitaxel in
ovarian cancer cells
Combinations of the PFKFB3 inhibitor, 3PO, with cisplatin and paclitaxel were next investigated against the
paired cell lines. 3PO was able to enhance the effect of
cisplatin in both the chemosensitive PEA1 and chemoresistant PEA2 cell lines. A range of different concentrations of 3PO were used in combination with a constant
fixed concentration (around the IC20), of the cytotoxic
drug; hence in PEA2 cells, 4μΜ of cisplatin was required
to produce a similar inhibitory effect in cell number to
that of 1μΜ cisplatin on PEA1 cells. Both drugs were
delivered at the same time and cancer cell proliferation
was examined by the SRB assay after a 3-day treatment
period. Combination Index values (CI) were generated
for each combination point, using Calcusyn software,
providing a quantitative evaluation of the combination
efficacy. Concentrations at which synergistic interactions
(CI values lower than 0.8) between the two compounds
were identified are indicated by asterisks in Fig. 7a. The
combination of 3PO with paclitaxel was also effective in
inhibiting growth of the PEA1 and PEA2 cell lines, generating low CI values for all 3PO concentrations used
(Fig. 7b). These drug combinations were similarly effective for the other examined ovarian cancer cell line pair
PEO1 and PEO4 and also demonstrated synergistic activity (Additional file 4: Fig. S1).
Metformin potentiated the antiproliferative effect of
glycolytic inhibitors on ovarian cancer cells
We have previously reported promising combinatorial
activity between metformin and STF31 or oxamic acid
in a breast cancer cell line [40]. Metformin inhibits the
mitochondrial respiratory chain complex I and
Xintaropoulou et al. BMC Cancer (2018) 18:636
120
100
IOM-1190
% Cell Number
% Cell Number
% Cell Number
80
60
60
40
40
20
20
0
0
0.1
1
10
100
PEO1
0.1
120
10
0.1
20
1
10
100
0
0.01
1
10
STF31 Concentration, μM
% Cell Number
PEA1
PEA2
20
0.1
1
10
3PO Concentration, μM
100
PEO1
PEO4
0.1
1
10
STF31 Concentration, μM
100
Oxamic acid
100
40
0
40
120
Oxamic acid
60
PEO1
PEO4
60
0
0.01
100
80
40
PEA1
PEA2
0.1
80
20
100
60
40
PEA1
PEA2
120
3PO
80
60
3PO Concentration, μM
0
0.01
100
% Cell Number
% Cell Number
1
100
80
0
0.01
40
20
120
3PO
100
20
60
IOM-1190 Concentration, μM
STF31
100
80
PEO4
IOM-1190 Concentration, μM
120
STF31
100
% Cell Number
PEA1
PEA2
IOM-1190
80
% Cell Number
100
Page 10 of 15
0.1
1
80
60
40
PEO1
PEO4
20
10
Oxamic acid Concentration, mM
100
0
0.1
1
10
Oxamic acid Concentration, mM
100
Fig. 6 Growth response curves of ovarian cancer cell line pairs treated with glycolysis inhibitors. IOM-1190 was used at concentrations between
0.2-100μΜ, STF31 and 3PO at concentrations between 0.06-30μΜ and oxamic acid at concentrations between 0.4-100mΜ for a 4-day period. Cell
viability was determined by an SRB assay. Mean results of 6 replicates are reported and error bars represent standard deviations. Values are shown
as a percentage of control. A constant 1% DMSO concentration was used across the whole curve for IOM-1190 and a respective constant 0.3%
DMSO concentration for STF31 and 3PO. IC50 concentrations are listed in Table 1
combination with a glycolytic inhibitor will result in
more complete depletion of cellular ATP. The effect of
either STF31 or oxamic acid on both chemosensitive
and chemoresistant ovarian cancer cell lines was markedly enhanced by metformin (Fig. 7c). Strong synergy at
the level of a CI value equal to 0.1 was demonstrated for
both cell lines. These drug interactions were similarly effective for the other examined ovarian cancer cell line
pair (PEO1-PEO4, Additional file 4: Fig. S1C).
Discussion
There is continued interest in the potential of targeting
the glycolytic pathway as a therapeutic strategy for cancer treatment [15, 17, 45, 46]. In this study we evaluated
the relative expression of several glycolytic markers
across a large cohort of clinical ovarian tumours by use
of in situ immunofluorescence staining. We are not
aware of any previous study which has reported the
expression of multiple glycolytic enzymes in ovarian
tumours and certainly none that include a cohort of
this size.
Table 1 IC50 concentrations for glycolysis inhibitors against the
PEA1/PEA2 and PE01/PE04 pairs of HGSOC cell lines
IC50 values
1st pair
PEA1
2nd pair
PEA2
PEO1
PEO4
IOM-1190 (μM)
0.28
0.46
4.8
1.6
STF31 (μM)
0.86
1.3
1.5
0.88
3PO (μM)
6.3
11.9
3
6.8
Oxamic acid (mM)
16
17.6
3.8
10.1
Analysis of histological subtype indicated higher expression of GLUT1 in HGSOC, the most frequently occurring form of epithelial ovarian cancer. Previous
studies in small series of tumours have demonstrated increasing GLUT1 expression when comparing ovarian
benign and borderline tumours to malignant ovarian
adenocarcinomas and this transporter has been
suggested as a potential marker of ovarian malignancy
[52–54]. Our data is in line with a number of studies
which have documented elevated GLUT1 expression in
serous adenocarcinomas [53, 55–57]. Significantly higher
GLUT1 expression was detected in advanced stage (III/
IV) tumours compared to early stage (I/II) cancers. This
is consistent with a previous report of increased GLUT1
expression being higher in advanced stage ovarian tumours [55]. GLUT1 has been proposed as a marker of
adverse prognosis in ovarian cancer, however we did not
observe an effect on survival in this cohort of patients
[57]. Cantuaria et al. associated GLUT1 overexpression
with poor disease free survival rate in 89 advanced stage
ovarian carcinomas [58] while Semaan et al. demonstrated that high GLUT1 expression had a negative impact on the overall survival of 213 ovarian cancer
patients [56]. Consistent with these reports, Cho et al.
described a reverse statistically significant association
among overall survival of 50 patients and high
GLUT1 expression [57]. Enhanced tracer [F-18]-fluorodeoxyglucose (FDG) uptake, quantified by PET, has
been shown to relate to increased GLUT1 expression
in ovarian cancer and was related to increased cellular proliferation [59].
Xintaropoulou et al. BMC Cancer (2018) 18:636
Page 11 of 15
c
a
60
** *
40
*
3PO
3PO & 1µM Cisplatin
20
*
80
*
60
40
*
3PO & 4µM Cisplatin
1
10
0.1
3PO Concentration, µM
1
10
3PO Concentration, µM
STF31 & 1mM Metformin
60
1mM Metformin
40
0.1
100
** ****
*
1
10
80
**
60
40
STF31
20
1mM Metformin
0
100
0.1
STF31 Concentration, µM
** **
*
STF31 & 1mM Metformin
1
10
STF31 Concentration, µM
100
d
120
PEA1 - 3PO & Paclitaxel
% Cell Number
100
80
** *
**
60
40
*
3PO
3PO & 1nM Paclitaxel
20
0.1
1
80
** *
60
40
*
*
*
3PO
3PO & 2nM Paclitaxel
20
100
0.1
1
10
100
3PO Concentration, µM
120
PEA2 - Oxamic acid & Metformin
100
Oxamic acid
80
Oxamic acid &
1mM Metformin
1mM Metformin
60
40
**
20
**
**
**
*
1
10
*
80
**
60
Oxamic acid
*
**
40
Oxamic acid & 1mM
Metformin
1mM Metformin
20
**
0
0
0
10
3PO Concentration, µM
PEA1 - Oxamic acid & Metformin
100
100
2nM Paclitaxel
1nM Paclitaxel
0
120
PEA2 - 3PO & Paclitaxel
% Cell Number
120
% Cell Number
b
% Cell Number
STF31
80
0
0
100
PEA2 - STF31 Metformin
100
20
4µM Cisplatin
1µM Cisplatin
0.1
*
3PO
20
0
120
100
% Cell Number
% Cell Number
80
PEA1 - STF31 & Metformin
120
100
100
% Cell Number
PEA2 - 3PO & Cisplatin
120
% Cell Number
PEA1 - 3PO & Cisplatin
120
100
Oxamic acid Concentration, mM
1
10
100
Oxamic acid Concentration, mM
Fig. 7 Growth response curves of PEA1 and PEA2 ovarian cancer cells treated with combinations of glycolysis inhibitors with chemotherapy or
metformin. a. 3PO with cisplatin. 3PO concentrations between 0.5-30μΜ alone (blue line) or combined with a constant concentration of cisplatin
(red line) were evaluated. In green the effect of 1μΜ (PEA1) or 4μΜ (PEA2) cisplatin on cell viability is presented. b. 3PO with paclitaxel. 3PO
concentrations between 0.5-30μΜ alone (blue line) or combined with a constant concentration of paclitaxel (red line) were evaluated. In green
the effect of 1μΜ (PEA1) or 2μΜ (PEA2) paclitaxel on cell viability is presented. c. STF31 with metformin. Concentration response curves of PEA1
and PEA2 ovarian cancer cells treated with STF31 concentrations between 0.5-30μΜ alone (blue line) or combined with 1 mM metformin (red
line). In green the effect of 1 mM metformin on cell viability is presented. d. Oxamic acid with metformin. Concentration response curves of PEA1
and PEA2 ovarian cancer cells treated with oxamic acid concentrations between 1.56-100mΜ alone (blue line) or combined with 1 mM metformin
(red line). In green the effect of 1 mM metformin on cell viability is presented. Cell viability was determined by an SRB assay after a 3-day treatment.
Mean results of 6 replicates are reported and error bars represent standard deviations. Values are shown as a percentage of control. Asterisks indicate
synergistic combination points with *CI value lower than 0.8 and **CI value lower than 0.3
As for GLUT1, we observed that HKII was increased in
HGSOC relative to non-HGSOC. The mitochondrial-bound
HKII is the predominant isoform expressed in many tumours. Increased HKII expression has been noted in ovarian
cancer for malignant tumours compared to benign and borderline tumours and increased HKII expression in serous
carcinomas was found compared to non-serous tumours
[60]. Suh et al. examined HKII expression by IHC in 111
ovarian tumours and documented that high HKII was correlated with chemoresistance and disease recurrence as well
as decreased progression free survival [61].
The dependence of ovarian cancer cell growth on glucose was next assessed by investigating the effect of
varying glucose concentration in culture. The mean
physiological level of glucose in the plasma is approximately 5 mM, with a maximum concentration of 9 mM
after eating and a minimum of 3 mM following physical
exercise or moderate fasting [62]. Frequently the concentration of glucose in malignant tissues is significantly
lower (up to 10 fold) than their normal counterparts in
consequence of augmented glucose consumption and
abnormal tumour microvasculature [63]. The ovarian
cancer cell lines demonstrated differential ability to grow
in the absence of glucose. TOV112D and OVCAR3 were
both able to increase their cell number up to threefold
in glucose depleted conditions while in contrast
OVCAR5 and CAOV3 were unable to grow when glucose was not present in the culture medium (Fig. 5). For
CAOV3 cells, a relatively high concentration equal to
0.4 mM was required for significant growth. Interestingly OVCAR5, TOV112D and CAOV3 cells reached a
plateau of maximal growth at 1.6 mM glucose. In contrast, OVCAR3 cells demonstrated optimal growth when
cultured in a low glucose environment of 0.4 mM. Glucose deprivation has been extensively associated with
oxidative stress [64, 65]. Aykin-Burns et al. attributed
the increased sensitivity of breast cancer cells to glucose
withdrawal (and subsequently to glucose inhibition)
compared to normal mammary epithelial cells, to the
pro-oxidant status mediated by elevated ROS production [65]. In line with these findings Graham et al.
also confirmed the association between the metabolic
reconfiguration of tumours and increased sensitivity
to glucose deprivation. They linked glucose depletion
with elevated tyrosine kinase signalling and ROS mediated cell death [66].
In a previous report, we provided evidence that nine
compounds targeting key components of the glycolytic
pathway inhibited cancer cell proliferation in a
concentration-dependent manner [40]. To explore this
Xintaropoulou et al. BMC Cancer (2018) 18:636
further, the effects of several inhibitors targeting key enzymes of the glycolytic pathway were investigated against
paired chemosensitive/chemoresistant HGSOC cell line
models. Recent evidence has associated drug resistance
with an elevated dependency on the glycolytic phenotype
however much less is known as to whether glycolysis inhibition could be exploited against resistant disease [67].
Targeting three major components of glycolysis proved effective in attenuating ovarian cancer cell proliferation in a
concentration-dependent manner regardless of platinum
sensitivity. The recently developed agents, IOM-1190,
STF31 and 3PO were considerably more potent in inhibiting cancer cell proliferation compared to the more established oxamic acid that required concentrations in the
millimolar concentration range (Table 1).
Currently, the administration of antitumour therapy
generally involves combinatorial strategies of several
therapeutic agents. Drug combinations aim to augment
the therapeutic benefit, reduce the adverse effects and
delay or ideally hinder resistance. Resistance to common
chemotherapeutic agents has been associated with the
deregulated reliance of tumours on the glycolytic pathway. It has been suggested that targeting the metabolic
phenotype of tumours may enhance the efficacy of
chemotherapy regimens and moreover resensitise
tumour cells to treatment to which they had developed
resistance [39, 40]. Possible proposed mechanisms predict glycolysis inhibition reducing cellular ATP levels
and compromising the activation of resistance pathways
or attenuating tumour growth promoting induction of
apoptosis and hindering the adaptation to chemotherapeutic treatment [39, 40].
Platinum-based drugs are the most widely used agents
for the treatment of ovarian cancer however
platinum-refractory disease frequently develops and
hence combinatorial treatments with other antitumour
agents are currently under investigation, aiming to alleviate adverse effects and overcome resistance [68]. We
observed that the PFKFB3 inhibitor 3PO significantly
enhanced the cytotoxic effect of cisplatin against both
platinum sensitive and platinum resistant ovarian cancer
cells. This supports the view that combinatorial treatment of cisplatin with 3PO could reverse the platinum
resistant phenotype and may be an effective strategy
against platinum-resistant ovarian tumours. It should be
noted that the concentrations of the two drugs that gave
the lowest CI values are relatively low and potentially
achievable in in vivo experiments. Paclitaxel (given
3-weekly) along with carboplatin is the other first line
treatment for ovarian cancer. In addition, paclitaxel is
also often used in a weekly schedule in platinum resistant disease. 3PO combined with paclitaxel produced
synergistic anticancer action on ovarian cancer cells.
Both PEA1 and PEA2 cell lines were very sensitive to
Page 12 of 15
this combination and the effectiveness of this combination especially for the resistant PEA2 line suggests that
this combination might have in vivo potential.
To date a number of studies have revealed that certain
compounds targeting the glycolytic metabolism of tumours might improve the therapeutic index of chemotherapeutic cytotoxic agents mainly through reduction
of the ATP levels selectively in malignant cells [39, 40].
Similar to this study’s observations Liu et al. reported
synergistic antitumour action between the GLUT1 inhibitor WZB117 and cisplatin or paclitaxel [69]. Another
glucose transport inhibitor, the phytochemical Phloretin,
has been shown to potentiate the cytotoxic effect of
daunorubicin promoting apoptosis and also sensitised
resistant leukaemia and colon cancer cells to the anthracycline exclusively under hypoxic conditions [70].
Nakano et al. documented that the HKII inhibitor 3BP
enhanced the anticancer effects of daunorubicin and
doxorubicin in leukaemia and myeloma cells both in
vitro and in vivo. The glycolytic inhibitor diminished the
cellular ATP levels which led to inactivation of the
ATP-binding cassette transporters (ABC) therefore preventing the agent’s efflux from malignant cells [71].
Metformin is a biguanide widely used for the treatment
of type 2 diabetes mellitus. The drug reduces insulin resistance and blood glucose levels through inhibition of
mitochondrial respiratory chain complex 1 leading to reduced ATP production and subsequently provoking
AMPK activation and mTOR inhibition [72, 73]. A considerable number of epidemiologic meta-analyses have associated metformin with a decreased incidence of several
malignancies as well as with improved clinical outcome
and reduced cancer-related mortality of diabetic cancer
patients. Anti-proliferative action has been extensively
demonstrated in preclinical studies in several types of cancer [71–76] and metformin is an attractive candidate for
combinatorial cancer treatment. Experimentally, metformin enhanced the cytotoxic effect of several agents including cisplatin, paclitaxel and doxorubicin [72, 77, 78].
Metformin is currently being assessed in numerous clinical trials in various cancer types as chemoprevention,
monotherapy or in combination with several chemotherapeutic agents [72–76, 79]. However, to date little attention
has been paid to a possible interaction among glycolytic
inhibitors and the antidiabetic drug. We previously reported a beneficial interaction between the glycolytic inhibitors STF31 and oxamic acid when combined with
metformin in a triple negative breast cancer cell line
model [40]. In the present study, we observed that metformin augmented STF31 and oxamic acid-induced cytotoxicity in both platinum sensitive and platinum resistant
ovarian cancer cells. It was observed that while low concentrations of the antidiabetic drug and the glycolytic inhibitors had only marginal effects on the growth of
Xintaropoulou et al. BMC Cancer (2018) 18:636
ovarian cancer cell lines, in combination they induced a
marked antitumour effect characterised by low synergistic
CI values. This data extends our previous findings obtained in a breast cancer model [40] and provides further
evidence that suggests that dual inhibition of the two energy pathways might be a promising antitumour therapeutic strategy for ovarian, as well as breast, cancer.
Further research should now be undertaken to validate
these promising in vitro pilot data and investigate their in
vivo therapeutic potential.
Conclusions
To the best of our knowledge this is the first study
evaluating the expression of a series of glycolytic enzymes in a large cohort of ovarian tumours. We observed that HGSOC and advanced stage tumours
frequently express higher levels of GLUT1 and HKII, the
initial components of the pathway. Cell lines from
HGSOC that are resistant to cytotoxic treatment retain
comparable sensitivity to glycolytic inhibitors. Combination of glycolytic inhibitors with chemotherapy can produce significantly increased growth inhibition. This
study supports further consideration of the use of glycolytic inhibitors for the treatment of ovarian cancer.
Additional files
Additional file 1: Table S1. Number of ovarian cancer samples analysed
by histology and stage. (DOCX 21 kb)
Additional file 2: TMA dataset. Mean AQUA expression values for GLUT1,
LDHA, HKII and PKM2 in 380 ovarian cancer samples. Histology and stage
are shown for individual tumours. (XLSX 77 kb)
Additional file 3: Table S2. Spearman correlation of the expression of
four glycolytic enzymes in a cohort of 380 ovarian cancers. Spearman rho
correlation values (top value) along with the respective adjusted P value
(bottom value) of statistically significant correlations thresholded at FDR
P < 0.01 are summarised. (DOCX 21 kb)
Additional file 4: Figure S1. Growth response curves of PE01 and PE04
ovarian cancer cells treated with combinations of glycolysis inhibitors with
chemotherapy or metformin. A. 3PO with cisplatin. 3PO concentrations
between 0.5-30μΜ alone (blue line) or combined with a constant
concentration of cisplatin (red line) were evaluated. In green the effect of
0.5μΜ (PE01) or 1μΜ (PE04) cisplatin on cell viability is presented. B. 3PO
with paclitaxel. 3PO concentrations between 0.5-30μΜ alone (blue line) or
combined with a constant concentration of paclitaxel (red line) were
evaluated. In green the effect of 2μΜ paclitaxel (both PE01 and PE04) on
cell viability is presented. C. Oxamic acid with metformin. Concentration
response curves of PE01 and PE04 ovarian cancer cells treated with oxamic
acid concentrations between 1.56-100mΜ alone (blue line) or combined
with 2 mM (PE01) or 0.5 mM (PE04) metformin (red line). In green the effect
of 2 mM (PE01) or 0.5 mM (PE04) mM metformin on cell viability is
presented. Cell viability was determined by an SRB assay after a 3-day
treatment. Mean results of 6 replicates are reported and error bars represent
standard deviations. Values are shown as a percentage of control. Asterisks
indicate synergistic combination points with * CI value lower than 0.8 and
** CI value lower than 0.3. (PPTX 1444 kb)
Abbreviations
2-DG: 2-Deoxy-D-glucose; 3PO: 3-(3-Pyridinyl)-1-(4-pyridinyl)-2-propen-1-one;
AQUA: Automated quantitative analysis; CI: Combination index; Cy3: Cyanine
3; DAPI: 4′,6-diamidino-2-phenylindole; DMEM: Dulbecco’s modified Eagle’s
Page 13 of 15
medium; EDTA: Ethylenediaminetetraacetic acid; FBS: Fetal bovine serum;
FDR: False discovery rate; GLUT1: Glucose transporter 1; HGSOC: High grade
serous ovarian cancer; HKII: Hexokinase II; IC50: Half maximal inhibitory
concentration; IHC: Immunohistochemistry; IOM-1190: IOmet 1190; LDHA: Lactate
dehydrogenase A; PBS: Phosphate buffered saline; PEP: Phosphoenolpyruvate;
PET: Positron emission tomography; PFK1: Phosphofructokinase 1; PFKFB3:
6-phosphofructo-2-kinase/fructose-2,6-biphosphatase 3; PKM2: M2 isozyme
of pyruvate kinase; ROS: Reactive oxygen species; SRB: Sulphorhodamine B;
STF31: 4-[[[[4-(1,1-Dimethylethyl)phenyl]sulfonyl] amino] methyl]-N-3pyridinylbenzamide; STR: Short tandem repeat profiling; TCA: Trichloroacetic
acid; TMA: Tissue microarray
Acknowledgements
We thank ECMC for access to the tissue microarrays and the Edinburgh Ovarian
Cancer Database for help with the data collection.
Funding
We are grateful to Medical Research Scotland and METOXIA (HEALTHF2–2009-222741) for support of the present study. The funding bodies
did not influence the study design, manuscript preparation, data collection,
analysis or interpretation.
Availability of data and materials
All data generated or analysed during this study are included in this published
article and its supplementary information files.
Authors’ contributions
CX and SQ were responsible for data collection and analysis; CX and SPL
drafted the manuscript; CX, CW, AW and SPL participated in the design of
the study; AT participated in the bioinformatics analysis; CG, COM, TR and
ARW contributed to the design of the tissue microarray. All authors read
and approved the manuscript.
Ethics approval and consent to participate
No informed consent (written or verbal) was obtained for use of retrospective
tissue samples from the patients within this study, most of whom were
deceased, since this was not deemed necessary by the Ethics Committee.
Ethical approval for the use of tumour material and correlation with associated
clinical data was obtained from South East Scotland Human Annotated
Bioresource (East of Scotland Research Ethics Service Reference 15/ES/
0094). Under the Human Tissue (Scotland) Act 2006, established human
cell lines are not considered relevant material as all the original cells
from the person have been replaced by cells that have divided and
therefore have been created outside the human body. As such their use
in this research study did not require authorisation (consent) or ethical approval.
Competing interests
AW is an employee of IOmet Pharma.
The authors declare that they have no competing interests.
Publisher’s Note
Springer Nature remains neutral with regard to jurisdictional claims in published
maps and institutional affiliations.
Author details
1
Cancer Research UK Edinburgh Centre and Division of Pathology
Laboratory, Institute of Genetics and Molecular Medicine, University of
Edinburgh, Edinburgh EH4 2XU, UK. 2The Royal (Dick) School of Veterinary
Studies and Roslin Institute, Easter Bush, Roslin, Midlothian EH25 9RG, UK.
3
IOmet Pharma (a wholly owned subsidiary of Merck & Co., Inc., Kenilworth,
NJ USA, known as MSD outside the United States and Canada) Nine
Edinburgh Bioquarter, Little France Road, Edinburgh EH16 4UX, UK. 4Cancer
Research UK Edinburgh Centre, Institute of Genetics and Molecular Medicine,
University of Edinburgh, Edinburgh EH4 2XU, UK. 5Division of Pathology,
University of Edinburgh Medical School, 51 Little France Crescent, Edinburgh
EH16 4SA, UK.
Xintaropoulou et al. BMC Cancer (2018) 18:636
Received: 10 November 2017 Accepted: 18 May 2018
References
1. Ferlay J, Soerjomataram I, Ervik M, Dikshit R, Eser S, Mathers C, Rebelo M,
Parkin DM, Forman D, Bray F. GLOBOCAN 2012 v1.1, Cancer incidence and
mortality worldwide: IARC CancerBase no. 11 [internet]. Lyon: International
Agency for Research on Cancer; 2014.
2. Hollis RL, Gourley C. Genetic and molecular changes in ovarian cancer.
Cancer Biology and Medicine. 2016;13:236–47.
3. Hsu PP, Sabatini DM. Cancer cell metabolism: Warburg and beyond. Cell.
2008;134:703–7.
4. Hanahan D, Weinberg RA. Hallmarks of cancer: the next generation. Cell.
2011;144:646–74.
5. Ward PS, Thompson CB. Metabolic reprogramming: a Cancer Hallmark even
Warburg did not anticipate. Cancer Cell. 2012;21:297–308.
6. Yeluri S, Madhok B, Prasad KR, Quirke P, Jayne DG. Cancer’s craving for sugar: an
opportunity for clinical exploitation. J Cancer Res Clin Oncol. 2009;135:867–77.
7. Gatenby RA, Gillies RJ. Why do cancers have high aerobic glycolysis? Nat
Rev Cancer. 2004;4:891–9.
8. DeBerardinis RJ, Lum JJ, Hatzivassiliou G, Thompson CB. The biology of
Cancer: metabolic reprogramming fuels cell growth and proliferation. Cell
Metab. 2008;7:11–20.
9. Heiden MGV, Cantley LC, Thompson CB. Understanding the Warburg effect:
the metabolic requirements of cell proliferation. Science. 2009;324:1029–33.
10. Granchi C, Fancelli D, Minutolo F. An update on therapeutic opportunities
offered by cancer glycolytic metabolism. Bioorganic and Medicinal
Chemistry Letters. 2014;24:4915–25.
11. Chen Z, Lu W, Garcia-Prieto C, Huang P. The Warburg effect and its cancer
therapeutic implications. J Bioenerg Biomembr. 2007;39:267–74.
12. Pelicano H, Martin DS, Xu RH, Huang P. Glycolysis inhibition for anticancer
treatment. Oncogene. 2006;25:4633–46.
13. Madhok BM, Yeluri S, Perry SL, Hughes TA, Jayne DG. Targeting glucose
metabolism: an emerging concept for anticancer therapy. Am J Clin Oncol.
2011;34:628–35.
14. Gatenby RA, Gillies RJ. Glycolysis in cancer: a potential target for therapy. Int
J Biochem Cell Biol. 2007;39:1358–66.
15. Zhao Y, Liu H, Riker AI, Fodstad O, Ledoux SP, Wilson GL, Tan M. Emerging
metabolic targets in cancer therapy. Front Biosci. 2011;16:1844–60.
16. Tennant DA, Durán RV, Gottlieb E. Targeting metabolic transformation for
cancer therapy. Nat Rev Cancer. 2010;10:267–77.
17. Vander Heiden MG. Targeting cancer metabolism: a therapeutic window
opens. Nat Rev Drug Discov. 2011;10:671–84.
18. Macheda ML, Rogers S, Best JD. Molecular and cellular regulation of glucose
transporter (GLUT) proteins in cancer. J Cell Physiol. 2005;202:654–62.
19. Szablewski L. Expression of glucose transporters in cancers. Biochimica et
Biophysica Acta - Reviews on Cancer. 2013;1835:164–9.
20. Aparicio LA, Calvo MB, Figueroa A, Pulido EG, Campelo RG. Potential role of
sugar transporters in cancer and their relationship with anticancer therapy.
Int J Endocrinol. 2010;2010:20537.
21. Chan DA, Sutphin PD, Nguyen P, Turcotte S, Lai EW, Banh A, Reynolds GE,
Chi JT, Wu J, Solow-Cordero DE, Bonnet M, Flanagan JU, Bouley DM, et al.
Targeting GLUT1 and the Warburg effect in renal cell carcinoma by
chemical synthetic lethality. Sci Transl Med. 2011;3:94ra70.
22. Bhattacharya B, Mann SS, Han MJ, Low SHH, Tan GH, McGuinness BE, Trewick
SC, Cowley PM, Wise A, Soong R. Identification and activity of novel GLUT1
inhibitors in hepatocellular carcinoma. Cancer Res. 2016;76(14 Suppl):1283.
23. Mathupala SP, Ko YH, Hexokinase PPL II. Cancer’s double-edged sword
acting as both facilitator and gatekeeper of malignancy when bound to
mitochondria. Oncogene. 2006;25:4777–86.
24. Pedersen PL, Mathupala S, Rempel A, Geschwind JF, Ko YH. Mitochondrial
bound type II hexokinase: a key player in the growth and survival of many
cancers and an ideal prospect for therapeutic intervention. Biochim Biophys
Acta-Bioenerg. 2002;1555:14–20.
25. Atsumi T, Chesney J, Metz C, Leng L, Donnelly S, Makita Z, Mitchell R, Bucala R.
High expression of inducible 6-phosphofructo-2-kinase/fructose-2,6bisphosphatase (iPFK-2; PFKFB3) in human cancers. Cancer Res. 2002;62:5881–7.
26. Clem B, Telang S, Clem A, Yalcin A, Meier J, Simmons A, Rasku MA,
Arumugam S, Dean WL, Eaton J, Lane A, Trent JO, Chesney J. Smallmolecule inhibition of 6-phosphofructo-2-kinase activity suppresses
glycolytic flux and tumor growth. Mol Cancer Ther. 2008;7:110–120.31.
Page 14 of 15
27. Iqbal MA, Gupta V, Gopinath P, Mazurek S, Bamezai RNK. Pyruvate kinase M2
and cancer: an updated assessment. FEBS Lett. 2014;588:2685–92.
28. Wong N, Ojo D, Yan J, Tang D. PKM2 contributes to cancer metabolism.
Cancer Lett. 2015;356:184–91.
29. Koukourakis MI, Kontomanolis E, Giatromanolaki A, Sivridis E, Liberis V.
Serum and tissue ldh levels in patients with breast/gynaecological cancer
and benign diseases. Gynecol Obstet Investig. 2009;67:162–8.
30. Fiume L, Manerba M, Vettraino M, Di Stefano G. Inhibition of lactate
dehydrogenase activity as an approach to cancer therapy. Future Med
Chem. 2014;6:429–45.
31. Miao P, Sheng S, Sun X, Liu J, Huang G. Lactate dehydrogenase a in cancer:
a promising target for diagnosis and therapy. IUBMB Life. 2013;65:904–10.
32. Augoff K, Hryniewicz-Jankowska A, Tabola R. Lactate dehydrogenase 5: an
old friend and a new hope in the war on cancer. Cancer Lett. 2015;358:1–7.
33. Fiume L, Manerba M, Vettraino M, Di Stefano G. Impairment of aerobic
glycolysis by inhibitors of lactic dehydrogenase hinders the growth of
human hepatocellular carcinoma cell lines. Pharmacology. 2010;86:157–62.
34. Fiume L, Vettraino M, Manerba M, Di Stefano G. Inhibition of lactic
dehydrogenase as a way to increase the anti-proliferative effect of multitargeted kinase inhibitors. Pharmacol Res. 2011;63:328–34.
35. Zhao Y, Liu H, Liu Z, Ding Y, LeDoux SP, Wilson GL, Voellmy R, Lin Y, Lin W,
Nahta R, Liu B, Fodstad O, Chen J, et al. Overcoming trastuzumab resistance
in breast cancer by targeting dysregulated glucose metabolism. Cancer Res.
2011;71:4585–97.
36. Zhou M, Zhao Y, Ding Y, Liu H, Liu Z, Fodstad O, Riker AI, Kamarajugadda S,
Lu J, Owen LB, Ledoux SP, Tan M. Warburg effect in chemosensitivity:
targeting lactate dehydrogenase-a re-sensitizes Taxol-resistant cancer cells
to Taxol. Mol Cancer. 2010;9:33.
37. Xu RH, Pelicano H, Zhou Y, Carew JS, Feng L, Bhalla KN, Keating MJ, Huang
P. Inhibition of glycolysis in cancer cells: a novel strategy to overcome drug
resistance associated with mitochondrial respiratory defect and hypoxia.
Cancer Res. 2005;65:613–21.
38. Zhao Y, Butler EB, Tan M. Targeting cellular metabolism to improve cancer
therapeutics. Cell Death and Disease. 2013;4:e532.
39. Butler EB, Zhao Y, Muñoz-Pinedo C, Lu J, Tan M. Stalling the engine of
resistance: targeting cancer metabolism to overcome therapeutic resistance.
Cancer Res. 2013;73:2709–17.
40. Xintaropoulou C, Ward C, Wise A, Marston H, Turnbull A, Langdon SP. A
comparative analysis of inhibitors of the glycolysis pathway in breast and
ovarian cancer cell line models. Oncotarget. 2015;6:25677–95.
41. Faratian D, Um I, Wilson DS, Mullen P, Langdon SP, Harrison DJ. Phosphoprotein
pathway profiling of ovarian carcinoma for the identification of potential new
targets for therapy. Eur J Cancer. 2011;47:1420–31.
42. Lubbock ALR, Katz E, Harrison DJ, Overton IM. TMA navigator: network
inference, patient stratification and survival analysis with tissue microarray
data. Nucl Acids Res. 2013;41:W562–8.
43. Best DJ, Roberts DE. Algorithm AS 89: the upper tail probabilities of Spearman’s
rho. Journal of the Royal Statistical Society Series C (App Stat). 1975;24:377–9.
44. Mitra A, Davis DA, Tomar S, et al. In vivo tumor growth of high-grade
serous ovarian cancer cell lines. Gynecol Oncol. 2015;138:372–7.
45. Provencher DM, Lounis H, Champoux L, Tétrault M, Manderson EN, Wang
JC, Eydoux P, Savoie R, Tonin PN, Mes-Masson AM. Characterization of four
novel epithelial ovarian cancer cell lines. In Vitro Cell Dev Biol Anim. 2000;
36:357–61.
46. Langdon SP, Lawrie SS, Hay FG, Hawkes MM, McDonald A, Hayward IP, Schol
DJ, Hilgers J, Leonard RCF, Smyth JF. Characterization and Properties of nine
human ovarian adenocarcinoma cell lines. Cancer Res. 1988;48:6166–72.
47. Cooke SL, Ng CKY, Melnyk N, Garcia MJ, Hardcastle T, Temple J, Langdon S,
Huntsman D, Brenton JD. Genomic analysis of genetic heterogeneity and
evolution in high-grade serous ovarian carcinoma. Oncogene. 2010;29:4905–13.
48. Vichai V, Kirtikara K. Sulforhodamine B colorimetric assay for cytotoxicity
screening. Nat Protocols. 2006;1:1112–6.
49. Bijnsdorp IV, Giovannetti E, Peters GJ. Analysis of drug interactions. Methods
Mol Biol. 2011;731:421–34.
50. Camp RL, Dolled-Filhart M, Rimm DL. X-tile: a new bio-informatics tool for
biomarker assessment and outcome-based cut-point optimization. Clin
Cancer Res. 2004;10:7252–9.
51. Adams DJ, Ito D, Rees MG, Seashore-Ludlow B, Puyang X, Ramos AH,
Cheah JH, Clemons PA, Warmuth M, Zhu P, Shamji AF, Schreiber SL.
NAMPT is the cellular target of STF-31-like small-molecule probes. ACS
Chem Biol. 2014;9:2247–54.
Xintaropoulou et al. BMC Cancer (2018) 18:636
52. Cantuaria G, Magalhaes A, Penalver M, Angioli R, Braunschweiger P, GomezMarin O, Kanhoush R, Gomez-Fernandez C, Nadji M. Expression of GLUT-1
glucose transporter in borderline and malignant epithelial tumors of the
ovary. Gynecol Oncol. 2000;79:33–7.
53. Kalir T, Wang BY, Goldfischer M, Haber RS, Reder I, Demopoulos R, Cohen
CJ, Burstein DE. Immunohistochemical staining of GLUT1 in benign,
borderline, and malignant ovarian epithelia. Cancer. 2002;94:1078–82.
54. Rudlowski C, Moser M, Becker AJ, Rath W, Buttner R, Schroder W,
Schurmann A. GLUT1 mRNA and protein expression in ovarian borderline
tumors and cancer. Oncology. 2004;66:404–10.
55. Tsukioka M, Matsumoto Y, Noriyuki M, Yoshida C, Nobeyama H, Yoshida H,
Yasui T, Sumi T, Honda KI, Ishiko O. Expression of glucose transporters in
epithelial ovarian carcinoma: correlation with clinical characteristics and
tumor angiogenesis. Oncol Rep. 2007;18:361–7.
56. Semaan A, Munkarah AR, Arabi H, Bandyopadhyay S, Seward S, Kumar S, Qazi
A, Hussein Y, Morris RT, Ali-Fehmi R. Expression of GLUT-1 in epithelial ovarian
carcinoma: correlation with tumor cell proliferation, angiogenesis, survival and
ability to predict optimal cytoreduction. Gynecol Oncol. 2011;121:181–6.
57. Cho H, Lee YS, Kim J, Chung JY, Kim JH. Overexpression of glucose
transporter-1 (GLUT-1) predicts poor prognosis in epithelial ovarian cancer.
Cancer Investig. 2013;31:607–15.
58. Cantuaria G, Fagotti A, Ferrandina G, Magalhaes A, Nadji M, Angioli R, Penalver
M, Mancuso S, Scambia G. GLUT-1 expression in ovarian carcinoma: association
with survival and response to chemotherapy. Cancer. 2001;92:1144–50.
59. Kurokawa T, Yoshida Y, Kawahara K, Tsuchida T, Okazawa H, Fujibayashi Y,
Yonekura Y, Kotsuji F. Expression of GLUT-1 glucose transfer, cellular
proliferation activity and grade of tumor correlate with [F-18]fluorodeoxyglucose uptake by positron emission tomography in epithelial
tumors of the ovary. Int J Cancer. 2004;109:926–32.
60. Jin Z, Gu J, Xin X, Li Y, Wang H. Expression of hexokinase 2 in epithelial
ovarian tumors and its clinical significance in serous ovarian cancer. Eur J
Gynaecol Oncol. 2014;35:519–24.
61. Suh DH, Kim MA, Kim H, Kim MK, Kim HS, Chung HH, Kim YB, Song YS.
Association of overexpression of hexokinase II with chemoresistance in
epithelial ovarian cancer. Clin Exp Med. 2014;14:345–53.
62. Gerich JE. Control of glycaemia. Baillieres Clin Endocrinol Metab. 1993;7:551–86.
63. Birsoy K, Possemato R, Lorbeer FK, Bayraktar EC, Thiru P, Yucel B, Wang T,
Chen WW, Clish CB, Sabatini DM. Metabolic determinants of cancer cell
sensitivity to glucose limitation and biguanides. Nature. 2014;508:108–12.
64. Mathews EH, Stander BA, Joubert AM, Liebenberg L. Tumor cell culture
survival following glucose and glutamine deprivation at typical
physiological concentrations. Nutrition. 2014;30:218–27.
65. Aykin-Burns N, Ahmad IM, Zhu Y, Oberley LW, Spitz DR. Increased levels of
superoxide and H2O2 mediate the differential susceptibility of cancer cells
versus normal cells to glucose deprivation. Biochem J. 2009;418:29–37.
66. Graham NA, Tahmasian M, Kohli B, Komisopoulou E, Zhu M, Vivanco I, Teitell
MA, Wu H, Ribas A, Lo RS. Mellinghoff IK, Mischel PS, Graeber TG. Glucose
deprivation activates a metabolic and signaling amplification loop leading
to cell death. Mol Syst Biol. 2012;8:859.
67. Bhattacharya B, Low SHH, Soh C, Kamal Mustapa N, Beloueche-Babari M,
Koh KX, Loh J, Soong R. Increased drug resistance is associated with
reduced glucose levels and an enhanced glycolysis phenotype. Br J
Pharmacol. 2014;171:3255–67.
68. Dasari S, Bernard Tchounwou P. Cisplatin in cancer therapy: molecular
mechanisms of action. Eur J Pharmacol. 2014;740:364–78.
69. Liu Y, Cao Y, Zhang W, Bergmeier S, Qian Y, Akbar H, Colvin R, Ding J, Tong
L, Wu S, Hines J, Chen X. A small-molecule inhibitor of glucose transporter 1
downregulates glycolysis, induces cell-cycle arrest, and inhibits cancer cell
growth in vitro and in vivo. Mol Cancer Ther. 2012;11:1672–82.
70. Cao X, Fang L, Gibbs S, Huang Y, Dai Z, Wen P, Zheng X, Sadee W, Sun D.
Glucose uptake inhibitor sensitizes cancer cells to daunorubicin and overcomes
drug resistance in hypoxia. Cancer Chemother Pharmacol. 2007;59:495–505.
71. Nakano A, Tsuji D, Miki H, Cui Q, El Sayed SM, Ikegame A, Oda A, Amou H,
Nakamura S, Harada T, Fujii S, Kagawa K, Takeuchi K, et al. Glycolysis
inhibition inactivates ABC transporters to restore drug sensitivity in
malignant cells. PLoS One. 2011;6:e27222.
72. Morales DR, Morris AD. Metformin in cancer treatment and prevention.
Annu Rev Med. 2015;66:17–29.
73. Quinn BJ, Kitagawa H, Memmott RM, Gills JJ, Dennis PA. Repositioning
metformin for cancer prevention and treatment. Trends Endocrinol Metab.
2013;24:469–80.
Page 15 of 15
74. Rizos CV, Elisaf MS. Metformin and cancer. Eur J Pharmacol. 2013;705:96–108.
75. Coperchini F, Leporati P, Rotondi M, Chiovato L. Expanding the therapeutic
spectrum of metformin: from diabetes to cancer. J Endocrinol Investig.
2015;38:1047–55.
76. Chae YK, Arya A, Malecek MK, Shin DS, Carneiro B, Chandra S, Kaplan J,
Kalyan A, Altman JK, Platanias L, Giles F. Repurposing metformin for cancer
treatment: current clinical studies. Oncotarget. 2016;7:40767–80.
77. Wilcock C, Bailey CJ. Accumulation of metformin by tissues of the normal
and diabetic mouse. Xenobiotica. 1994;24:49–57.
78. Zordoky BNM, Bark D, Soltys CL, Sung MM, Dyck JRB. The anti-proliferative
effect of metformin in triple-negative MDA-MB-231 breast cancer cells is
highly dependent on glucose concentration: implications for cancer therapy
and prevention. Biochim Biophys Acta Gen Subj. 2014;1840:1943–57.
79. Heckman-Stoddard BM, Gandini S, Puntoni M, Dunn BK, Decensi A, Szabo E.
Repurposing old drugs to chemoprevention: the case of metformin. Semin
Oncol. 2016;43:123–33.