Obesity as risk factor for subtypes of breast cancer: Results from a prospective cohort study
Bạn đang xem bản rút gọn của tài liệu. Xem và tải ngay bản đầy đủ của tài liệu tại đây (762.21 KB, 8 trang )
Nattenmüller et al. BMC Cancer (2018) 18:616
/>
RESEARCH ARTICLE
Open Access
Obesity as risk factor for subtypes of breast
cancer: results from a prospective cohort
study
Cina J. Nattenmüller1, Mark Kriegsmann2, Disorn Sookthai1, Renée Turzanski Fortner1, Annika Steffen3,
Britta Walter2, Theron Johnson1, Jutta Kneisel1, Verena Katzke1, Manuela Bergmann3, Hans Peter Sinn2,
Peter Schirmacher2, Esther Herpel2,4, Heiner Boeing3, Rudolf Kaaks1 and Tilman Kühn1*
Abstract
Background: Earlier epidemiological studies indicate that associations between obesity and breast cancer risk may
not only depend on menopausal status and use of exogenous hormones, but might also differ by tumor subtype.
Here, we evaluated whether obesity is differentially associated with the risk of breast tumor subtypes, as defined by
6 immunohistochemical markers (ER, PR, HER2, Ki67, Bcl-2 and p53, separately and combined), in the prospective
EPIC-Germany Study (n = 27,012).
Methods: Formalin-fixed and paraffin-embedded (FFPE) tumor tissues of 657 incident breast cancer cases were
used for histopathological analyses. Associations between BMI and breast cancer risk across subtypes were evaluated
by multivariable Cox regression models stratified by menopausal status and hormone therapy (HT) use.
Results: Among postmenopausal non-users of HT, higher BMI was significantly associated with an increased risk of less
aggressive, i.e. ER+, PR+, HER2-, Ki67low, Bcl-2+ and p53- tumors (HR per 5 kg/m2: 1.44 [1.10, 1.90], p = 0.009), but not
with risk of more aggressive tumor subtypes. Among postmenopausal users of HT, BMI was significantly inversely
associated with less aggressive tumors (HR per 5 kg/m2: 0.68 [0.50, 0.94], p = 0.018). Finally, among pre- and
perimenopausal women, Cox regression models did not reveal significant linear associations between BMI and
risk of any tumor subtype, although analyses by BMI tertiles showed a significantly lower risk of less aggressive
tumors for women in the highest tertile (HR: 0.55 [0.33, 0.93]).
Conclusion: Overall, our results suggest that obesity is related to risk of breast tumors with lower aggressiveness,
a finding that requires replication in larger-scale analyses of pooled prospective data.
Keywords: Breast cancer, Obesity, Tumor subtypes, Estrogen receptor, Ki-67, p53, Bcl-2
Background
Associations between etiological factors and cancer risk
have been shown to be differential across molecular
tumor subtypes in earlier epidemiological studies [1, 2].
With respect to relationships between anthropometric
factors and breast cancer risk, there is evidence to suggest that obesity, as measured by body mass index
(BMI), increases the risk of estrogen receptor positive
(ER+) rather than ER- breast tumors in postmenopausal
* Correspondence:
1
Division of Cancer Epidemiology, German Cancer Research Center (DKFZ),
Im Neuenheimer Feld 280, Heidelberg, Germany
Full list of author information is available at the end of the article
women [3–5]. Moreover, it has been proposed that obesity is related to more slowly proliferating tumors, as
defined by low expression of the Ki67 protein in tumor
cells [5]. Thus, mechanisms to link obesity with breast
cancer, especially altered estrogen and Insulin-like
growth factor 1 (IGF-1) signaling [6], could drive overall
less aggressive tumors with a distinct molecular profile.
However, despite the notion that a better understanding
of risk factor associations with tumor subtypes is needed
to improve personalized medicine and prevention [1],
prospective data on the relationship between anthropometric parameters and the risks of breast cancer by
© The Author(s). 2018 Open Access This article is distributed under the terms of the Creative Commons Attribution 4.0
International License ( which permits unrestricted use, distribution, and
reproduction in any medium, provided you give appropriate credit to the original author(s) and the source, provide a link to
the Creative Commons license, and indicate if changes were made. The Creative Commons Public Domain Dedication waiver
( applies to the data made available in this article, unless otherwise stated.
Nattenmüller et al. BMC Cancer (2018) 18:616
subtypes beyond those defined by hormone receptor status are sparse [2].
The aim of the present study was to examine the associations between obesity with breast cancer risk across more
refined tumor subtypes. For this purpose, we assessed six
well-established immunohistochemical markers (ER, PR,
HER2, Ki67, Bcl-2 and p53) in tumor samples of breast cancer cases from the prospective European Prospective Investigation into Cancer and Nutrition (EPIC)-Germany Study.
We hypothesized that obesity would be particularly related
to the development of less aggressive tumors (i.e. ER+, PR+,
HER2-, Ki67low, Bcl-2+ and p53- tumors).
Methods
Study population
EPIC is a multi-center prospective cohort study with
more than 500,000 participants across Europe. In
Germany, 53,088 participants (30,270 women) in the age
range between 35 and 65 years were recruited at the
study centers in the cities of Heidelberg and Potsdam
between 1994 and 1998 [7, 8]. At baseline, anthropometric measurements were carried out by trained personnel,
and data on diet, physical activity, smoking, alcohol consumption, medication use, reproductive factors and
socio-economic status were obtained [7].
Incident cases of breast cancer were either
self-reported during follow-up or derived from cancer
registries. Each case was validated by a study physician
using the information given by the patient’s treating physicians and hospitals. Overall, 1095 cases of primary
breast cancer had occurred until Dec 31st 2010, the
closure date for the present analyses. After exclusion of
prevalent cases of cancer (n = 1669), individuals lost to
follow-up (n = 947), individuals with unclear breast cancer status (n = 23), individuals with missing covariate
information (n = 181), and incident cases without tumor
blocks (n = 438) from the EPIC-Germany cohort, the
study population for the present analyses comprised
27,012 women (Additional file 1: Figure S1).
Laboratory methods
Formalin-fixed paraffin-embedded (FFPE) tumor tissue
material was available for a total of 657 cases (60.0%).
There were no significant statistical differences regarding
age, reproductive factors and lifestyle factors between
these cases and those for which no tumor blocks were
available, even though there were slightly more in situ
and grade I tumors in the latter group (Additional file 2:
Table S1). A board-certified senior pathologist (E.H.)
selected representative tumor areas to construct tissue
microarrays (TMA) on a hematoxylin and eosin stained
slide of each tumor block. A TMA machine (AlphaMetrix
Biotech, Roedermark, Germany) was used to extract
tandem 1 mm cylindrical core samples. IHC staining was
Page 2 of 8
carried out using antibodies routinely employed for diagnostic purposes (Additional file 2: Table S2) and an immunostaining device (DAKO, Techmate 500plus). All TMA
slides were examined by at least one pathologist (E.H.,
M.K.) with special expertise in breast cancer pathology. In
case of a discrepancy between the scores derived from the
first and second core of the same patient, the pathologists
re-examined both cores and made a final decision. Whenever TMA analysis did not yield a conclusive result for a
marker, it was assigned a missing value (ER: 2.0%; PR:
2.7%; HER2: 1.7%; Ki67: 6.1%; Bcl-2: 4.1%; p53: 6.7%).
Tumors were categorized as ER positive/negative and PR
positive/negative using the Allred Score [9]. HER2 was
determined according to staining pattern and intensity,
and scored as negative (0 and 1+) or positive (2+ and 3+)
[10]. Ki67 proliferation activity was scored by percentage
of positive tumor nuclei (< 20%: low proliferative activity;
≥20%: high proliferative activity) [11]. Bcl-2 was scored as
negative if less than 10% of the cells were positive and
staining intensity was weak, otherwise Bcl-2 was scored as
positive [12]. Cases with more than 10% of cells stained
were rated p53 positive, the remaining cases were rated
p53 negative, as in most previous studies using this antigen [13]. Categorization of subtypes was based on visual
estimation counting at least 100 tumor cells.
Statistical analyses
Relationships between BMI at recruitment and breast
cancer risk were evaluated separately among 1) women,
who were pre- or perimenopausal at baseline 2) women,
who were postmenopausal at baseline and used hormone
therapy (HT), and 3) women, who were postmenopausal
at baseline and did not use HT, as differential risk associations with BMI across these subgroups have been
reported [14, 15]. Statistical analyses on breast cancer
risk by tumor subtype were carried out using multivariable Cox proportional hazards regression analyses to estimate hazard ratios (HR) and 95% confidence intervals
(CI) across tertiles of BMI (created based on data of the
full cohort), with age as the underlying time scale. All
models were adjusted for height (continuous), number
of full-term pregnancies (continuous), educational
level (university degree vs. no university degree),
smoking status (never, former, current), and study
center (Heidelberg, Potsdam). Analyses among preand perimenopausal women were further adjusted for
current use of oral contraceptives. The inclusion of
other potential confounders (alcohol consumption,
breast feeding, age at menarche, age at first pregnancy) only marginally affected risk associations and
were not included in final Cox regression models.
Linear trends were estimated by entering BMI as a
continuous term into the same model rescaling HRs to
reflect a 5 kg/m2 increase. Observations were
Nattenmüller et al. BMC Cancer (2018) 18:616
Page 3 of 8
left-truncated and censored at end of follow-up, death,
or cancer diagnosis, whichever occurred first. In order
to assess patterns of IHC markers, unsupervised hierarchical clustering was used to group cancer cases
according to the similarity / dissimilarity of the IHC
staining results for ER, PR, HER2, Ki67, Bcl-2, and p53,
as previously published [16, 17]. In addition to BMI, we
evaluated waist circumference and hip circumference as
anthropometric markers of obesity in relation to breast
cancer risk. Heterogeneity in associations between
anthropometric factors and breast cancer risk across
subtypes was tested for using a competing risk framework, as proposed by Wang et al. [18]. As the evidence
on associations between BMI and in situ breast tumors
is not consistent [19, 20], we decided to exclude cases of
in situ tumors in sensitivity analyses. All statistical analyses were carried out using SAS, version 9.4 (SAS Institute, Cary, NC, USA). For unsupervised hierarchical
clustering and for the generation of a dendogram / heat
map to visualize clusters of tumor markers we used the
d3heatmap package in R [21].
Results
Characteristics of the study population
The analytical cohort for the present analyses comprised
27,012 women at a median baseline age of 48.4 (range:
35.2–65.2) years, and a median BMI of 24.7 (see Table 1,
Table 1 Characteristics of the study population
N
27,012
Age at recruitmenta
48.4 (41.2, 57.0)
a
Anthropometric parameters
BMI (kg/m2)
24.7 (22.3, 28.0)
Height (cm)
163.2 (159.0, 167.5)
Menopausal Status
Pre- and perimenopausal (%)
59.2
Postmenopausal (%)
40.8
Hormone therapy (%)b
User at baseline (%)
46.0
Non-user at baseline (%)
54.0
Number of full-term pregnanciesc
1.7 (0, 8)
Smoking Status
Never smokers (%)
55.7
Former smokers (%)
25.6
Current smokers (%)
18.7
Education Level
a
University Degree (%)
34.4
No University Degree (%)
65.6
Median values (p25, 75) are shown for continuous variables
b
Postmenopausal women only
c
Mean value (Minimum, Maximum)
and Additional file 1: Figure S1). Overall, 40.8% of the
women were postmenopausal at baseline. Among the
postmenopausal women, 46.0% reported to use HT. The
average follow-up duration was 13.0 (±3.1) years.
Median age at diagnosis among the 657 breast cancer
cases was 60.2 (range: 38.9–78.6) years.
Tumor stages and grades at diagnosis were as follows;
In situ: 7.0%, Stage I: 38.7%, Stage II: 41.0%, Stage III:
11.3%, Stage IV: 2.0%; Grade I: 12.4%, Grade II: 56.8%,
Grade III: 30.8% (Additional file 2: Table S1). Of the invasive tumors, 70.5% were carcinoma of no special type
(NST), 18.3% lobular carcinoma, and 11.1% other; of the
in situ tumors, 67.4% were ductal carcinoma, 13.0% were
lobular carcinoma, and 19.6% other (Additional file 2:
Table S3). The proportions of subtypes indicating
more favorable prognosis were 84.8% for ER+, 70.7%
for PR+, 87.5% for HER2-, 83.1% for Ki67low, 66.0%
for Bcl-2+ and 80.1% for p53-. Frequencies of luminal
A (ER+ and/or PR+, HER2- and Ki67low), luminal B
(ER+ and/or PR+, HER2- and Ki67high), Her2+, and
triple negative (ER-, PR-, and HER2-) tumors were
68.6, 8.4, 9.7, and 13.3%.
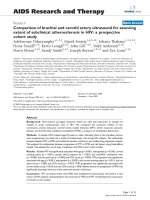
The results of the unsupervised hierarchical clustering of breast cancer cases according to IHC staining
profiles are shown in Fig. 1. The three main clusters
identified by hierarchical clustering can be characterized as follows: Cluster 1 (42.7% of all cases) contains
tumors with a profile of individual markers indicative
of low aggressiveness (all cases are ER+, PR+, HER2-,
Ki67low, Bcl-2+ and p53-). Cluster 2 (19.0% of all cases)
contains ER- tumors and ER+ tumors that are Bcl-2
negative. Cluster 3 (38.3% of all cases) mainly contains
ER+ tumors that, unlike the ER+ tumors in cluster 1,
show at least one criterion pointing to higher aggressiveness (i.e. p53 positivity, Bcl-2 negativity, high Ki67
expression, or HER2 positivity).
BMI and risk of breast cancer by tumor subtype
Among postmenopausal non-users of HT, BMI was
directly associated with higher overall breast cancer risk
(HR per 5 kg/m2: 1.27 [95% CI: 1.07, 1.50], p = 0.005),
while a significant inverse association was observed
among HT users (HR: 0.80 [0.66, 0.98], p = 0.024)
(Table 2). BMI was not significantly associated with
overall breast cancer risk in pre- and perimenopausal
women (HR: 0.98 [0.85, 1.12], p = 0.72).
Analyses stratified by tumor subtypes as derived from
hierarchical clustering are shown in Table 3. Among
postmenopausal non-users of HT, each 5 kg/m2 increment of BMI was directly and significantly associated
with the risk of less aggressive cluster 1 tumors, i.e.
tumors that were ER+, PR+, HER2-, Ki67low, Bcl-2+ and
p53-, with a HR per 5 kg/m2 of 1.44 [95% CI: 1.10, 1.90],
p = 0.009). BMI was not associated with more aggressive
Nattenmüller et al. BMC Cancer (2018) 18:616
Page 4 of 8
Fig. 1 Frequencies of combined tumor subtypes as derived from hierarchical clustering, with the top three clusters marked in the dendrogram;
light bars indicate positivity (or high proliferation activity in case of Ki67)
cluster 2 and cluster 3 tumors (Table 3). Among
HT-users, BMI was significantly associated with lower
risk of less aggressive cluster 1 tumors (HR per 5 kg/m2:
0.68 [0.50, 0.94], p = 0.018); again, no significant associations with the risks of more aggressive cluster 2 and
cluster 3 tumors were observed. While risk analyses per
5 kg/m2 did not reveal significant associations between
BMI and risks of any tumor subtype in pre- and perimenopausal women, it is of note that women in the
highest BMI tertile showed a significantly lower risk of
less aggressive cluster 1 tumors as compared to women
in the lowest BMI tertile (HRTertile3 vs. Tertile1: 0.55 [0.33,
0.93]). Sensitivity analyses excluding in situ cases yielded
similar highly similar results (Additional file 2: Table S4).
Associations between BMI and risk of luminal A tumors
were similar to those between BMI and risk of cluster 1
tumors (Additional file 2: Table S5); there were no significant associations with luminal B and triple negative
tumors.
In analyses on breast tumor subtypes defined by individual markers, BMI was significantly positively associated with risk of ER+, PR+, HER2-, Ki67low, Bcl-2+ and
p53- tumors among postmenopausal non-users of HT
(Additional file 2: Table S6). By contrast, no significant
associations with ER-, PR-, HER2+, Ki67high, Bcl-2- and
p53+ tumors were observed. With respect to postmenopausal users of HT, Cox regression analyses showed
significant inverse associations with risks of ER+, HER2-,
Ki67low, Bcl-2+ and p53- tumors, and a non-significant
tendency for an inverse association with PR+ breast
cancer (Additional file 2: Table S7). Again, there were no
significant associations with risk of ER-, PR-, HER2+,
Table 2 Hazard ratios of overall breast cancer across tertiles of BMIa
Postmenopausal non-users of HTb
Postmenopausal users of HTb
Pre- and perimenopausal womenb
Cases (n)
Cases (n)
Cases (n)
HR
Tertile 1
14
1
Tertile 2
43
1.87
Tertile 3
79
CI (95%)
HR
CI (95%)
CI (95%)
1
(1.00,3.49)
92
0.97
(0.70,1.34)
85
0.76
(0.57,1.00)
56
0.69
(0.47,1.00)
82
0.93
(0.70,1.24)
0.80
(0.66,0.98)
0.98
(0.85,1.12)
2.28
(1.23,4.16)
Per 5 kg/m2
1.27
(1.07,1.50)
p trend
0.005
0.024
141
HR
65
1
0.72
Median (p25, p75) values of BMI: Tertile 1: 21.4 (20.4, 22.3), Tertile 2: 24.8 (23.9, 25.7); Tertile 3: 29.9 (28.1, 32.7)
a
From Cox regression models adjusted for height, number of full-term pregnancies, pill use, education level, smoking status, and study center
b
At baseline (HT hormone therapy)
Nattenmüller et al. BMC Cancer (2018) 18:616
Page 5 of 8
Table 3 Hazard ratios of breast cancer across tertiles of BMI by clusters of breast tumors from hierarchical clustering (see Fig. 1)a
Postmenopausal
non-users of HTb
Postmenopausal
users of HTb
Cases HR
(n)
CI (95%)
Pre- and perimenopausal
womenb
Cases HR
(n)
CI (95%)
Cases HR
(n)
CI (95%)
Cluster 1
Tertile 1
4
1
Tertile 1
30
1
Tertile 1
59
1
(ER+, PR+, HER2-, Ki67low, bcl-2+,
and p53-)
Tertile 2
8
1.02
(0.31,3.40) Tertile 2
32
0.74
(0.44,1.22) Tertile 2
31
0.64 (0.41,1.00)
Tertile 3
33
2.50
(0.86,7.23) Tertile 3
24
0.61
(0.35,1.06) Tertile 3
21
0.55 (0.33,0.93)
1.44
(1.10,1.90) Per 5 kg/m2
0.68
(0.50,0.94) Per 5 kg/m2
Per 5 kg/m2
0.009
p trend
0.018
p trend
Cluster 2
Tertile 1
p trend
5
1
Tertile 1
10
1
Tertile 1
(ER- or ER+ that are Bcl-2-)
Tertile 2
6
0.77
(0.23,2.56) Tertile 2
18
1.14
Tertile 3
16
1.40
(0.49,4.04) Tertile 3
6
0.43
2
Cluster 3
Per 5 kg/m
1.15
p trend
0.47
Tertile 1
(ER+ with at least one other marker Tertile 2
indicative of higher aggressiveness)
Tertile 3
5
1
21
2.98
16
2
(0.78,1.70) Per 5 kg/m
0.83
p trend
0.42
Tertile 1
20
1
(1.01,8.75) Tertile 2
33
1.20
17
1.57
(0.51,4.83) Tertile 3
Per 5 kg/m2
1.00
(0.71,1.42) Per 5 kg/m2
p trend
0.99
p trend
0.85 (0.67,1.08)
0.19
18
1
(0.52,2.53) Tertile 2
9
0.59 (0.26,1.32)
(0.15,1.21) Tertile 3
20
1.52 (0.77,3.00)
2
(0.52,1.32) Per 5 kg/m
1.22 (0.91,1.62)
p trend
0.18
Tertile 1
48
1
(0.68,2.12) Tertile 2
26
0.72 (0.44,1.18)
0.77
(0.39,1.51) Tertile 3
31
0.82
(0.58,1.15) Per 5 kg/m2
0.24
p trend
1.13 (0.70,1.82)
0.94 (0.74,1.19)
0.60
Median (p25, p75) values of BMI: Tertile 1: 21.4 (20.4, 22.3), Tertile 2: 24.8 (23.9, 25.7); Tertile 3: 29.9 (28.1, 32.7)
No statistical heterogeneity of HRs across subtypes was observed
a
From Cox regression models adjusted for height, number of full-term pregnancies, pill use, education level, smoking status, and study center bAt baseline (HT
hormone therapy)
Ki67high, Bcl-2- and p53+ tumors. Among pre- and perimenopausal women, BMI was not significantly associated with risks of any tumor subtype defined by
individual markers (Additional file 2: Table S8). The
results on BMI and risks of tumor subtypes defined by
individual markers were similar after exclusion of in situ
cases (see Additional file 2: Table S9, Table S10, and
Table S11).
The directions of associations with risk of tumor subtypes were highly similar when using waist and hip
circumference as anthropometric indices of obesity instead of BMI, while the associations between
waist-to-hip ratio and breast cancer risk were weaker
and non-significant (data not shown). Risk associations
among premenopausal women only were very similar as
the presented associations among peri- and premenopausal women (data not shown). Importantly, no formal
heterogeneity of associations between anthropometric
factors and breast cancer risk across tumor subtypes, as
either derived from hierarchical clustering or defined by
individual IHC markers, was observed.
Discussion
Here, we examined associations between BMI and breast
cancer risk by tumor subtypes characterized by six
immunohistochemical markers. Among postmenopausal
women who did not use HT at the time of recruitment,
higher BMI was significantly associated with increased
risk of less aggressive tumors, as either defined by individual markers (ER+, PR+, HER2-, Ki67low, Bcl-2+, p53-)
or a combination of these markers derived from hierarchical cluster analysis (cluster 1). By contrast, we
observed no significant associations between BMI and
risk of more aggressive tumors, irrespective of whether
subtype classification was based on single markers or on
marker combinations (clusters 2 and 3). Among HT
users, higher BMI was linearly associated with reduced
relative risk of less aggressive (hormone receptor positive, HER-, Ki67low, Bcl-2+, or cluster 1) tumors, while
there were no significant associations with more aggressive tumors. Analyses by single markers did not reveal
any significant associations among pre- and perimenopausal women, whereas risk of cluster 1 tumors was
lower among women in the highest BMI tertile compared to those in the lowest.
Various studies have shown associations between
obesity and an increased risk of breast cancer among
postmenopausal non-users of HT, particularly of ER+
/ PR+ breast cancer, but not ER- / PR- breast cancer
[4, 22, 23]. Our present data confirm the association
Nattenmüller et al. BMC Cancer (2018) 18:616
with hormone-receptor positive breast cancer and
additionally indicate that postmenopausal obesity may
be related to an overall less aggressive molecular subtype of breast cancer characterized by a lower proliferation rate (Ki67low), Bcl-2 positivity and p53
negativity – immunohistochemical characteristics that
are each associated with better prognosis [12, 24–26].
The inverse overall association between obesity and
breast cancer risk among HT users that we observed
is in agreement with previous data from the full
EPIC-Europe cohort [27]. Our results suggest that
this inverse association might be strongest for (if not
restricted to) the less aggressive tumor subtypes,
which is in contrast, however, with earlier observations in the EPIC-Europe Study, which were suggestive of an inverse association between BMI and breast
cancer risk among users of HT for ER- / PR- but not
ER+ / PR+ tumors [4]. Thus, and given the lack of
further studies on obesity and breast cancer risk by
tumor subtypes among HT users [28], the associations observed in the present study require replication. Our observation of a lower risk of less
aggressive tumors among pre- and perimenopausal
women in the highest BMI tertile is consistent with
results of a meta-analysis, in which BMI was significantly inversely associated with the risk of ER+/PR+
tumors but not ER-/PR- tumors in premenopausal
women [22].
Biological mechanisms that may underlie the association between obesity and breast cancer include altered
sex hormone metabolism, adipokine signaling, subclinical inflammation, hyperglycaemia, hyperinsulinaemia,
and increased IGF-1 signaling [15, 29]. Differential associations of obesity and breast cancer risk by hormone
receptor status likely reflect a greater responsiveness of
ER+ / PR+ tumors to these mechanisms [4, 30]. However, it is largely unknown why obesity should predispose to p53- and Bcl-2+ tumor subtypes in
postmenopausal women, as indicated by our data. The
expression of p53 in breast adipose stromal cells is
downregulated by obesity-induced prostaglandin E2
(PGE2), which results in a local upregulation of aromatase activity and estrogen production [31], and estrogen
receptor has also been demonstrated to downregulate
p53 and cause tumor cell proliferation [31, 32]. Bcl-2
proteins, by contrast, have been proposed to exert
pro-apoptotic effects [12, 25, 33] and influence
p53-mediated cell-death [31, 34]. Thus, ER positivity,
Bcl-2 positivity and p53 negativity, which co-occurred in
a majority of breast cancer cases in the present analyses,
all appear to be part of a more general molecular constellation that could be driven by obesity, even though
more experimental insight is needed to better understand the interplay between obesity and these tumor
Page 6 of 8
characteristics. In addition, larger epidemiological datasets are needed to stratify ER positive and ER negative
tumors by p53 or Bcl-2 status, which was not possible
due to sample size restrictions in the present study.
Our findings among postmenopausal non-users of HT
might suggest better prognosis in obese breast cancer
patients, as they may be more likely to have less aggressive tumor subtypes than lean patients. Yet, prospective
analyses in cohorts of breast cancer patients have clearly
shown that breast cancer-specific survival is negatively
impacted by obesity irrespective of menopausal status or
hormone receptor status of the tumor [35, 36]. These
paradoxical observations may be explained by lower efficiency of anticancer drugs, particularly aromatase inhibitors, in obese patients and by better compliance to
treatment among normal weight patients [37]; still, further studies are needed to resolve the paradox as to why
obesity may be related to an increased risk of less
aggressive breast tumors, while at the same time being
associated with worse prognosis irrespective of the
tumor subtype.
Several limitations apply to our study. First, by using
TMAs from preserved tumor material to assess tumor
subtypes, we ensured homogeneity of testing conditions.
However, when compared to full-slice IHC staining done
for diagnostic purposes, IHC performed on TMAs may
be more prone to misclassification of subtypes, especially
when the tumor tissue exhibits heterogeneous expression of the markers in question and visual estimation of
positive tumor cells is used. To minimize such misclassification, we used two tissue cores per tumor. Nevertheless, we cannot rule out that misclassification of tumor
subtypes diluted associations in our study to some
degree. Second, case numbers in our study may have
been too low to detect weaker associations in some subgroups, especially for the more rare and aggressive
cancer subtypes. Due to lower numbers of these tumors,
tests for statistical heterogeneity in the associations
between obesity and breast cancer risk across tumor
subtypes were limited. In this context, it is worth mentioning that in previous analyses of the full European
EPIC cohort, heterogeneity in BMI breast cancer risk
associations by ER/PR status was restricted to women
older than 65 years at diagnosis [4], and that our sample
size was not sufficient to further stratify analyses by age
groups. Thus, our main observation – associations of
obesity with less aggressive breast cancer subtypes – requires replication in larger-scale studies and pooled analyses. This is also true with regard to further
stratification of analyses by histological types of breast
cancer and cancer stage (e.g. invasive vs. in situ or ductal
vs. lobular), for which case numbers in the present study
were not sufficient. Another limitation is that we did not
have data on family history of breast cancer for
Nattenmüller et al. BMC Cancer (2018) 18:616
statistical adjustment. Finally, as many similar cohort
studies on BMI and breast cancer risk, we could not
address changes in weight over time, even though weight
changes in our population are moderate according to
self-reports [38].
Conclusion
In the present study, we evaluated associations between
obesity and breast cancer risk by tumor subtypes, as
defined by six immunohistochemical markers used in clinical routine to guide treatment and determine prognosis.
Our data suggests that obesity is related to ER+, PR+,
HER2-, Ki67low, Bcl-2+ and p53- tumors, i.e. such with
lower aggressiveness, in postmenopausal women. Further
mechanistic studies are needed to determine which biological mechanisms underlie the detected associations,
and larger pooled analyses of prospective cohort data will
be required to further investigate relationships between
obesity and molecular breast tumor subtypes, and particularly the less frequent subtypes, in more detail.
Page 7 of 8
Availability of data and materials
Publication of data from EPIC-Germany in public repositories is not covered
by the informed consent and participant information of the study. Pseudonymized data can be made available for statistical validation upon request.
Authors’ contributions
RK, HB, and PS initiated the tumor collection for the EPIC cohorts in Heidelberg
and Potsdam and obtained the funding. EH managed the EPIC-Germany tumor
collection. JK, EH, MB, TK and TJ organized the tumor collection. EH marked the
tumor areas and monitored the preparation and staining of TMAs. MK, CJN and
EH evaluated the TMAs. HPS, PS and BW supported the evaluation. HB, RK, VK,
TK, and MB managed the follow-up activities of EPIC-Germany. TK initiated and
designed the present project, with conceptual support from CJN, RK, MK, AS
and RTF. CJN and TK wrote the manuscript. CJN, DS and TK ran the statistical
analyses. All authors read and critically revised the manuscript and approved its
final version.
Ethics approval and consent to participate
All participants gave written informed consent and the study was approved
by the responsible ethics committees at both study centers (Potsdam: Ethics
Committee of the Medical Association of the State of Brandenburg;
Heidelberg: Ethics Committee of the Heidelberg University Hospital) [8].
Tissue samples were provided by the tissue bank of the National Center for
Tumor Diseases (NCT, Heidelberg, Germany) in accordance with the regulations
of the tissue bank and the approval of the ethics committee of the Heidelberg
University Hospital.
Competing interests
The authors declare that they have no competing interests.
Additional files
Publisher’s Note
Additional file 1: Figure S1. Flow Chart. (DOCX 29 kb)
Additional file 2: Table S1. Characteristics of breast cancer cases
with and without available immunohistochemistry (IHC) markers;
Table S2. Antibodies; Table S3. Frequency of histological tumor
types; Table S4. Hazard ratios of breast cancer across tertiles of BMI
by clusters of breast tumors from hierarchical clustering, after exclusion of situ
tumors; Table S5. Hazard ratios of luminal A breast cancer across tertiles of
BMI; Table S6. Hazard ratios of breast cancer subtypes across tertiles of BMI
among postmenopausal non-users of hormone therapy; Table S7. Hazard
ratios of breast cancer subtypes across tertiles of BMI among postmenopausal
users of hormone therapy; Table S8. Hazard ratios of breast cancer subtypes across tertiles of BMI among pre- and perimenopausal women;
Table S9. Hazard ratios of breast cancer subtypes across tertiles of BMI
among postmenopausal non-users of hormone therapy, after exclusion
of situ tumors; Table S10. Hazard ratios of breast cancer subtypes across
tertiles of BMI among postmenopausal users of hormone therapy, after
exclusion of situ tumors; Table S11. Hazard ratios of breast cancer subtypes
across tertiles of BMI among pre- and perimenopausal women, after
exclusion of situ tumors. (DOCX 84 kb)
Abbreviations
Bcl-2: B-cell lymphoma 2; BMI: Body mass index; CI: Confidence interval;
EPIC: European Prospective Investigation into Cancer and Nutrition;
ER: Estrogen receptor; FFPE: formalin-fixed paraffin-embedded; HER2: Human
epidermal growth factor receptor 2; HR: Hazard ratio; HT: Hormone therapy;
IGF-1: Insulin-like growth factor 1; IHC: Immunohistochemistry;
PR: Progesterone receptor; TMA: Tissue microarray
Acknowledgements
The authors thank Veronika Geißler and David Jansen for preparing the TMAs
used for the present study.
Funding
The present study was funded by the German Federal Ministry of Education
and Research (BMBF, grant numbers 01ER0808 and 01ER0809). The funders
had no involvement in the design of the study, the conduct of the study, or
the submission of the manuscript for publication.
Springer Nature remains neutral with regard to jurisdictional claims in
published maps and institutional affiliations.
Author details
1
Division of Cancer Epidemiology, German Cancer Research Center (DKFZ),
Im Neuenheimer Feld 280, Heidelberg, Germany. 2Institute of Pathology,
University Hospital Heidelberg, Heidelberg, Germany. 3Department of
Epidemiology, German Institute of Human Nutrition (DIfE)
Postdam-Rehbrücke, Nuthetal, Germany. 4Tissue Bank of the National Center
for Tumor Diseases (NCT), Heidelberg, Germany.
Received: 15 September 2017 Accepted: 23 May 2018
References
1. Ogino S, Fuchs CS, Giovannucci E. How many molecular subtypes?
Implications of the unique tumor principle in personalized medicine. Expert
Rev Mol Diagn. 2012;12(6):621–8.
2. Barnard ME, Boeke CE, Tamimi RM. Established breast cancer risk factors and
risk of intrinsic tumor subtypes. Biochim Biophys Acta. 2015;1856(1):73–85.
3. Neuhouser ML, Aragaki AK, Prentice RL, et al. Overweight, obesity, and
postmenopausal invasive breast cancer risk: a secondary analysis of the
women’s health initiative randomized clinical trials. JAMA Oncol. 2015;1(5):
611–21.
4. Ritte R, Lukanova A, Berrino F, Dossus L, Tjonneland A, Olsen A, Overvad TF,
Overvad K, Clavel-Chapelon F, Fournier A, et al. Adiposity, hormone
replacement therapy use and breast cancer risk by age and hormone
receptor status: a large prospective cohort study. Breast Cancer Res. 2012;
14(3):R76.
5. Borgquist S, Jirstrom K, Anagnostaki L, Manjer J, Landberg G.
Anthropometric factors in relation to different tumor biological subgroups
of postmenopausal breast cancer. Int J Cancer. 2009;124(2):402–11.
6. Friedenreich CM. Review of anthropometric factors and breast cancer risk.
Eur J Cancer Prev. 2001;10(1):15–32.
7. Boeing H, Wahrendorf J, Becker N. EPIC-Germany–A source for studies into
diet and risk of chronic diseases. European investigation into Cancer and
nutrition. Ann Nutr Metab. 1999;43(4):195–204.
8. Boeing H, Korfmann A, Bergmann MM. Recruitment procedures of EPICGermany. European investigation into Cancer and nutrition. Ann Nutr
Metab. 1999;43(4):205–15.
Nattenmüller et al. BMC Cancer (2018) 18:616
9.
10.
11.
12.
13.
14.
15.
16.
17.
18.
19.
20.
21.
22.
23.
24.
25.
26.
27.
28.
Harvey JM, Clark GM, Osborne CK, Allred DC. Estrogen receptor status
by immunohistochemistry is superior to the ligand-binding assay for
predicting response to adjuvant endocrine therapy in breast cancer.
J Clin Oncol. 1999;17(5):1474–81.
Wolff AC, Hammond ME, Hicks DG, Dowsett M, McShane LM, Allison
KH, Allred DC, Bartlett JM, Bilous M, Fitzgibbons P, et al.
Recommendations for human epidermal growth factor receptor 2
testing in breast cancer: American Society of Clinical Oncology/College
of American Pathologists clinical practice guideline update. J Clin Onco.
2013;31(31):3997–4013.
Coates AS, Winer EP, Goldhirsch A, Gelber RD, Gnant M, Piccart-Gebhart M,
Thürlimann B, Senn H-J. Tailoring therapies—improving the management of
early breast cancer: St Gallen international expert consensus on the primary
therapy of early breast Cancer 2015. Ann Oncol. 2015;26(8):1533–46.
Hwang KT, Woo JW, Shin HC, Kim HS, Ahn SK, Moon HG, Han W, Park IA,
Noh DY. Prognostic influence of BCL2 expression in breast cancer. Int J
Cancer. 2012;131(7):E1109–19.
Boyle DP, McArt DG, Irwin G, Wilhelm-Benartzi CS, Lioe TF, Sebastian E,
McQuaid S, Hamilton PW, James JA, Mullan PB, et al. The prognostic
significance of the aberrant extremes of p53 immunophenotypes in breast
cancer. Histopathology. 2014;65(3):340–52.
Fortner RT, Katzke V, Kuhn T, Kaaks R. Obesity and breast Cancer. Recent
Results Cancer Res. 2016;208:43–65.
Renehan AG, Zwahlen M, Egger M. Adiposity and cancer risk: new
mechanistic insights from epidemiology. Nat Rev Cancer. 2015;15(8):484–98.
Weigelt B, Horlings HM, Kreike B, Hayes MM, Hauptmann M, Wessels LF, de
Jong D, Van de Vijver MJ, Van't Veer LJ, Peterse JL. Refinement of breast
cancer classification by molecular characterization of histological special
types. J Pathol. 2008;216(2):141–50.
Makretsov NA, Huntsman DG, Nielsen TO, Yorida E, Peacock M, Cheang MC,
Dunn SE, Hayes M, van de Rijn M, Bajdik C, et al. Hierarchical clustering
analysis of tissue microarray immunostaining data identifies prognostically
significant groups of breast carcinoma. Clin Cancer Res. 2004;10(18 Pt 1):
6143–51.
Wang M, Spiegelman D, Kuchiba A, Lochhead P, Kim S, Chan AT, Poole EM,
Tamimi R, Tworoger SS, Giovannucci E, et al. Statistical methods for
studying disease subtype heterogeneity. Stat Med. 2016;35(5):782–800.
Mullooly M, Khodr ZG, Dallal CM, Nyante SJ, Sherman ME, Falk R, Liao LM,
Love J, Brinton LA, Gierach GL. Epidemiologic risk factors for in situ and
invasive breast cancers among postmenopausal women in the National
Institutes of Health-AARP diet and health study. Am J Epidemiol. 2017;
186(12):1329–40.
Reeves GK, Pirie K, Green J, Bull D, Beral V. Comparison of the effects of
genetic and environmental risk factors on in situ and invasive ductal breast
cancer. Int J Cancer. 2012;131(4):930–7.
R Core Team. R: A language and environment for statistical computing. Vienna,
Austria: Foundation for Statistical Computing; 2014. />Accessed Dec 10 2017
Suzuki R, Orsini N, Saji S, Key TJ, Wolk A. Body weight and incidence of
breast cancer defined by estrogen and progesterone receptor status–a
meta-analysis. Int J Cancer. 2009;124(3):698–712.
Bhaskaran K, Douglas I, Forbes H, dos-Santos-Silva I, Leon DA, Smeeth L.
Body-mass index and risk of 22 specific cancers: a population-based cohort
study of 5·24 million UK adults. Lancet. 2014;384(9945):755–65.
de Azambuja E, Cardoso F, de Castro G, Jr., Colozza M, Mano MS, Durbecq
V, Sotiriou C, Larsimont D, Piccart-Gebhart MJ, Paesmans M: Ki-67 as
prognostic marker in early breast cancer: a meta-analysis of published
studies involving 12,155 patients. Br J Cancer 2007, 96(10):1504–1513.
Dawson SJ, Makretsov N, Blows FM, Driver KE, Provenzano E, Le Quesne J,
Baglietto L, Severi G, Giles GG, McLean CA, et al. BCL2 in breast cancer: a
favourable prognostic marker across molecular subtypes and independent
of adjuvant therapy received. Br J Cancer. 2010;103(5):668–75.
Soussi T, Beroud C. Assessing TP53 status in human tumours to evaluate
clinical outcome. Nat Rev Cancer. 2001;1(3):233–40.
Lahmann PH, Hoffmann K, Allen N, van Gils CH, Khaw KT, Tehard B, Berrino
F, Tjonneland A, Bigaard J, Olsen A, et al. Body size and breast cancer risk:
findings from the European prospective investigation into Cancer and
nutrition (EPIC). Int J Cancer. 2004;111(5):762–71.
Munsell MF, Sprague BL, Berry DA, Chisholm G, Trentham-Dietz A. Body
mass index and breast cancer risk according to postmenopausal estrogenprogestin use and hormone receptor status. Epidemiol Rev. 2014;36:114–36.
Page 8 of 8
29. Park J, Morley TS, Kim M, Clegg DJ, Scherer PE. Obesity and cancer–
mechanisms underlying tumour progression and recurrence. Nat Rev
Endocrinol. 2014;10(8):455–65.
30. Ritte R, Lukanova A, Tjonneland A, Olsen A, Overvad K, Mesrine S, Fagherazzi G,
Dossus L, Teucher B, Steindorf K, et al. Height, age at menarche and risk of
hormone receptor-positive and -negative breast cancer: a cohort study. Int J
Cancer. 2013;132(11):2619–29.
31. Wang X, Simpson ER, Brown KA. p53: protection against tumor growth
beyond effects on cell cycle and apoptosis. Cancer Res. 2015;75(23):5001–7.
32. Bailey ST, Shin H, Westerling T, Liu XS, Brown M. Estrogen receptor prevents
p53-dependent apoptosis in breast cancer. Proc Natl Acad Sci U S A. 2012;
109(44):18060–5.
33. Zinkel S, Gross A, Yang E. BCL2 family in DNA damage and cell cycle control.
Cell Death Differ. 2006;13(8):1351–9.
34. Nakano K, Vousden KH. PUMA, a novel proapoptotic gene, is induced by
p53. Mol Cell. 2001;7(3):683–94.
35. Chan DSM, Vieira AR, Aune D, Bandera EV, Greenwood DC, McTiernan A,
Navarro Rosenblatt D, Thune I, Vieira R, Norat T. Body mass index and
survival in women with breast cancer—systematic literature review and
meta-analysis of 82 follow-up studies. Ann Oncol. 2014;25(10):1901–14.
36. Niraula S, Ocana A, Ennis M, Goodwin PJ. Body size and breast cancer
prognosis in relation to hormone receptor and menopausal status: a metaanalysis. Breast Cancer Res Treat. 2012;134(2):769–81.
37. Lennon H, Sperrin M, Badrick E, Renehan AG. The obesity paradox in Cancer: a
review. Curr Oncol Rep. 2016;18(9):56.
38. Haftenberger M, Mensink GB, Herzog B, Kluttig A, Greiser KH, Merz B, Nothlings
U, Schlesinger S, Vogt S, Thorand B, et al. Changes in body weight and obesity
status in German adults: results of seven population-based prospective studies.
Eur J Clin Nutr. 2016;70(3):300–5.