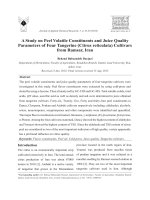
A study on radar signal processing and object segmentation for drone system applications
Bạn đang xem bản rút gọn của tài liệu. Xem và tải ngay bản đầy đủ của tài liệu tại đây (6.37 MB, 109 trang )
Doctoral Dissertation
A Study on Radar Signal Processing
and Object Segmentation for Drone
System Applications
Department of Electronics and Computer Engineering
Graduate School of Chonnam National University
NGUYEN Huy Toan
February 2020
TABLE OF CONTENTS
Contents ............................................................................................................................................i
LIST OF FIGURES ................................................................................................................ iv
LIST OF TABLE.................................................................................................................... vii
GLOSSARY .......................................................................................................................... viii
Abstract ................................................................................................................................... xi
Chapter 1. INTRODUCTION ................................................................................................ 13
1.
Drone system overview ..................................................................................................... 13
1.1.
Drone system hardware configuration .......................................................................... 14
1.2.
Drone system architecture ............................................................................................ 15
2.
Drone applications in this study ........................................................................................ 16
3.
Objectives of the study...................................................................................................... 17
4.
Contribution of the thesis .................................................................................................. 18
5.
Outline .............................................................................................................................. 18
Chapter 2. IMPULSE RADAR SIGNAL PROCESSING ..................................................... 20
1.
Motivations ....................................................................................................................... 20
2.
The proposed radar system ............................................................................................... 20
2.1.
Hardware configuration ................................................................................................ 20
2.2.
Software algorithms ...................................................................................................... 21
3.
Experimental setup............................................................................................................ 25
4.
Experimental results.......................................................................................................... 26
4.1.
Distance estimation result ............................................................................................. 26
4.2.
Distance maintenance result ......................................................................................... 27
5.
Conclusion ........................................................................................................................ 28
Chapter 3. FMCW RADAR SIGNAL PROCESSING .......................................................... 29
1.
Motivation and Related Works.......................................................................................... 29
2.
Data Collection Method .................................................................................................... 31
3.
Methodology ..................................................................................................................... 34
3.1.
Preprocessing Data ....................................................................................................... 34
3.2.
Background Modeling based on Robust PCA .............................................................. 35
i
3.3.
Moving Objects Localization........................................................................................ 39
4.
Experimental setup............................................................................................................ 40
5.
Experimental results.......................................................................................................... 42
5.1.
Performance across different approaches ..................................................................... 42
5.2.
Performance across different updating methods ........................................................... 48
5.3.
Impact of the sliding window size ................................................................................ 49
5.4.
Impact of the number of iteration ................................................................................. 50
6.
Conclusion ........................................................................................................................ 51
Chapter 4. OBJECT SEGMENTATION BASED ON DEEP LEARNING ........................... 52
1.
Motivation and Related Works.......................................................................................... 52
1.1.
Motivation..................................................................................................................... 52
1.2 Related works ...................................................................................................................... 54
2.
Proposed method............................................................................................................... 59
2.1.
Data preprocessing........................................................................................................ 60
2.2.
The Proposed Network Architecture ............................................................................. 61
2.2.1.
Modified U-net network ........................................................................................... 64
2.2.2.
High-level feature network ....................................................................................... 64
2.3.
Training process ............................................................................................................ 65
2.4.
Data post processing ..................................................................................................... 66
3.
Experiment and results ...................................................................................................... 67
3.1.
Datasets ......................................................................................................................... 67
3.2.
Experimental setup ....................................................................................................... 68
3.3.
Experimental results on CDF dataset ............................................................................ 69
3.4.
Experimental results on AigleRN dataset ..................................................................... 71
3.5.
Experimental results on cross dataset ........................................................................... 75
4.
Conclusion ........................................................................................................................ 77
Chapter 5. DRONE SYSTEM APPLICATIONS ................................................................... 79
1.
Wind turbine inspection using drone system .................................................................... 79
1.1.
Motivation and related works ....................................................................................... 79
1.2.
Experimental setup and data record method ................................................................. 81
ii
1.3.
Experimental results ..................................................................................................... 82
1.4.
Conclusion .................................................................................................................... 85
2.
Plant growth stage recognition using drone system .......................................................... 86
2.1.
Motivation and related works ....................................................................................... 86
2.2.
Method .......................................................................................................................... 88
2.3.
Experiments .................................................................................................................. 90
2.4.
Conclusion .................................................................................................................... 93
Chapter 6. CONCLUSION AND FUTURE WORKS ........................................................... 94
1.
Conclusion ........................................................................................................................ 94
2.
Future works ..................................................................................................................... 95
References .............................................................................................................................. 96
Acknowledgments................................................................................................................ 105
(국문초록) ........................................................................................................................... 106
iii
LIST OF FIGURES
Figure 1.1. The drone system applications. (a) Monitoring applications; (b) Firefighting
application; (c) Rescue application, (d) Agriculture application............................................ 13
Figure 1.2. The prototype of drone system (a) Using Digital camera and IR-UWB radar, (b)
Using RPi Camera and FMCW radar. .................................................................................... 14
Figure 1.3. The proposed system architecture........................................................................ 16
Figure 1.4. Drone system applications. (a) Wind turbine inspection, (b) Plant growth stage
recognition. ............................................................................................................................ 17
Figure 2.1 Radar module hardware configuration. ................................................................ 21
Figure 2.2. Radar module prototype. ..................................................................................... 21
Figure 2.3. Distance measurement algorithm flow chart. ...................................................... 22
Figure 2.4. Radar data normalization result. .......................................................................... 23
Figure 2.5. Shape of logarithm function. ............................................................................... 23
Figure 2.6. Smooth calibration function using Polynomial regression. ................................. 24
Figure 2.7. Testing of IR-UWB radar sensor ......................................................................... 26
Figure 2.8. Reference distance and computed output. ........................................................... 26
Figure 2.9. Distance maintenance results. .............................................................................. 27
Figure 3.1. 120 GHz Radar front end block diagram [19]. .................................................... 32
Figure 3.2. FMCW Radar sensor connection. (a) Real connection, (b) Specific connection
diagram. ................................................................................................................................. 32
Figure 3.3. Raw data signal. (a) Raw data frame, (b) Raw data matrix in the distance scale. 33
Figure 3.4. Calibration experimental setup. ........................................................................... 33
iv
Figure 3.5. Time-based sliding window ................................................................................. 34
Figure 3.6. Block diagram for detecting moving objects ....................................................... 34
Figure 3.7. AMPD algorithm [26]. ......................................................................................... 40
Figure 3.8. Experimental Scenarios. (a) Indoor environment; (b) Outdoor environment. ..... 42
Figure 3.9. Original data with one moving object.................................................................. 42
Figure 3.10. Detection performance across different methods .............................................. 43
Figure 3.11.Noise removed signals and target position for one moving object in Figure 3.9. (a)
RPCA via IALM [15], (b) RPCA via GD [17], (c) Online RPCA [16], (d) Proposed method.
................................................................................................................................................ 45
Figure 3.12. Target detection results for multiple moving objects. (a) Two moving objects, (b)
Three moving objects, (c) Four moving objects, (d) Five moving objects. (From top to bottom:
Original data, RPCA via IALM [15], RPCA via GD [17]). ................................................... 46
Figure 3.13. Target detection results for multiple moving objects. (a) Two moving objects, (b)
Three moving objects, (c) Four moving objects, (d) Five moving objects. (From top to bottom:
Original data, Online RPCA [16] and proposed method results). .......................................... 47
Figure 3.14. Detection performance across different update methods ................................... 48
Figure 3.15. Impact of the sliding window size. .................................................................... 50
Figure 3.16. Impact of the number of iteration ...................................................................... 50
Figure 4.1. Overview of crack identification ......................................................................... 54
Figure 4.2. Illustration of data pre-processing steps. (a) Original image, (b) ground truth, (c)
grey-scale image, (d) normalized image, (e) histogram equalization image, and (f) preprocessed image. .................................................................................................................... 62
Figure 4.3. The schematic architecture of the proposed network. ......................................... 63
v
Figure 4.4. Crack prediction results by our proposed method (From top to bottom: Original
images, Ground truth, Probability map, Binary output)......................................................... 67
Figure 4.5. Crack prediction results on CFD dataset (From top to bottom: Original image,
ground truth, MFCD [46], CNN [56] and our results. ........................................................... 70
Figure 4.6. Results on AigleRN dataset. From left to right: Original images, Ground truth
images, FFA, MPS, MFCD, CNN, the proposed method. ..................................................... 73
Figure 4.7. Detection results on AigleRN dataset. From top to bottom: Original images,
Ground truth images, FFA, MPS, MFCD, CNN, and our results. ......................................... 74
Figure 4.8. Detection results on cross data generation. (a), (b), (c), (d) Original images and
ground truth of CFD dataset and AigleRN dataset, (e) Training / Testing: CFD / CFD, (f)
Training / Testing: AigleRN / AigleRN, (g) Training / Testing: AigleRN / CFD, and (h)
Training / Testing: CFD / AigleRN. ....................................................................................... 77
Figure 5.1. Wind power energy in South Korea [72]. ............................................................ 79
Figure 5.2. Proposed Network architecture............................................................................ 81
Figure 5.3. Wind turbine inspection using the drone system. (a) Drone system working state,
(b) The prototype of drone system. ........................................................................................ 82
Figure 5.4. Illustration of predicting steps. (a) Input image, (b) Network threshold output, (c)
Contours detection, (d) Final abnormal appearance results. .................................................. 83
Figure 5.5. Real inspection flight on garlic fields. ................................................................. 87
Figure 5.6. Scaling garlic size using ruler. ............................................................................. 89
Figure 5.7. Illustration of image processing to extract the garlic information. (a) Garlic
contours detection, (b) Final garlic size results. ..................................................................... 89
Figure 5.8. Example results of plant recognition. .................................................................. 92
vi
LIST OF TABLE
Table 2.1. Numerical results for distance maintenance algorithm ......................................... 27
Table 3.1. Setup parameters. .................................................................................................. 41
Table 3.2. Processing speed across different methods. .......................................................... 44
Table 4. 1. Comparison of different methods on the same data set (CFD dataset and AigleRN
dataset). .................................................................................................................................. 58
Table 4.2. Comparison of major deep learning approaches for crack detection and
segmentation .......................................................................................................................... 59
Table 4.3. Detection results with five pixels of tolerance margin on CFD dataset. ............... 71
Table 4.4. Detection results with two pixels of tolerance margin on CFD dataset. ............... 71
Table 4.5. Detection results with five pixels of tolerance margin on AigleRN dataset. ......... 75
Table 4.6. Detection results with two pixels of tolerance margin on AigleRN dataset. ......... 75
Table 4.7. Detection results on cross data generation with five pixels of tolerance margin. . 76
Table 4.8. Detection results on cross data generation with two pixels of tolerance margin. .. 76
Table 5.1. Comparison between our results and the original U-net network. ........................ 84
Table 5.2. Performance comparison. ...................................................................................... 84
Table 5.3. Computational cost................................................................................................ 85
Table 5.4. Pixel-wise performace on the test dataset. ............................................................ 90
Table 5.5. Object-wise performace on the test dataset. .......................................................... 91
vii
GLOSSARY
AEE
Average Euclidean Error
AMPD
Automatic Multiscale-based Peak Detection
CFAR
Constant False Alarm Rate
CFD
Crack Forest Dataset
CLAHE
Contrast Limited Adaptive Histogram Equalization
CNNs
Convolutional Neural Networks
CPU
Central Processing Unit
DCNN
Deep Convolutional Neural Networks
DLL
Delay-Locked Loop
DNN
Deep Neural Network
FFA
Free-Form Anisotropy
FCN
Fully Convolutional Network
FFT
Fast Fourier Transform
FMCW
Frequency-Modulated Continuous-Wave
FN
False Negative
FP
False Positive
GMM
Gaussian Mixture Model
GPS
Global Positioning System
GUI
Graphical User Interface
IALM
Inexact Augmented Lagrange Multipliers
IoT
Internet of Things
IR-UWB
Impulse Radio – Ultra Wideband
ISM
Industry-Science-Medical
LBP
Local Binary Pattern
viii
LMS
Local Maxima Scalogram
LTE
Long Term Evolution
MCU
Micro Controller Unit
MFCD
Multiple-scale Fusion Crack Detection
MPS
Minimal Path Selection
MTD
Mean Texture Depth
OR-PCA
Online Robust Principal Component Analysis
PCA
Principal Component Analysis
PGM-SVM
Probabilistic Generative Model - Support Vector Machine
PI
Proportional Integral
PLL
Phase-Locked Loop
PV
Process Value
RCS
Radar Cross-Section
ReLU
Rectified Linear Unit
RMSE
Root Mean Square Error
RNN
Recurrent Neural Network
RPCA
Robust Principal Component Analysis
RPCA-GD
RPCA via Gradient Descents
RPi
Raspberry Pi
RX
Receiver
SGD
Stochastic Gradient Descent
SNR
Signal to Noise Ratio
SP
Set Point
SPI
Serial Peripheral Interface
SSD
Single Shot Detector
SVD
Singular Value Decomposition
ix
SVM
Support Vector Machine
TDOA
Time Difference Of Arrival
TP
True Positive
TX
Transmitter
UART
Universal Asynchronous Receiver / Transmitter
UAV
Unmanned Aerial Vehicle
UWB
Ultra-Wideband
VCO
Voltage-Controlled Oscillators
WT
Wind Turbine
x
A Study on Radar Signal Processing and Object
Segmentation for Drone System Applications
NGUYEN, Huy Toan
Department of Electronics and Computer Engineering
Graduate School of Chonnam National University
(Supervised by Professor KIM, Jin Young)
Abstract
Drone system have been used in variety fields in last decades such as surveying,
inspection, mapping, security, agriculture, mining, search & rescue. In order to qualify as a
reliable system, a drone must be adapted and integrated with sensors and software system.
However, processing acquired signals from drone system is still complex and difficult
problems due to the higher of noise, uncertainty, and computation cost.
This thesis investigates the sensor signal processing algorithms and object segmentation
method for drone system applications. We consider two kinds of radar sensor including
Impulse Radio – Ultra Wideband (IR-UWB) radar sensor and Frequency-Modulated
Continuous-Wave (FMCW) radar sensor for estimating the distance from the drone to obstacle
to avoid collisions during flight. In addition, on drone, the equipped camera capture images
and send them to ground station. At the ground station, the object segmentation process is
adopted to segment out the fruitful information from input images.
A new impulse radar with hardware configuration and software algorithm is proposed in
this study. The impulse radar sensor hardware must be lightweight, low power consumption
and easy to use. We propose a real-time radar signal-processing algorithm based on logarithm
compensation method and filters on original input data. The propose impulse radar is able to
xi
work at real-time speed with high accuracy.
The thesis also proposes a new algorithm for FMCW radar signal processing based on
Robust Principal Component Analysis (RPCA) for moving-targets detection. The
compensation and calibration are first applied, based on experiment, to the input signal. Then,
RPCA via Gradient Descents (RPCA-GD) is adopted to model the low-rank noisy background.
A new update method for RPCA is proposed to decrease the processing time. Objects moving
in the foreground are localized using an Automatic Multiscale-based Peak Detection (AMPD)
method. All processing steps are based on a sliding window approach, and the proposed
scheme shows impressive results in both processing time and accuracy compared to other
RPCA-based approaches when using real signals in various experimental scenarios.
Moreover, in this study, we address the problem of object semantic segmentation as
pavement crack detection and segmentation in pixel-level based on Deep Neural Network
(DNN) using gray-scale images. We propose a novel DNN architecture, which contains a
modified U-net network and a high-level features network. A further important contribution is
the combination of these networks afforded through the fusion layer. This combination is
surprisingly able to boost the system performance. We implement and thoroughly evaluate our
proposed system on two open datasets: The Crack Forest Dataset (CFD) and the AigleRN
dataset. Experimental results show that our system outperforms eight state-of-the-art methods
on two open datasets.
Finally, to confirm the effectiveness of ours propose algorithm on radar signal and image,
our drone system is applied for inspection of the wind turbine at wind turbine farm and
monitoring the growth stage of plant in agriculture field. The experiments are conducted at
YongGwang wind turbine farm, Gwangju Institute of Science and Technology and Chonnam
National University. The experimental results show that our system is safe, achieve high
accuracy with real-time speed.
xii
Chapter 1. INTRODUCTION
1. Drone system overview
Over last decade, unmanned aerial vehicles (UAV) have been widely adopted and
achieved many successes in military applications such as anti-aircraft target practice,
intelligence gathering and then, more controversially, as weapons platforms [1]. From
technology point of view, a drone is an UAV, which can be considered as a flying robot.
Basically, the drone can be remotely controlled or autonomously controlled through software
controlled flight plans in their embedded system working with various sensors. Recently, drone
is also widely used for non-military applications such as search and rescue, disaster response,
wildlife monitoring, firefighting, agriculture, and healthcare as shown in Figure 1.1. In this
research, we study the radar signal processing and object segmentation using drone system.
The following sections briefly introduce our drone system hardware configuration and system
architecture, and applications. The objectives and main contributions of this thesis are also
considered. Finally, the outline of this thesis is provided in the last section of this chapter.
(a)
(b)
(c)
(d)
Figure 1.1. The drone system applications. (a) Monitoring applications; (b) Firefighting
application; (c) Rescue application; (d) Agriculture application.
13
1.1. Drone system hardware configuration
The drone system prototype used in this study is designed and assembled to effectively
acquired image and avoid collision with other obstacles. The prototype is developed based on
Tarot T960 Foldable Hexacopter because it is a great platform to carry over 2kg payload and
able to fly over 20 minutes with only one battery package. For our monitoring task, the drone
system is equipped with four essential components: a camera (Digital camera or Raspberry Pi
camera), a radar sensor (IR-UWB radar or FMCW radar), an MCU flight controller, and a LTE
Wifi module as shown in Figure. 1.2.
(a)
(b)
Figure 1.2. The prototype of drone system (a) Using Digital camera and IR-UWB radar, (b)
Using RPi Camera and FMCW radar.
In Figure 1.2 (a), the Alpha a7R II Mirrorless Digital Camera is selected to capture the
input images due to high resolution and fast capturing image. Moreover, the camera can
connect with remote control via wireless antennas. The captured images are previewed via
mobile phone and sent to the ground station using LTE module. While the drone is flying, the
vibration makes captured images have strong blur effects. To overcome these vibration
problems, the Saga gimbal is used. The total weight of the camera and gimbal is about 2.2kg.
Captured images are sent to the ground station via a LTE module. Moreover, in another
application as in Figure 1.2 (b), the Raspberry Pi camera is used due to lightweight and
acceptable resolution. The capture images are transmitted to ground station via LTE module.
14
The radar sensor is performed measuring and providing distance data to MCU to maintain
distance and avoid collision between drone and obstacles. The radar sensor is combined with
Raspberry Pi (RPi) for signal processing.
The main controller of the drone system is Micro Controller Unit (MCU) working as the
human brain. All algorithms such as path planning, locating by GPS, controlling motors,
avoiding obstacles, maintaining distance are performed by MCU.
The base station includes a manual remote controller and a computer to monitor the flying
and manually operate the UAV if necessary. On the other hand, received images from the drone
are processed in the base station computer to give fruitful information to users.
1.2. Drone system architecture
The architecture of our drone system is depicted in Figure 1.3. On the drone, GPS sensor
and compass sensor signals are sent to MCU to autonomous locate, navigate. After that, these
signals are transmitted to ground station via telemetry for flight monitor and manual remote if
necessary. The distance between the drone and other obstacles are measured by radar sensor
based on distance measurement algorithm on RPi, this measured data is treated as the input of
the Proportional-Integral (PI) controller. The output of PI controller is the control signal to the
propeller via electronic speed controllers (ESCs). The camera is used for capturing images and
sending them to the ground station via the LTE system.
At ground station, the telemetry is used to receive localization and navigation signals for
mission planner monitoring. The mission planner monitoring software is provided by the
manufacturer. Moreover, the captured images are received via LTE router. A trained deep
convolutional neural networks (CNNs) model with a non-overlapping sliding window is
applied to extract the favorable information from input images.
15
Figure 1.3. The proposed system architecture.
2. Drone applications in this study
As aforementioned, the use of drones outside the military has grown enormously over the
past decade. The integration of drone and internet of things (IoT) has created numerous
applications. In this study, we investigate our proposed algorithms on wind turbine (WT)
inspection application and plant growth state monitoring application as shown in Figure 1.4.
Wind energy is increasing and becoming one of the critical renewable energy resources
all over the world. With these developments, WT maintenance is a crucial task with potential
challenges and time consuming. Due to that, we propose a drone system with equipped camera
and radar sensor to detect precise sematic abnormal appearances on wind turbine surface.
In agriculture applications, the monitoring of the crop growth stage in all steps starting
from seedlings, planting, watering, disease controls, and harvesting is critical task. The reliable
information of crops enables the farmer to carry out timely interventions to increase global
crop yields. Agricultural researchers conventionally make the observation by manual; however,
this traditional method is intensive, time-consuming, costly and difficult to expand to a large
field. In this study, a drone system based on convolutional neural network is proposed to
perform the aforementioned goal.
16
(a)
(b)
Figure 1.4. Drone system applications. (a) Wind turbine inspection, (b) Plant growth stage
recognition.
3. Objectives of the study
In this study, we aim to develop and implement radar signal processing algorithms and
the object segmentation algorithm for drone system. There are two main requirements for radar
system: the hardware must be small size and lightweight, the software algorithm must be
reliable and worked with real-time speed. The output of the radar system is the distance
between the radar and obstacles. We develop our algorithms on both two kind of radar contains
IR-UWB radar and FMCW radar. We test our radar system in practical environments. We
achieve very promising results and better performance in comparison with other methods. For
object segmentation task, we propose a new deep convolution neural network architecture. We
train and test our network on two open datasets namely CFD dataset and AigleRN dataset for
segment cracks from the input image in pixel level. The experimental results show that our
method is out perform eight state-of-the-art methods for cracks semantic segmentation on the
same dataset.
Based on these above achievements of radar processing and image processing, we apply
these algorithms on two main applications: Wind turbine inspection and recognition of plant’s
growth stage.
17
4. Contribution of the thesis
In this study, we propose to develop the distance estimation system using IR-UWB radar,
moving object detection system using FMCW radar and object segmentation system based on
Deep Convolutional Neural Network.
This thesis makes the following contributions:
-
We introduce the new impulse radar sensor with novel hardware configuration.
-
We investigate the new software algorithm to estimating distance between radar and
obstacle based on filters and logarithm compensation method.
-
We propose a critical updating method to enhance the performance and processing
speed on FMCW radar system based on RPCA via GD.
-
We conduct the new deep neural network structure for object segmentation problems
on crack dataset.
-
We evaluate the drone system on two main applications namely wind turbine
inspection and plant growth stage using drone system to confirm the effectiveness of proposed
algorithms on drone system.
5. Outline
The remaining of the study is arranged below:
-
Chapter 2: Proposes a new IR-UWB radar system in both hardware configuration
and software algorithm.
-
Chapter 3: Introduces a novel FMCW radar signal processing algorithm based on
RPCA. We propose a critical update method to improve processing speed of RPCA on radar
signal.
-
Chapter 4. Presents an objective segmentation method based on deep learning. We
introduce a new deep learning network structure for object segmentation problems on cracks
dataset. The experimental results show that our proposed network outperforms eight state-ofthe-art algorithms on open dataset.
18
-
Chapter 5. Shows the drone system applications on wind turbine inspection and plant
growth stage recognition problems.
-
Chapter 6: Draws conclusions and presents some future extension applications of our
proposed drone system and algorithms.
19
Chapter 2. IMPULSE RADAR SIGNAL PROCESSING
1. Motivations
Ultra-Wideband (UWB) technology has become a very popular topic in industrial and
academia. UWB signals have an excellent spatial resolution and good penetration into many
materials, which makes them very interesting for radar applications. The main goal of our
research is to design and implement an IR-UWB sensor system to avoid crashes cause by drone
while flying. Therefore, design a lightweight safety sensor for drone system is the critical
requirement of radar sensor. A crash-avoidance system that make human interaction with the
drone safer is proposed. Whenever a person came near it, the drone flies back away, avoiding
contact with the human.
Distance measurement is the core duty of radar signal processing. IR-UWB can be used
for positioning by utilizing the time difference of arrival (TDOA) of the RF signals to obtain
the distance between the reference point and the target. IR-UWB signals provide accurate
position and location estimation. In practical, IR-UWB is based on transmitting extremely
short pulses and uses techniques that cause a spreading of the radio energy (over a wide
frequency band) with a very low power spectral density. The IR-UWB radar hardware is
proposed to comfortably attach on vehicles and flying object such as drone with small size,
lightweight, low power consumption.
2. The proposed radar system
2.1. Hardware configuration
We attempt to introduce a new IR-UWB radar, which has not been explored in the market,
to detect obstacles. The prototype of the IR-UWB radar system is small enough to be tested
by a drone and it is able to detect in front objects and return the precise distance in real time.
We combine our radar with famous Raspberry Pi module for signal processing. The receive
signal from radar is the input signal of the Raspberry Pi module. The processing algorithm is
executed in RPi module. The final distance result is the transfer to the UAVs hardware via
20
UART port. The UART connection enables for various UAVs system. The critical challenge
is to extract motion features across a wideband signal that has low Signal to Noise Ratio (SNR)
in common sense. Our product is a friendly front-end easy usage device in both hardware and
software design. The radar module hardware configuration is illustrated in Figure 2.1.
Figure 2.1 Radar module hardware configuration.
The radar module includes one transmit antenna (TX) and one receive antenna (RX). The
frequency bands for TX and RX antennas is 7.2 to 10.2 GHz. The antenna signal is transferred
to the Central Processing Unit (CPU), using Raspberry Pi, via Serial Peripheral Interface (SPI)
interface. The system is able to work with the distance up to 15 meters. The output of the
system is transmitted to MCU by UART port on Raspberry Pi. The prototype of our IR-UWB
sensor system is depicted in Figure 2.2.
Figure 2.2. Radar module prototype.
2.2. Software algorithms
2.2.1. Distance measurement algorithm
21
Our idea approaches to predict the distance based on the difference between two
successive recorded frames. In general, a strong variation indicates for the moving target. We
propose a novel IR-UWB signal-processing algorithm based on various filters and logarithm
compensation to accurately measure the distance between radar and obstacles. The flow chart
of distance estimation algorithm is illustrated in Figure 2.3.
Figure 2.3. Distance measurement algorithm flow chart.
According to Figure 2.3, a list of different signal processing techniques is applied here.
The radar is set up to run across a long area to collect pure data in order to observe the
attenuation of signal has the symmetric form. First is the band pass filter where only a certain
frequency range of raw signal is allowed to be passed through. Even that, the output signal is
still very weak due to low emission power. To be convenient, we transform into a one-side
wave by subtracting to the mean value and taking the absolute.
Let assume the raw data at sample n is denoted as 𝑟(𝑛) then its corresponding
normalization ̅̅̅̅̅̅
𝑟(𝑛) is defined as the following equation.
̅̅̅̅̅̅ = 𝑟(𝑛) − 1 ∑𝑁
𝑟(𝑛)
𝑟(𝑛)
𝑁 𝑛=1
(2. 1)
where N is the total of samples at one specific time given by the stick value. For example,
one meter is assigned to 256 samples and in the case of our radar sensor that can detect up to
22
15 meters; the value of N is 3840 samples. The normalization output is depicted in Figure 2.4.
Figure 2.4. Radar data normalization result.
After that, the logarithm regression model is taken to measure the shape of the logarithm
function across the frame. Mathematically, we try to derive the parameters 𝑎 and 𝑏 of the
following equation.
̅̅̅̅̅̅ = 𝑎𝑙𝑜𝑔(𝑛) + 𝑏
𝑟(𝑛)
(2. 2)
Regressing function and data can be visualized in the Figure 2.5.
Figure 2.5. Shape of logarithm function.
For each block condition, we compensate the data by subtracting to its mean value and
then the compensation value represented by the variable. Again the high pass and low pass
filter is applied the second time to stabilize data. To compensate that we propose the Logarithm
compensation weight by empirical approach. We sort the distance and pick the largest value
23