Suitability of groundwater quality for irrigation purpose using geographical information system: A case study of Durg block Chhattisgarh
Bạn đang xem bản rút gọn của tài liệu. Xem và tải ngay bản đầy đủ của tài liệu tại đây (1012.17 KB, 13 trang )
Int.J.Curr.Microbiol.App.Sci (2020) 9(5): 1564-1576
International Journal of Current Microbiology and Applied Sciences
ISSN: 2319-7706 Volume 9 Number 5 (2020)
Journal homepage:
Case Study
/>
Suitability of Groundwater Quality for Irrigation Purpose using
Geographical Information System: A Case Study of Durg
Block Chhattisgarh
Lov Kumar Gupta1*, Kapil Verma2 and Shruti Verma2
1
Soil and Water Engineering, 2Farm Machinery and Power Engineering,
Masturi, Bilaspur, Chhattisgarh-495551, India
*Corresponding author
ABSTRACT
Keywords
Electrical
Conductivity,
Residual Sodium
Carbonate, Sodium
Ratio,Kelly‟s
Index,Permeability
Index
Article Info
Accepted:
15April 2020
Available Online:
10 May 2020
An attempt has been made to understand the ground water quality and its suitability for irrigation
purpose through Geographical Information System. The qualities of groundwater in 646.8 km2 area
of Durg block were assessed for its suitability for irrigation purposes. Groundwater samples data are
analyzed for ionic concentration of C032, HC03-, CI-, S042-, Ca2, Mg2+,Na++and K+. Parameters such
as electrical conductivity (EC), sodium absorption ratio (SAR), % Na and residual sodium carbonate
(RSC) were evaluated. Thematic maps of different parameters were prepared and Samples were
plotted on US Salinity Diagram and H. Wilcox‟s Diagram for better understanding of suitability of
groundwater for irrigation purpose. The EC values of water samples were found to be within good to
permissible limits. The lowest EC in groundwater samples was observed in Bhilai (554 µS/cm)and
the highest in Durg (1593 µS/cm). The output of SAR shows 100 percent of the samples fall under
excellent to good category. The irrigational water quality was classified based on US salinity
diagram indicating that in 4 samples fall under low to moderate saline and 6 samples fall under low
to medium high salinity. The Wilcox diagram shows 4 samples fall under excellent to good category
and 6 samples fall under good to permissible category. Samples were analyzed for water quality
parameters like % Na, PI, RSC and KI and suitability of groundwater samples for irrigation is good
to permissible in almost all cases. Contour maps of pH, EC, SAR, % Na and RSC were plotted to
study spatial variability of these parameters in the block which is helpful to assess the irrigational
water quality of study area.
Introduction
Ground water is the water present beneath
Earth's surface in soil pore spaces and in the
fractures of rock formations. Groundwater has
become the major source of water supply for
domestic, industrial and agricultural sectors of
our country. It constitutes about two thirds of
the fresh water resources of the world. In
India, it is a major source for all purposes of
water requirements. It plays a vital role in the
country‟s economic development and in
ensuring its food security. More than 90% of
rural and nearly 30% of urban population
depend on ground water for drinking water. It
also accounts for nearly 60% of the total
1564
Int.J.Curr.Microbiol.App.Sci (2020) 9(5): 1564-1576
irrigation
potential
in
the
country.
Groundwater plays an important role in
Indian agriculture. The suitability of irrigation
water depends upon many factors including
the quality of water, soil type, salt tolerance
characteristics of the plants, climate and
drainage characteristics of the soil.
The quality of groundwater is deteriorating
due to urbanization, increasing population,
and agricultural chemicals. In addition, the
civil works, landslides, and the change in the
rate of rain infiltration into ground water are
affecting the quality adversely (Ramesh and
Elango, 2012). Groundwater always contains
small amount of soluble salts dissolved in it.
The kind and quality of these salts depend
upon the sources for recharge of the
groundwater and the strata through which it
flows. The excess quantity of soluble salts
may be harmful for many crops. Hence, a
better understanding of the chemistry of
groundwater is very essential to properly
evaluate groundwater quality for irrigation
purpose.
Demand of groundwater has been increasing
day by day for irrigation by bringing more
area under cultivation. The chemical
composition of water is an important factor
for domestic or irrigation purposes. Salinity
and Pollution of well water, either from point
or non-point sources, has become a thing of
health concern both in urban and rural areas.
Features that generally need to be considered
for evaluation of the suitability of
groundwater quality for irrigation are the EC,
SSP, TDS, RSC and SAR. The Most
important cation and anion in a groundwater
resources are Ca2+, Mg2+, Na+, HCO3-, Cl- and
NO3-. Suitability of irrigation water, with
respect to salinity, is assessed on the basis of
the „Electrical Conductivity‟ (EC) or „specific
conductance‟ of a water sample.
Salts in soil or water reduce water availability
to the crop and excessive nutrients reduce
yield or quality. A Geographical Information
System (GIS) is a system of hardware,
software and procedures to facilitate the
management,
manipulation,
analysis,
modeling, representation and display of
geo‐ referenced data to solve complex
problems
regarding
planning
and
management of resources. Functions of GIS
include data entry, data display, data
management, information retrieval and
analysis.
Geographic information system (GIS) has
emerged as a powerful tool for storing,
analyzing, and displaying spatial data and
using these data for decision making in
several areas including engineering and
environmental
fields
(Stafford
1991;
Goodchild 1993; Burrough and McDonnell
1998; Lo and Yeung 2003).Conventional
surveys, apart from being unfeasible in the
inaccessible and inhospitable terrain are
tedious, time consuming and inaccurate in
mapping many features of regional nature due
to lack of regional perspective.
GIS have been increasingly used for recharge
estimation, draft estimation, mapping of
prospective Zones, identification of over
exploited and under developed/ undeveloped
areas and prioritization of areas for recharge
structures which conjunctively facilitate
systematic planning, development and
management of ground water resources on a
sustainable basis.
The spatial distribution maps generated for
various physicochemical parameters using
GIS techniques could be useful for planners
and decision makers for initiating ground
water quality development in the area. The
knowledge of irrigation water quality is
critical to understand what management
changes are necessary for long-term and
1565
Int.J.Curr.Microbiol.App.Sci (2020) 9(5): 1564-1576
short-term productivity, particularly for crops
that are sensitive to changes in quality with an
adequate database, GIS can be a powerful tool
for assessing water quality, developing
solutions for water resource problems, and it
is a decision-making tool for agriculture
development.
Materials and Methods
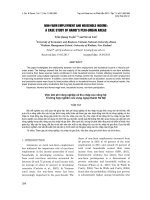
Description of study area
The study area is in the western central part of
Chhattisgarh, dist. Durg and bounded by the
coordinates 21º1ʹ40.55ʺN to 21º21ʹ56.03ʺN
latitude and 81º8ʹ53.88ʺE to 81º25ʹ37.02ʺE
longitude. It covers total geographical area
646.8 km2. Climate of the study area is
tropical type.
Summer is a little bit hotter. Rise of
temperature begins from the month of March
to May. May is hottest amongst other. Annual
average rainfall is 1052 mm. During the year,
most rainfall occurs during the monsoon June
to September. July is the month of highest
rainfall.
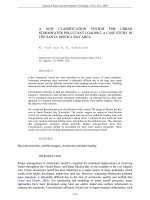
Survey of India (SOI) toposheets (f44p3,
f44p4,f44p7 and f44p8 in 1:50000 scale) were
used for the preparation of the base map. For
analyzing
the
chemical
aspects
of
groundwater in the study area, observation
wells have been selected for investigation.
These observation wells are regularly
maintained by CGWB NCCR Raipur
Chhattisgarh. Water quality data are utilized
in the present study to analyze the
groundwater chemistry.
Samples are analyzed in the laboratory of
NCCR Raipur Chhattisgarh for the major ions
chemistry employing standards methods. The
range of analyzed parameters presented in
table-1.
Important parameters for determining the
suitability of groundwater for irrigation
purposes
Sodium adsorption ratio
It indicates the degree to which irrigation
water tends to enter into cation-exchange
reactions in soil. Sodium replacing adsorbed
calcium and magnesium is a hazard as it
causes damage to the soil structure and
becomes compact and impervious. SAR is
defined as:
SAR =
Na
√(Ca+mg)/2
Where, all the ionic concentrations are in
meq/l.
Percent Na
Sodium concentration plays an important role
in evaluating the groundwater quality for
irrigation as sodium increases the hardness of
the soil and reduces its permeability. The SSP
values are calculated using the formula given
below:
%Na =
(Na + K)*100
Ca + Mg + Na + K
Where, all ionic concentrations are expressed
in meq/l.
Residual sodium carbonate (RSC)
An excess amount of sodium bi-carbonate and
carbonate is considered to be detrimental to
the physical properties of soils as it causes
dissolution of organic matter in the soil,
which in turn leaves a black stain on the soil
surface on drying. This excess amount is
denoted by Residual Sodium Carbonate
(RSC) and is calculated by the following
formula:
1566
Int.J.Curr.Microbiol.App.Sci (2020) 9(5): 1564-1576
RSC= (HCO3- + CO3--) – (Ca++ + Mg++)
where, all the ionic concentrations are
expressed in meq/l.
Kelly’s index (KI)
In Kelly‟s Ration (KR), sodium is measured
against calcium and magnesium to determine
the suitability of irrigation water. When KI is
>1, it indicates higher sodium and vice versa.
KI is calculated by using the formula:
KI =
Spatial distribution of physio-chemical
parameters of groundwater
pH
Na
Ca+Mg
where, all ionic constituents are expressed in
meq/l.
Permeability index (PI)
The soil permeability is affected by long-term
irrigation influenced by Na+, Ca2+, Mg2+
and HCO3 contents of the soil. The
permeability index values also indicate the
suitability of groundwater for irrigation. PI is
calculated as follows:
PI =
Quality Indices shows, for EC 40 % samples
fall under good category and 60 % samples
are fall under permissible range. % Na values
of study area 30% sample fall under
Excellent, 60 % under good and 10 %
samples are fall under permissible class. The
values of SAR, RSC, KI and PI fall under
100% suitable for irrigation.
(Na + √HCO3)*100
Ca + Mg + Na
Where, all ionic concentrations are expressed
in meq/l.
Results and Discussion
In present study, it has been found that the pH
in the study area has shown variation from 7.3
to 8 Almost all samples were within
maximum permissible limit prescribed by BIS
for study area. Electrical Conductivity in
groundwater varies from 554 to 1400μs/cm.
Values of SAR,% Na, RSC, KI and PI highest
in Marauda. Classification of Samples
according to Standards specified for Water
The pH value of natural water is a measure of
its alkanity or acidity and The pH value is a
measure of hydrogen ion concentration. The
pH value of groundwater in study area varies
from 7.3 to 8.0 with an average of 7.65, which
indicates that water is almost natural in
nature.
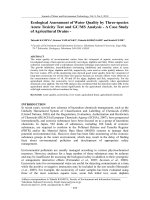
Electrical conductivity (EC)
Conductivity is the measure of capacity of a
substance to conduct the electric current.
Most of the salts in water are present in their
ionic forms and capable of conducting current
and conductivity is a good indicator to assess
groundwater quality. The EC in study area
varies from 554 to 1593 with an average of
1073.5 S/cm at 25º C. The lowest EC in
groundwater samples was observe in Bhilai
and the highest in Durg. Location specific
variability of EC in the block is shown by
spatial variable Map.
Sodium (Na)
Na is the sixth most abundant element on
Earth and is widely distributed in soils, plants,
water and foods. Groundwater contained
some Na because most rocks and soils
contains Na compounds from which Na is
easily dissolved Na concentration range 15.5
to 85 mg/l with an average of 50.25 mg/l.
1567
Int.J.Curr.Microbiol.App.Sci (2020) 9(5): 1564-1576
Location specific variability of Na in the
block is shown by spatial variable Map.
Magnesium (Mg)
Mg is the eighth abundant natural element.
The Mg concentration ranges between 4 to 38
mg/l with an average of 21 mg/l. Location
specific variability of Mg in the block is
shown by spatial variable Map.
Potassium (K)
K is an element commonly found in soils and
rocks. In water K has no colour or smell, but
may give water a salty test. Sources of K
include weathering and erosion of K bearing
minirals such as feldspar and leaching of
fertilizer. The K concentration ranges varies
between 0.5 to 18.2 mg/l. with an average
value 9.25 mg/l. Location specific variability
of K in the block is shown by spatial variable
Map.
Bicarbonate (HCO3)
The primary source of HCO3 ions in
groundwater is the dissolved carbon dioxide
in rain and snow, which as enters the soil
dissolves more carbon dioxide. The pH of
water indicate the form in which carbon
dioxide is present in water. The HCO3
concentration ranges varies between 98 to
317mg/l. with an average of 207.5 mg/l.
Location specific variability of HCO3 in the
block is shown by spatial variable Map.
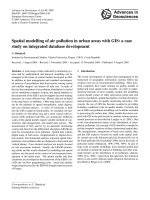
Sodium absorption ratio (SAR)
There is a significant relationship between
SAR values of irrigation water and the extent
to which sodium is absorbed by the soil. If
groundwater used for irrigation is high in
sodium and low in calcium, the cationexchange complex may become saturated
with sodium. This can destroy the soil
structure owing to dispersion of the clay
particles. The SAR values ranges from 0.43 to
2.47 and according to SAR classification
100% of water sample fall in the excellent
category and can be used for irrigation on
almost all soils. A more detailed analysis of
the suitability of water for irrigation was
made by plotting the data on US Salinity
Laboratory diagram.
US salinity laboratory diagram
In order to assess the US Salinity laboratory
(1954) has adopted an irrigation water
classification based upon SAR and EC. The C
and S classification adhere to the description
of the diagram draw on semi log paper with
SAR on ordinary scale. This classification is
extensively used worldwide and consists of
16 groups of irrigation water C1S1, C2S2,
S2C1, S2C2 etc. Based on the SAR values, all
samples have low sodium hazard and on
plotting over the U.S. Salinity diagram the
water samples of study area fall in the
C2S1classes and C3S1classes and hence can be
consider suitable for irrigation with low
sodium hazard and medium to high salinity
hazard.
Residual sodium carbonate (RSC)
Percent sodium (%Na)
The RSC concentration ranges vary between 11.78 to 0.72. More than 100% sample fall
under Low RSC of an area 646.8km2.
Location specific variability of RSC in the
block is shown by spatial variable Map.
%Na in Groundwater is an important
parameter in deciding the suitability of water
for irrigation as Na reacts with soil resulting
in decreasing permeability of soil. The % Na
values ground water range from 10 to 45.
1568
Int.J.Curr.Microbiol.App.Sci (2020) 9(5): 1564-1576
The %Na values in study area fall 30% in
excellent class, 60% in good and 10% in
permissible class. In the present investigation,
the spatial distribution map (Fig.4.9) indicates
that the “Excellent” cover an aerial extent of
267.05 km2 and “Good” covers an aerial
extent of 313.6 km2 and “Permissible” cover
an aerial extent of 53.3 km2
H. Wilcox’s diagram
Another method for determination of
suitability for agricultural use in groundwater
is
by calculating %Na (Wilcox,1955),
because Na+ concentration reacts with soil to
reduce
its
permeability
(Todd,
1980).Percentage of sodium values of
groundwater samples indicate that the four
groundwater samples show Excellent to Good
or 6 samples Good to Permissible category for
irrigation use.
Suitability of groundwater for irrigation
purposes
The groundwater quality of Durg block of
Durg District, Chhattisgarh has been assessed
for its suitability for irrigational purposes. The
study has also demonstrated the utility of GIS
technology combine with laboratory analysis
in evaluation and mapping of groundwater
quality in block. Hydro chemical facies
analysis as well the pH of water, both
indicates that groundwater in the area is
natural in condition. The electrical
conductivity values of water samples are
found to be within good to permissible limits
during sampling sessions.
Table.1 Chemical Analysis Results (2015)
S No.
1
2
3
4
5
6
7
8
9
10
Location
Ravelidih
Maroda
Anda
Jeora-sirsa
Ganiyari
Konari
Durg
Utai
Bhilai
Kachandur
Lat.
21.3
21.2
21.1
21.3
21.2
21.2
21.2
21.1
21.2
21.3
Long.
81.3
81.3
81.3
81.3
81.2
81.3
81.3
81.4
81.4
81.3
pH
7.3
7.6
7.5
7.7
7.6
8
7.5
7.5
7.5
7.6
EC
578
792
1400
788
1127
704
1593
810
554
740
TH
250
225
525
310
465
250
670
315
170
290
Na
15.5
85
58
38
21.7
49.7
40
35.9
41.4
36
K
0.6
0.7
4.5
18.2
1.3
1
4
0.5
2.9
1.5
Ca
78
50
182
104
122
94
230
110
60
68
Mg
13
24
17
12
38
4
23
10
5
29
HCo3
128
317
256
195
244
268
98
201
104
250
Table.2 Irrigation water quality parameters
Sl.
1
2
3
4
5
6
7
8
9
10
Location
Ravelidih
Marauda
Anda
Jeora-sirsa
Ganiyari
Konari
Durg
Utai
Bhilai
Kachandur
pH
7.3
7.6
7.5
7.7
7.6
8
7.5
7.5
7.5
7.6
EC
578
792
1400
788
1127
704
1593
810
554
740
SAR
0.43
2.47
1.1
0.94
0.44
1.36
0.67
0.88
1.38
0.92
SSP
11.94
45.23
19.37
21.07
9.28
30.05
11.49
19.8
34.54
21.29
1569
%Na
12
45
20
25
10
30
12
20
35
22
RSC
-2.87
0.72
-6.3
-2.99
-5.23
-0.64
-11.78
-3.02
-1.71
-1.69
KI
0.14
0.83
0.24
0.27
0.1
0.43
0.13
0.25
0.53
0.27
PI%
37.61
73.13
35.1
43.88
28.94
59.21
19.87
42.82
59.59
48.83
Co3
Nil
Nil
Nil
Nil
Nil
Nil
Nil
Nil
Nil
Nil
Int.J.Curr.Microbiol.App.Sci (2020) 9(5): 1564-1576
Table.3 Classification of Samples according to Standards specified for Water Quality Indices
Parameters
EC
SSP
RSC
SAR
MAR
KI
PI
Range
< 250
250 - 750
750 - 2000
2000-3000
> 3000
< 20
20 - 40
40 - 60
60 -80
> 80
< 1.25
1.25 – 2.5
> 2.5
0 - 10
10 -18
18 -26
> 26
≤ 50
> 50
<1
>1
25% - 75%
> 75%
Class
Excellent
Good
Permissible
Doubtful
Unsuitable
Excellent
Good
Permissible
Doubtful
Unsuitable
Low
Medium
High
Excellent
Good
Permissible
Doubtful
Suitable
Unsuitable
Suitable
Unsuitable
Suitable
Unsuitable
Number of sample
0
4
6
0
0
3
6
1
0
0
10
0
0
10
0
0
0
10
0
10
0
10
0
Fig.1 Map of the study area
1570
% of sample
0
40
60
0
0
30
60
10
0
0
100
0
0
100
0
0
0
100
0
100
0
100
0
Int.J.Curr.Microbiol.App.Sci (2020) 9(5): 1564-1576
Fig.2 Location map of sampling point in Durg block
Fig.3 Spatial Distribution of pH
Fig.4 Spatial Distribution of EC
1571
Int.J.Curr.Microbiol.App.Sci (2020) 9(5): 1564-1576
Fig.5 Spatial Distribution of Na
Fig.6 Spatial Distribution of Mg
Fig.7 Spatial Distribution of K
Fig.8 Spatial distribution of HCO3
1572
Int.J.Curr.Microbiol.App.Sci (2020) 9(5): 1564-1576
Fig.9 Spatial distribution of RSC
Fig.10 Spatial distribution of SAR
Fig.11 US Salinity Diagram
1573
Int.J.Curr.Microbiol.App.Sci (2020) 9(5): 1564-1576
Fig.13 H. Wilcox‟s Diagram
Fig.12 Spatial distribution of %Na
The EC in study area varies from 554 to 1593
with an average of 1073.5 S/cm. The lowest
EC in groundwater samples was observe in
Bhilai and the highest in Durg. The output of
SAR shows 100 per cent of the samples fall
under excellent to good category.
The irrigational water quality was classified
based on US salinity diagram indicating that
in 4 samples fall under C2-S1 class which
shows low to moderate saline and 6 samples
fall under C3-S1 class which shows low to
medium high salinity. The Wilcox diagram
shows 4 samples fall under excellent to good
category and 6 samples fall under good to
permissible category.
Based on the water quality parameters
analyzed like %Na, PI, RSC and KI the
suitability of groundwater samples for
irrigation is good to permissible in almost all
cases.The groundwater will neither cause
salinity hazards nor have an adverse effect on
the soil properties and are thus largely
suitable for irrigational purpose.
References
Aghazadeh N., Mogaddam,A.A. 2010.
Assessment of groundwater quality and
its suitability for drinking and
agricultural uses in the Oshnavieh area,
Northwest of Iran, J. Environ. Prot,
Vol.1, pp.30-40.
Balachandar D., Sundararaj P., Rutharvel
Murthy K. , Kumaraswamy K. 2010.An
Investigation of Groundwater Quality
and Its Suitability to Irrigated
Agriculture in Coimbatore District,
Tamil Nadu, India – A GIS Approach,
International journal of environment
sciences, vol 1,No2, ISSN 0976 – 4402.
Balakrishnan, P., Saleem, Abdul and
Mallikarjun, N. D. 2011. Groundwater
quality
mapping using geographic
information system (GIS): A case study
1574
Int.J.Curr.Microbiol.App.Sci (2020) 9(5): 1564-1576
of Gulbarga City, Karnataka, India,
African Journal of Environmental
Science and Technology, Vol. 5(12), pp.
1069-1084,ISSN:1996-0786.
Bauder, J. W. and T.A. Brock. 2001.
Irrigation water quality, soil amendment
and crop effects on sodium leaching.
Arid Land Res. Manage., 15:101-113.
Doneen, L.D. 1961. Notes on water quality in
Agriculture. Published as a water
science and Engineering Paper 4001,
Department of Water Sciences and
Engineering. University of California.
Durbuded. G., and Vararrajan, N. 2007.
Monitoring
and
mapping
of
groundwater quality. Journal of Applied
Hydrology, v.xx, No. 1&2, pp.22–30.
Fulazzaky, M.A. 2009. Water quality
evaluation system to assess the status
and the suitability of the Citarum river
water to different uses. Journal of
Environmental Monitoring., 168, 669–
684.
Gupta, R.K, Singh, N.T. and Sethi, M. 1994.
Water Quality for Irrigation in India.
Tech. Bull. 19, CSSRI, Karnal, India.
Hakim, M.A. Juraimi, A.S., Begum, M.,
Hasanuzzaman, M. and Uddin, M.K.
2009.
Suitability
evaluation
of
groundwater for irrigation, drinking and
industrial purposes. American Journal
of Environmental Sciences., 5: 413-419.
Jeihouni, M., Toomanian, A., Shahabi, M.,
Alavipanah, S. K. 2014. Groundwater
Quality Assessment for Drinking
Purpose Using GIS Modeling. The
International
Archives
of
the
Photogrammetry,
International
Conference on Geospatial Information
Research Volume XL 2/W3-163.
K.Ambiga, Dr. R. Anna Durai 2015.Use of
Geographical Information System and
Water Quality Index To Assess
Groundwater Quality In and Around
Ranipat Area, Vellore District, Tamil
Nadu,
International
Journal
of
Advanced Engineering Research and
Studies,ISSN:2249–8974.
Kumar, Sanjay, Sharma, S.K., Satyavan, and
Sharma, Ramesh 2014. GIS Mapping of
Groundwater Quality of Bahadurgarh
Block of Jhajjar District, Journal of soil
and water conservation, 13(2):134 - 139
ISSN:022 - 457.
Meireles, A.C.M., E.M. Andrade, L.C.G.
Chaves, H. Frischkorn and L.A.
Crisóstomo 2010. A new proposal of
the classification of irrigation water
RevistaCienciaAgronomica, 41(3): 349357. 37(17): 4119-4124.
Michael, A.M. and Ojha, T.P. 2013. Principle
of agriculture Engineering vol-2, Jain
Brothers New Delhi. 20:1059-1065.
Michael, A.M., 2007. Irrigation: Theory and
Practice, Vikas Publishing House Pvt.
Ltd., New Delhi, 14:661-694.
Nag, S.K. , Das, shreaya 2014. Groundwater
Quality for Irrigation And Domestic
Purpose – A GIS Based Case Study of
Suri I And II Block, Birbhum District,
West
Bengal,
India.International
Journal of Advancement in Earth and
Environmental
Sciences,
IJAEES
(2014) Vol.2, No.1, 25-38 ISSN: 2321
– 9149.
Prabhjot Singh Bhuie, 2008. Analysis of
shoreline changes in the coastal region
of west Bengal using image processing
and photogrammetric techniques. M.
Tech. thesis Report, Department of
Remote sensing, Birla Institute of
technology,
MESRA-835215,
RANCHI, pp. 72-75.
Ramakrishnaiah, C.R., C. Adashiv and
G.Ranganna 2009. Assessment of Water
Quality Index for the Groundwater in
Tumkur Taluk, Karnataka State, India.
European
Journal
of
Organic
Chemistry, 6: 523-530.
S, Nair, Archana, M., April 2004. Geographic
Information System and groundwater
quality mapping in Panvel Basin,
1575
Int.J.Curr.Microbiol.App.Sci (2020) 9(5): 1564-1576
Maharashtra,
India,
Journal
Environmental Geology, Volume 45,
Issue 6 ISSN:0943-0105, pp 756-76.
Shah, S. M. and Mistry, N. J.
2013.
Groundwater Quality Assessment for
Irrigation Use in Vadodara District,
Gujarat, India World Academy of
Science, Engineering and Technology,
Vol:7 2013-07-23.
Shihab, A.S., Al-Rawi, S.M. 1994.
Application of water quality index to
Tigris River within Mosul city.
Rafidain,J. Sci., 4, 80–92.
Sinha, A.K., Kumar, Vinay and Singh, P.K.,
2018. International Journal of Current
Microbiology and Applied Sciences,
ISSN: 2319-7706 Special Issue-7 pp.
1313-1332.
Subramani, T, Krishnan P.S., Kuaresan, K.P.
may-June 2012, Study of Groundwater
Quality with GIS Application for
Coonoor
Taluk
in
Nilgiri
District,International
Journal
of
Modern
Engineering
Research
(IJMER),Vol.2, Issue.3, pp-586-592
ISSN: 2249-6645.
Suresh T.S., Naganna C., Srinivas, G. 1991.
Study of water quality for agricultural
use in Hemavathy river (Karnataka)
Hydrology.Journal Indian Association
Hydrology, 14(4):247–254.
Todd, D.K. 1980. Ground Water Hydrology,
Jhon Velly and sons Pvt. Ltd New
York. 7:267-291.
Wilcox, L.V 1955. Classification and use of
irrigation waters. US Department of
Agriculture, Arc 969, Washington DC.
Yammani , S. 2006. Groundwater quality
suitable zones identification: application
of GIS, Chittoor area, Andhra Pradesh,
India, Environ Geol-634-1.
How to cite this article:
Lov Kumar Gupta, Kapil Verma and Shruti Verma. 2020. Suitability of Groundwater Quality
for Irrigation Purpose using Geographical Information System: A Case Study of Durg Block
Chhattisgarh. Int.J.Curr.Microbiol.App.Sci. 9(05): 1564-1576.
doi: />
1576