Optimum LAI for yield maximisation of finger millet under irrigated conditions
Bạn đang xem bản rút gọn của tài liệu. Xem và tải ngay bản đầy đủ của tài liệu tại đây (465.9 KB, 13 trang )
Int.J.Curr.Microbiol.App.Sci (2020) 9(5): 1535-1547
International Journal of Current Microbiology and Applied Sciences
ISSN: 2319-7706 Volume 9 Number 5 (2020)
Journal homepage:
Original Research Article
/>
Optimum LAI for Yield Maximisation of Finger Millet under
Irrigated Conditions
Mujahid Anjum, Y. A. Nanja Reddy* and M. S. Sheshshayee
Department of Crop Physiology, University of Agricultural Sciences,
Bengaluru-560065, Karnataka, India
*Corresponding author
ABSTRACT
Keywords
Plant density, leaf
area, photosynthetic
rate, productive
tillers, grain yield
Article Info
Accepted:
10April 2020
Available Online:
10 May 2020
Field experiment was conducted during summer, 2018 to determine the influence
of LAI on yield maximisation in finger millet genotypes by varying plant
densities. Maximum grain yield was obtained at the plant density of 44.4 to 66.6
hills m-2 but above or below. The source size (LAI) and source activity
(photosynthetic rate) were not the limitations for yield maximisation under
optimal irrigation and; LAI of 6.5 to 7.0 was optimum for maximum finger millet
yield especially in variety, GPU-28. The sink traits, namely productive tillers per
m-2 and mean ear weight were compensated to each other (r = -0.967***). The
plant density of 44.4 hills m-2 (22.5 cm x 10 cm) could be optimum for irrigated
finger millet. Further yield enhancement could be possible by increasing
productive tillers (up to 5.0 per hill) with plant density of 44.4 hills m-2 varying
spacing to 30.0 cm x 7.5 cm.
Introduction
Finger millet is a C4 crop belongs to family
poaceae (Dida et al., 2007) cultivated in arid
and semi-arid regions in more than 25
countries. In India as a staple food and fodder
crop, it is cultivated an area of 1.19 million
hectares with a production of 1.98 lakh tones
and productivity of 1661 kg ha-1, Karnataka
being the major producer to the extent of 58
per cent (Anon., 2015; Sakamma et al., 2018).
Although finger millet is cultivated as rainfed
crop by more than 90% area (Davis et al.,
2019), crop being responsive to irrigation and
external fertilizer application (Gull et al.,
2014; Thilakarathna and Raizada, 2015;
Ramakrishnan et al., 2017; Wafula et al.,
2018), it is cultivated during summer season
wherever irrigation facilities are available.
Finger millet is highly nutritious crop with its
composition of protein (7.3%), fat (1.3%),
carbohydrates (72.6%), dietary fibre (18%),
1535
Int.J.Curr.Microbiol.App.Sci (2020) 9(5): 1535-1547
Ash (3.0%), calcium (352mg/100g) and
Leucine, 594 mgg-1 of protein (Shobana et al.,
2013; Devi et al., 2014; Chandra et al., 2016;
Gupta et al., 2017; Sharma et al., 2017). In
addition, it has high soluble fibre,
polyphenols coupled with high resistant
starch, thus slow hydrolysis of starch and;
gaining importance with increasing diabetic
population (Kumari and Sumathi, 2002).
For yield improvement of finger millet, early
research efforts were made to select large ear
size as the tiller number was not a constraint
(8.0 tillers hill-1 in popular varieties at that
time, Krishnamurthy, 1971). Probably,
selection for ear size with time, the tiller
numbers might have compensated with ear
size and resulted in selection of shy tillering
genotypes. It is clearly evident in the popular
variety GPU-28 which has only 2 to 2.5 tillers
hill-1 with a mean ear weight of 6.0 to 7.0 g
(Prakasha et al., 2018). In recent years, it was
observed that the major yield attributes in
finger millet are the productive tillers
(contributes to 54 % of yield), followed by ear
weight and test weight although it is
genotypic character (Anon., 2015). Increase
in productive tillers per unit land area can be
achieved by manipulating the population
density
(Richards,
2000).
Therefore,
additional productive tiller per hill could
enhance the potential yield of GPU-28.
Formation of productive tillers and
consequent grain yield of finger millet are
determined by the source size and activity.
The source size in finger millet is not a major
limitation as a cereal crop (Patrick, 1988) and
the photosynthetic rate is also relatively high
being a C4 species (Berdahl et al., 1971; Ueno
et al., 2006). Hence, tiller production is an
important sink trait in determining the grain
yield which can be addressed though
manipulating the planting density under
adequate irrigation and soil fertility.
Therefore, the optimum source size (LAI) and
productive tillers required for maximum grain
yield in finger millet was investigated with
varying plant densities.
Materials and Methods
The experiment was conducted during
summer, 2018. Three finger millet genotypes
(GE-292, GE-199 and GPU-28) were
evaluated in factorial RCBD comprising of
seven spacing treatments (given with data) in
four replications. Experiment was conducted
at the Field Unit, Department of Crop
Physiology, Zonal Agricultural Research
Station, GKVK, University of Agricultural
Sciences, Bengaluru-65. The finger millet
genotypes were sown on 12/01/2018 in plastic
portrays and 17 days old seedlings were
transplanted in the main field (29/01/2018) in
five rows of 1.2 meter length with respective
spacings as per the treatments.
At the time of flowering, observations on leaf
area, light penetration, chlorosis of older
leaves and photosynthetic rate were
measured. The 3rd leaf area (length x width x
0.75) was multiplied by total number of
leaves in all the tillers in a hill to arrive at leaf
area per plant. The leaf area index (LAI) was
computed by dividing the total leaf area with
the spacing per hill according to the
treatments. The light insolation at ground
level (light penetrated to the ground) was
recorded by placing the light quantum sensor
(Li-Cor) between the rows. The number of
basal leaves turned yellow (more than half
part of the leaf becomes chlorotic) on the
main tiller was counted at 20 days after
anthesis. The photosynthetic rate was
measured using Infrared Gas Analyser
(IRGA) (Cyrus) from 9.00 to 11.00 AM on
20th day after flowering. The yield attributes
viz., productive tillers, mean ear weight and
test weight were measured at the time of
harvest. All these measurements were made in
net plot area of three rows of 1.0 meter row
1536
Int.J.Curr.Microbiol.App.Sci (2020) 9(5): 1535-1547
length and computed to per square meter area.
The spikelet fertility was calculated by cutting
2cm finger length and carefully counted the
number of florets and seeds. The fertility was
then calculated as the number of filled grains /
total number of florets multiplied by 100. The
data was statistically analysed in factorial
RBD using OPSTAT (Sheoran et al., 1998).
Results and Discussion
Early efforts on yield improvement of finger
millet were basically through selection for
large ear size, wherein productive tillers per
hill was not a constraint (Krishnamurthy,
1971). Next stage of improvement was
through plant breeding efforts for blast
resistance combined with adoption of
improved management practices. In recent
years, finger millet yield has reached a
plateau (Swetha, 2011). Among the cultivated
varieties, most popular variety GPU-28 is a
shy tillering type with relatively a large ear
size (Prakasha et al., 2018). Therefore, the
plant density was altered to increase the leaf
area, productive tillers and consequent grain
yield of finger millet.
The plant density of 44.4 m-2 (recommended
spacing of 22.5 cm x 10cm) resulted in higher
grain yield of 737.7 g m-2 over the plant
density of 33.3 m-2 (645.2g m-2) and 22.2 m-2
(613.0 g m-2). The higher plant density (66.7
m-2) and more did not increase the grain yield
significantly (Table 1). Similarly, increase in
row spacing from 20 to 30 cm (Bitew and
Asargew, 2014; Dereje et al., 2016) and row
spacing up to 45 cm (Yoseph, 2014) have
increased the grain yield significantly; with
no significant differences between 30 and 45
cm row spacing (Yoseph, 2014). The plant
density with higher spacing of 45 cm and
above between the rows decreased the grain
yield due to reduced number of tillers per unit
area (Bitew and Asargew, 2014; Dereje et al.,
2016). Therefore, the optimum spacing could
be between 20 to 30 cm between rows and 7.5
to 10 cm between the plants. The increased
grain yield was due to increased total biomass
production (r = 0.457*, Table 2) with no
influence of harvest index (HI) as HI did not
differ between treatments (Table 1). Similarly
significant positive association between
biomass and grain yield has been reported
(Negi et al., 2017; Prakasha et al., 2018;
Nanja Reddy et al., 2019; Chavan et al.,
2020; Somashekhar and Loganandhan, 2020).
Such biomass production will be determined
by the LAI and photosynthetic rate.
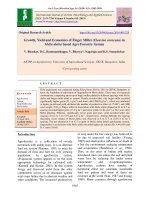
The LAI (source size) showed a positive
significant relationship with biomass (r =
0.803**), productive tillers (r = 0.687**) and
grain yield (r = 0.528*) (Table 2). The mean
grain yield was increased with an increase in
LAI up to 7.0, beyond which the grain yield
was decreased (Fig. 1a). Among the varieties,
GPU-28 gave the grain yield of 685.3 g m-2 at
the recommended spacing of 22.5 cm x 10 cm
(LAI of 7.96), while narrow spacing (15 cm x
10 cm) marginally increased the grain yield
(711.1 g m-2, the LAI was 6.34) and further
increase in plant density (up to 200.0 m2 by
10 cm x 5 cm) did not result in higher grain
yield significantly (Table 1).
These results imply that the optimum LAI for
higher grain yield could be between 6.5 and
7.0 especially in case of variety, GPU-28. At
plant density above 44.4 m-2, the light
penetration to the ground level was decreased
with an increased chlorosis of older leaves
(Table 3). Probably, at narrow spacing with
higher LAI, the microclimate has poor
aeration and lead to higher maintenance
respiration, and reduced grain yield by
reducing the partitioning (harvest index). The
wider spacing reduced the LAI significantly
as compared to the recommended spacing
(22.5 cm x 10 cm), biomass production and
grain yield.
1537
Int.J.Curr.Microbiol.App.Sci (2020) 9(5): 1535-1547
Table.1 Effect of plant densities on biomass, harvest index and grain yield in finger millet genotypes
Spacing
(cm x cm) /
Varieties
Biomass (g m-2)
GE292
1548
GE199
1534
GPU28
2056
Mean
T1 (30 x 15)
Plant
density
(No.
m-2)
22.2
T2 (30 x 10)
33.3
1745
1598
T3 (22.5 x 10)
44.4
1838
T4 (15 x 10)
66.7
T5 (10 x 10)
Grain yield (g m-2)
Harvest index
GE199
0.41
GPU28
0.32
Mean
1713
GE292
0.36
2019
1788
0.41
0.40
1932
2437
2069
0.41
2439
2036
2108
2194
100.0
2199
2123
2098
T6 (10 x 7.5)
133.3
2206
1790
T7 (10x 5)
200.0
2026
Mean
GE199
623.2
GPU28
662.6
Mean
0.36
GE292
556.0
0.29
0.37
718.7
635.7
581.2
645.2
0.41
0.28
0.36
745.2
782.7
685.3
737.7
0.32
0.38
0.34
0.34
776.3
776.5
711.1
754.7
2140
0.30
0.37
0.32
0.33
661.5
774.1
665.6
700.4
2147
2048
0.33
0.36
0.33
0.34
737.2
648.9
717.6
701.2
1879
2009
1971
0.36
0.40
0.37
0.38
730.8
746.1
750.6
742.5
2000
1842
2125
0.36
0.39
0.32
703.7
712.5
682.0
SEm+
SEm+
SEm+
0.01
CD @
5%
NS
29.2
CD @
5%
83.7
Treatments
59
C.D
@t 5%
170
Genotypes
39
111
0.01
0.02
19.1
NS
Interaction
102
294
0.02
0.06
50.5
NS
C.V (5%)
8.9
Factors
8.8
1538
12.5
613.9
Int.J.Curr.Microbiol.App.Sci (2020) 9(5): 1535-1547
Table.2 Correlation between grain yield and yield attributing traits across the plant densities and genotypes of finger millet
(1) LAI
(1) LAI
(2) LI
(3)
Chlo.
(4)
Photosy.
(5) PT
(6)
MEW
(7) TW
(8)
Spike
(9) HI
(10)
Biomass
1.000
-0.637
1.000
0.556
-0.507
1.000
-0.317
0.381
-0.337
1.000
(5) Prod. Tillers m-2
0.687
-0.677
0.875
-0.505
1.000
(6) Mean ear weight
-0.642
0.668
-0.836
0.439
-0.967
1.000
(7) Test weight
-0.188
-0.349
-0.315
-0.195
-0.210
0.180
1.000
(8) Spikelet fertility
-0.539
0.439
-0.459
0.441
-0.492
0.478
-0.311
1.000
(9) HI
-0.461
0.561
-0.043
0.242
-0.188
0.242
-0.570
0.521
1.000
(10) Total biomass
0.803
-0.809
0.239
-0.347
0.505
-0.470
0.317
-0.484
-0.720
1.000
(11) Grain yield
0.528
-0.457
0.356
-0.217
0.536
-0.424
-0.269
-0.034
0.277
0.457
(2) Light penetration
(3) Chlorosis
(4) Photosynthetic rate
(11)
GY
Note: r – value more than 0.433 and 0.549 are significant at 5 and 1 % respectively
1539
1.000
Int.J.Curr.Microbiol.App.Sci (2020) 9(5): 1535-1547
Table.3 Effect of plant densities on leaf area index (LAI), light penetration and leaf chlorosis in finger millet genotypes
Spacing
(cm x cm) /
Varieties
Plant
density
Light penetration (µ molm-2s-1) at
flowering
LAI at flowering
(No.
m-2)
GE292
GE199
GPU28
Mean
GE292
GE199
GPU28
Mean
T1 (30 x 15)
22.2
4.61
4.17
5.18
4.65
146.5
163.9
44.3
T2 (30 x 10)
33.3
5.65
4.25
5.80
5.23
115.6
175.4
T3 (22.5 x 10)
44.4
5.76
6.04
7.96
6.58
60.9
T4 (15 x 10)
66.7
9.27
6.88
6.34
7.50
T5 (10 x 10)
100.0
8.64
7.25
5.67
T6 (10 x 7.5)
133.3
8.82
5.85
T7 (10x 5)
200.0
8.81
Leaf chlorosis at 20 DAF
(No. of chlorotic leaves per main
tiller)
GE199
0.11
GPU28
0.00
Mean
118.2
GE292
0.11
53.4
114.8
0.00
0.00
0.00
0.00
69.6
18.1
49.5
0.33
0.11
0.00
0.15
42.3
62.4
31.8
45.5
0.56
0.44
0.22
0.41
7.19
35.2
48.4
19.0
34.2
1.33
1.22
0.89
1.15
6.18
6.95
34.7
42.0
22.4
33.0
1.89
1.33
1.22
1.48
6.37
6.41
7.20
33.7
39.6
15.1
29.5
2.56
1.89
1.56
2.00
7.37
5.83
6.22
67.0
85.9
29.2
0.97
0.73
0.56
SEm+
C.D
@t 5%
SEm+
CD @
5%
SEm+
CD @
5%
Treatments
0.20
0.58
3.1
9.0
0.09
0.26
Genotypes
0.13
0.38
2.0
5.8
0.06
0.16
Interaction
0.35
1.01
5.4
15.5
0.15
NS
C.V. (5%)
9.4
Mean
Factors
15.5
1540
35.8
0.07
Int.J.Curr.Microbiol.App.Sci (2020) 9(5): 1535-1547
Table.4 Effect of plant densities on photosynthetic rate and productive tillers in finger millet genotypes
Spacing
Productive tillers (No. m-2)
(cm x cm) /
Varieties
Plant
density
(No.
Photosynthetic rate
m-2)
GE-292
GE199
GPU28
Mean
GE292
GE199
GPU28
Mean
GE292
GE199
GPU28
Mean
T1 (30 x 15)
22.2
19.67
17.63
19.33
18.88
100. 7
88.3
100.0
96.3
4.53
3.98
4.50
4.34
T2 (30 x 10)
33.3
18.73
20.27
18.53
19.18
111. 7
105.0
102.7
106.4
335
3.15
3.08
3.20
T3 (22.5 x 10)
44.4
16.47
20.30
18.73
18.50
127. 0
137.7
119.7
128.1
2.86
3.10
2.70
2.89
T4 (15 x 10)
66.7
15.93
18.37
18.73
17.68
213.4
183.7
175.6
190.9
3.20
2.76
2.63
2.86
T5 (10 x 10)
100.0
16.53
20.67
17.57
18.26
229.0
190.0
199.0
206.0
2.29
1.90
2.00
2.06
T6 (10 x 7.5)
133.3
13.30
19.10
13.63
15.34
233.7
196.9
219.8
216.8
1.76
1.48
1.65
1.62
T7 (10x 5)
200.0
19.40
19.67
12.50
244.3
216.2
248.5
236.3
1.22
1.08
1.24
1.18
Mean
17.15
19.43
17.01
180.0
159.7
166.5
2.75
2.49
2.54
Factors
SEm+
SEm+
SEm+
4.9
CD @
5%
14.1
0.066
CD @
5%
0.19
(u Mol
Productive tillers
m-2s-1)
(No. hill-1)
17.19
Treatments
1.43
CD @
5%
NS
Genotypes
0.94
NS
3.2
9.2
0.043
0.12
Interaction
2.48
NS
8.5
24.4
0.115
0.33
C.V (5%)
24.2
8.7
1541
7.72
Int.J.Curr.Microbiol.App.Sci (2020) 9(5): 1535-1547
Table.5 Effect of plant densities on mean ear weight, test weight and spikelet fertility in finger millet genotypes
Spacing
Plants
(cm x cm) /
Varieties
(No.
T1 (30 x 15)
Mean ear weight (g)
Test weight (g/ 1000 seeds)
GE199
8.89
GPU28
8.30
Mean
22.2
GE292
6.95
GE199
3.10
GPU28
4.05
Mean
8.05
GE292
3.29
T2 (30 x 10)
33.3
6.92
7.61
7.10
7.21
3.25
3.12
4.11
3.49
T3 (22.5 x 10)
44.4
6.83
7.21
7.20
7.08
3.27
2.99
3.86
3.37
T4 (15 x 10)
66.7
4.56
5.28
5.07
4.97
3.10
3.20
3.71
3.34
T5 (10 x 10)
100.0
3.62
4.80
4.20
4.21
3.08
3.28
3.68
3.35
T6 (10 x 7.5)
133.3
3.94
4.27
4.10
4.11
3.05
2.97
3.84
3.29
T7 (10x 5)
200.0
3.74
4.17
3.75
3.89
3.07
2.99
3.82
3.29
5.23
6.04
5.67
3.16
3.09
3.87
SEm+
SEm+
Mean
m-2)
Spikelet fertility (%)
GE292
80.8
GE199
86.8
GPU28
75.7
Mean
82.1
76.6
74.9
77.8
77.0
93.0
73.6
81.2
74.4
80.6
78.4
77.8
64.4
76.8
75.9
72. 4
74.5
87.0
75.5
79.0
64.3
81.5
65.1
70.3
73.9
83.2
74.1
SEm+
0.054
CD @
5%
0.155
1.77
CD @
5%
5.1
3.48
Treatments
0.22
C.D
@t 5%
0.63
Genotypes
0.14
0.41
0.035
0.101
1.16
3.31
Interaction
0.38
NS
0.094
NS
3.07
8.8
C.V (5%)
11.6
Factors
4.8
1542
6.89
81.1
Int.J.Curr.Microbiol.App.Sci (2020) 9(5): 1535-1547
Fig.1 Relationship between source size, yield parameters and grain yield in finger millet genotypes
(* = GE-199, ∆ = GE-292, ●=GPU-28)
1543
Int.J.Curr.Microbiol.App.Sci (2020) 9(5): 1535-1547
The wider spacing also reduce the productive
tiller number per unit land area significantly
and thus decreased grain yield (Table 4 and
Anitha, 2015; Nigus and Melese, 2018). The
results reiterate that the source is not a major
limitation under optimal irrigation conditions
in finger millet.
Another important trait that determines the
biomass production and grain yield is the
source activity (photosynthetic rate). The
photosynthetic rate did not differ significantly
between the planting densities or varieties
(Table 4). Photosynthetic rate was not related
significantly to biomass and grain yield
(Table 2 and Fig. 1b). The finger millet being
C4 (NAD-ME) species (Ueno et al., 2006) has
higher photosynthetic rate and thus the
photosynthetic rate is not a limitation, rather
light interception by the lower leaves at
narrow spacing is a major constraint.
Therefore, possible suggestions for yield
improvement under optimal irrigation
conditions could be through selection and
breeding for leaf acute angle to result in
higher light use efficiency as source is not a
limitation.
The study show that, the source size (LAI)
and source activity (photosynthetic rate) in
finger millet (GPU-28) is not a limitation
under optimal input conditions, but the sink
parameters such as productive tillers or ear
size could be the limitations for higher
productivity (Bezaweletaw et al., 2006;
Assefa et al., 2013; Dineshkumar et al., 2014;
Maobe et al., 2014; Jadhav et al., 2015;
Madhavilatha and Subbarao, 2015; Simbagije,
2016). The productive tillers m-2 (sink
number) was significantly increased with
increased plant density from 44.4 m-2 and
above (Table 4) but the grain yield was not
increased
significantly
although
the
relationship between productive tillers and
grain yield was significantly positive (Table
2; Fig. 1c). In contrast, a negative correlation
between the tiller number and grain yield has
been reported due to significant decrease in
ear size (Jyothsna et al., 2016). The mean ear
weight (sink size) was related to grain yield
positively and significantly (Fig. 1d) but
beyond 5 g ear-1, the yield was in declining
trend, this clearly suggests the compensation
mechanism between tiller number and ear size
(r = 0.998**, Table 2 and 5). In addition,
increased plant density above 33.3 m-2
decreased the test weight (Table 5). With
respect to spikelet fertility, although particular
trend is not observed, at closer spacing (high
plant density), the spikelet fertility was
markedly low (Table 5).
Increase in tiller number per unit land area
(above 44.4 hills m-2) by reduced spacing,
will lead to management problems like weed
management and disease management (Bitew
and Asargew, 2014) with no significant
increase in grain yield. Therefore spacing of
22.5 cm x 10 cm could be optimum. Other
research reports also show that 25 cm x 25 cm
over the 10 cm x 10 cm (Bhatta et al., 2017)
and 20 cm between the rows as over the 10
cm gave better grain yields (Shinggu and
Gani, 2012).
At the spacing of 22.5 cm x 10 cm, increase
in productive tiller number or ear size can
increase the grain yield as source is not a
constraint in finger millet. In this direction,
Kalpana et al., (2016) reported that at a given
spacing, increase in tiller number per hill up
to 4.9 increased the grain yield of finger
millet. Therefore, further improvement in
grain yield of finger millet could be possible
by (i) increased productive tillers per hill to
five at the spacing of 22.5 cm x 10 cm or 30
cm x 7.5 cm by management practices
(Damar et al., 2016), (ii) identifying
genotypes with erect leaves to intercept more
sunlight, (iii) removal of old leaves which
acts as sink during reproductive phase and
planting two seedlings per hill.
1544
Int.J.Curr.Microbiol.App.Sci (2020) 9(5): 1535-1547
Acknowledgments
Authors thank Dr. S. Ramesh, Professor,
Department of Plant Breeding & Genetics,
Dr. H.M. Jayadeva, Professor, Department of
Agronomy for their suggestions and support
to conduct the experiment.
References
Anitha, D., 2015. Finger millet (Eleusine
coracana (L.) Gaertn.) productivity as
influenced by planting geometry and age of
seedlings. M.Sc. (Agri.) Thesis, ANGRAU,
Hyderabad.
Anonymous, 2015. Annual Report 2014-15, All
India
Coordinated
Small
millets
Improvement Project, GKVK, Bengaluru.
Ag., Pp. 1.
Assefa, A., Fetene, M. and Tesfaye, K., 2013.
Agro-morphological, physiological and
yield related performances of finger millet
[Eleusine coracana (l.) Gaertn.] accessions
evaluated for drought resistance under field
condition. Asian Journal of Agriculture
and Rural Development. 3(10): 709-720.
Berdahl, J. D, Rasmusson, D. C. and Moss, D. N.,
1971. Effects of leaf area on photosynthetic
rate, light penetration and grain yield in
Barley. American Society of Agronomy. 12
(2): 177 - 180.
Bezaweletaw, K., Sripichitt, P., Wongyai, W. and
Hongtrakul, V., 2006. Genetic variation,
heritability and path analysis in Ethiopian
finger millet land races. Kasetsart Journal
of Natural Science. 40: 322-334.
Bhatta, L. R., Subedi, R., Joshi, P. and Gurung, S.
B., 2017. Effect of crop establishment
methods and varieties on tillering habit,
growth rate and yield of finger millet.
Agriculture Research and Technology.
11(5): 555826.
Bitew, Y. and Asargew, F., 2014. Determination
of seed rate and inter row spacing for finger
millet production (Eleusine coracana (L.)
Gaertn.)in North Western Ethiopia.
International Journal of Research and
Review. 1(4): 1-7
Chandra, D., Chandra, S., Pallavi, and Sharma, A.
K., 2016. Review of finger millet (Eleusine
coracana (L.) Gaertn): A power house of
health benefiting nutrients. Food Science
and Human Wellness. 5: 149 - 155.
Chavan, B.R., Jawale, L.N. and Shinde, A.V.,
2020. Correlation and path analysis studies
in finger millet for yield and yield
contributing traits (Eleusine coracana L.
Gaertn). International Journal of Chemical
Studies. 8(1): 2911-2914.
Damar, W.K., Garba, A., Russom, Z., Ibrahim, S.
A., Haggai, P.T. and Dikwahal, H.D., 2016.
Effect of poultry manure on growth and
yield of finger millet (Eleusine coracana L.
Gaertn) in the northern Guinea Savannah,
Nigeria, Production Agriculture and
Technology. 12 (1): 173-180.
Davis, K.F., Chhtre, A., Rao, N.D., Singh, D. and
DeFries, R., 2019. Sensitivity of grain
yields to historical climate variability in
India. Environmental Research Letters, 14:
064013,
/>Dereje, G., Adisu, T. and Anbessa, B., 2016.
Influence of row spacing and seed rate on
yield and yield components of finger millet
at Assosa zone in Benshagul Gumuze
region of Ethiopia. Journal of Biology,
Agriculture and Healthcare. 6(5): 42-45.
Devi, P.B., Vijayabharathi, R., Sathyabama, S.,
Malleshi, N.G. and Priyadarisini,V.B.,
2014. Health benefits of finger millet
(Eleusine coracana L.) polyphenols and
dietary fiber: A review. Journal of Food
Science and Technology. 51: 1021–1040.
Dida, M. M., Srinivasachary, Ramakrishnan, S.,
Bennetzen, J.L., Gale, M.D. and Devos,
K.M., 2007. The genetic map of finger
millet (Eleusine coracana L.). Theoretical
and Applied Genetics. 114: 321–332.
Dineshkumar, Tyagi, V. and Ramesh, B., 2014.
Path coefficient analysis for yield and its
contributing traits in finger millet.
International
Journal
of
Advanced
Research. 2 (8): 235-240.
Gull, A., Jan, R., Nayik, G.A., Prasad, K. and
Kumar, P., 2014. Significance of finger
millet in nutrition, health and value added
products:
A
review.
Journal
of
Environmental Science and Computer
Science, Engineering Technology. 3: 1601–
1608.
1545
Int.J.Curr.Microbiol.App.Sci (2020) 9(5): 1535-1547
Gupta, S.M., Arora, S., Mirza, N., Pande, A.,
Lata, C. and Puranik, S., 2017. Finger
millet: a “certain” crop for an “uncertain”
future and a solution to food insecurity and
hidden
hunger
under
stressful
environments. Frontiers in Plant Science.
8: 643, doi: 10.3389/fpls.2017.00643
Jadhav, R., Ratna Babu, D., Lal Ahamed, M. and
Srinivasa Rao, V., 2015. Character
association and path coefficient analysis for
grain yield and yield components in finger
millet (Eleusine coracana (L.) Gaertn.).
Electronic Journal of Plant Breeding. 6(2):
535-539.
Jyothsna, S., Patro, T.S.S.K., Ashok, S., Sandhya
Rani, Y. and Neeraja,B., 2016. Studies on
genetic parameters, character association
and path analysis of yield and its
components in finger millet (Eluesine
Coracana L. Gaertn), International Journal
of Theoretical and Applied Sciences. 8(1):
25-30.
Kalpana, K., Vadivel1, N., Bharathikumar, K and
Kavimani, R., 2016. Seasonal influence on
the occurrence and management of blast of
finger millet (Eleusine coracana (l.)
Gaertn.)
under
field
condition.
International Journal of Advances in
Agricultural Science and Technology. 3(1):
43-51.
Krishnamurthy, K., 1971. Response of finger
millet varieties under various levelsof
nitrogen. Annuals of Arid Zone. 10: 261265.
Kumari, P.L. and Sumathi, S., 2002. Effect of
consumption of finger millet on
hyperglycemia in non-insulin dependent
diabetes mellitus (NIDDM) subjects. Plant
Foods for Human Nutrition. 57(3-4): 205213.
Madhavilatha, L. and SubbaRao, M., 2015.
Performance of elite finger millet cultures
for grain yield, yield influencing traits and
blast tolerance, International Journal of
Agricultural Science and Research. 5 (1):
111-114.
Maobe, S.N., Nyang’au, M.K., Basweti, E.A.,
Getabu, A., Mwangi, T.J. and Ondicho,
A.R., 2014. Effect of plant density on
growth and grain yield of finger millet
(Eleusine coracana) under high potential
conditions of Southwest Kenya. World
Journal of Agricultural Sciences. 10(6):
261-268.
Nanja Reddy, Y.A., Jayarame Gowda, Ashok,
E.G., Krishne Gowda, K.T. and Gowda,
M.V.C., 2019. Higher leaf area improves
the productivity of finger millet (Eleusine
coracana (L.) Gaertn.) under rainfed
conditions. Intentional Journal of Current
Microbiology and Applied Sciences. 8(5):
1369-1377.
Negi, S., Bhatt, A. and Kumar, V., 2017.
Character association and path analysis for
yield and its related traits in finger millet
(Eleusine coracana (L.) Gaertn) genotypes.
Journal of Applied and Natural Science.
9(3): 1624-1629.
Nigus, C. and Melese, B., 2018. Inter row spacing
and seed rate effect on finger millet
(Eleusine coracana (L.) production at
MerbLekhe District, Ethiopia. Journal of
Agricultural Research. 3(4): 000169.
Patrick, J.W., 1988. Assimilate partitioning in
relation to crop productivity. Hort Science.
23: 33–40.
Prakasha, G., Kalyana Murthy, K.N., Prathima,
A.S. and Meti, R.N., 2018. Effect of
spacing and nutrient levels on growth
attributes and yield of finger millet
(Eleusine coracana L. Gaertn.) cultivated
under Guni planting method in red sandy
loamy
soil
of
Karnataka,
India.
International
Journal
of
Current
Microbiology and Applied Sciences. 7(05):
1337-1343.
Ramakrishnan, M., Ceasar, S.A., Vinod, K.,
Duraipandiyan, V., Krishna, T. A. and
Upadhyaya, H.D., 2017. Identification of
putative QTLs for seedling stage
phosphorus starvation response in finger
millet (Eleusine coracana L. Gaertn.) by
association mapping and cross species
synteny analysis. PLoS One.12:e0183261.
Richards. R. A., 2000. Selectable traits to increase
crop photosynthesis and yield of grain
crops. Journal of Experimental Botany. 51:
447 - 458.
Sakamma, S., Umesh, K.B., Girish, M.R., Ravi,
S.C., Satishkumar, M. and Bellundagi, V.,
2018. Finger millet (Eleusine coracana L.
Gaertn.) production system: status,
1546
Int.J.Curr.Microbiol.App.Sci (2020) 9(5): 1535-1547
potential, constraints and implications for
improving small farmer’s welfare. Journal
of Agricultural Sciences. 10: 162–179.
Sharma, D., Jamra, G., Singh, U.M., Sood, S. and
Kumar, A., 2017. Calcium bio-fortification:
three pronged molecular approaches for
dissecting complex trait of calcium
nutrition in finger millet (Eleusine
coracana) for devising strategies of
enrichment of food crops. Frontiers in
Plant
Science.
7:
2028.doi:
10.3389/fpls.2016.02028
Sheoran, O. P., Tonk, D. S., Kaushik, L. S.,
Hasija, R. C. and Pannu, R. S., 1998.
Statistical software package for agricultural
research workers. Recent advances in
information theory, statistics & computer
applications, Department of Mathematics
Statistics, CCS HAU, Hisar, 139-143
Shinggu, C.P. and Gani, M, 2012. Effects of
planting methods, sowing dates and spacing
on weed and the productivity of finger
millet (Eleusine corocana L. Gaertn.) in the
northern guinea Savanna of Nigeria. Global
Journal of Bioscience and Biotechnology.
1(2): 160-162.
Shobana, S., Krishnaswamy, K., Sudha, V.,
Malleshi, N.G., Anjana, R.M., Palaniappan,
L. and Mohan, V., 2013. Finger millet
(Ragi, Eleusine coracana L.): A review of
its nutritional properties, processing, and
plausible health benefits. Advances in Food
Nutrition Research. 69: 1–39.
Simbagije, R.M., 2016. Diversity of finger millet
(Eleusine coracana (L.) Gaertn.) genotypes
on drought tolerance and yield in Tanzania,
Ph.D. Thesis submitted to Sokoine
University of Agriculture. Morogoro,
Tanzania.
Somashekhar and Loganandhan, N., 2020. SRIfinger millet cultivation: A case Study in
Tumakuru District, India. International
Journal of Current Microbiology and
Applied Sciences, 9(01): 2089-2094.
Swetha, T. N., 2011. Assessment of the
contribution of physiological traits to grain
yield during crop improvement of finger
millet (Eleusine coracana L. Gaertn.).
M.Sc. (Agri.) Thesis, Univ. Agric. Sci.,
Bangalore.
Thilakarathna, M.S. and Raizada, M.N., 2015. A
review of nutrient management studies
involving finger millet in the semi-arid
tropics of Asia and Africa. Agronomy. 5:
262–290.
Ueno, O., Kawano, Y., Wakayama, M. and
Takeda, T., 2006. Leaf vascular systems in
C3 and C4 Grasses: A two-dimensional
analysis. Annals of Botany. 97(4): 611 621.
Wafula, W.N., Korir, N.K., Ojulong, H.F.,
Siambi, M. and Gweyi-Onyango, J.P.,
2018. Protein, calcium, zinc, and iron
contents of finger millet grain response to
varietal differences and phosphorus
application in Kenya. Agronomy. 8: 24;
doi:10.3390.
Yoseph, T., 2014. Determination of Inter Row
Spacing and Seed Rate on Productivity of
Finger Millet [Eleusine Coracana (L.)
Gaertn.], At Jinka, Southern Ethiopia.
International Journal of Research in
Agricultural Sciences, 1(3): 172-176.
How to cite this article:
Mujahid Anjum, Y. A. Nanja Reddy and Sheshshayee. M. S. 2020. Optimum LAI for Yield
Maximisation of Finger Millet under Irrigated Conditions. Int.J.Curr.Microbiol.App.Sci. 9(05):
1535-1547. doi: />
1547