Mean performance of nitrogen use efficiency and grain yield in rice genotypes
Bạn đang xem bản rút gọn của tài liệu. Xem và tải ngay bản đầy đủ của tài liệu tại đây (286.15 KB, 10 trang )
Int.J.Curr.Microbiol.App.Sci (2020) 9(5): 2205-2214
International Journal of Current Microbiology and Applied Sciences
ISSN: 2319-7706 Volume 9 Number 5 (2020)
Journal homepage:
Original Research Article
/>
Mean Performance of Nitrogen Use Efficiency and Grain
Yield in Rice Genotypes
Rajesh Kunta*, Ramesh Thatikunta1 and D. Saida Naik2
Department of Crop Physiology, Professor Jayashankar Telangana State Agricultural
University, Hyderabad- 500 030, Telangana, India
*Corresponding author
ABSTRACT
Keywords
Nitrogen use
efficiency, Rice
genotypes, Grain
yield and mean
performance
Article Info
Accepted:
18 April 2020
Available Online:
10 May 2020
A field experiment was conducted to study the mean performance
variations for nitrogen use efficiency and yield related traits in nine crosses
of rice genotypes. From each cross six generations i.e., P1, P2, F1, F2, B1
and B2 were generated and were analyzed in an experimental trial
conducted in rabi, 2012-13. Among the crosses, MTU-1001 X JGL-1798
and (MTU-1001 X JGL-1798) X MTU-1001 followed by MTU-1010 X
JGL-1798 and (MTU-1010 X JGL-1798) X MTU-1010 recorded maximum
nitrogen use efficiency and grain yield. The cultivars with high uptake
efficiency had higher nitrogen contents than cultivars with low uptake
efficiency from nitrogen application. Therefore, the cultivars with high
uptake efficiency could reduce the losses of nitrogen and facilitates
increased nitrogen uptake.
Introduction
Rice (Oryza sativa L.) is one of the major
food crops of the world. It is staple food for
more than 60% of the global population and
forms the cheapest source of food and energy
(Zhao et al., 2011). Besides being the chief
source of carbohydrate and protein in Asia, it
also provides minerals and fibre. The present
world population of 6.3 billion which may
reach 8.5 billion by 2030 with an approximate
rice consumers of five billion people thereby,
increasing the demand of rice up to 38% by
2030. To meet this challenge there is a need
to develop rice varieties with higher yield
potential and greater yield stability (Lea and
Miflin, 2003).
Nitrogen plays an important role in rice
production, increased nitrogen application
increases rice yield per unit area and nitrogen
fertilizer has a key role in rice life cycle.
Continuous increase in rice production has to
be achieved with less nitrogen fertilizer by
2205
Int.J.Curr.Microbiol.App.Sci (2020) 9(5): 2205-2214
improving nitrogen use efficiency (NUE)
through better nitrogen fertilizer management
and development of new nitrogen use
efficient rice varieties (Ahrens et al., 2010
and Kang et al., 2013).
The genotypic variation in NUE has been
realized and however, plant traits that are
associated with high grain yield and high
NUE should be identified so that breeders are
able to use these traits easily as selection
criteria in the breeding programme to develop
nitrogen use efficient varieties without the
scare of playing with rice yield potential.
Fundamental approach to develop cultivars
with enhanced nitrogen use efficiency, in
contrast to just improved yield requires
evaluating the segregating population
obtained by crossing low nitrogen efficient
genotype to high nitrogen use efficient
genotype and vice versa under native soil
nitrogen condition so as to identify a nitrogen
use efficient plants and compare its
performance with that of other genotypes. In
view of above facts an attempt was made to
study genetic response for nitrogen use
efficient and grain yield in rice genotypes.
Materials and Methods
Based on the yield performance and nitrogen
use efficiency, six rice genotypes viz., MTU1001,WGL-2395,
MTU-1010,
Pothana,
Bhadrakali and JGL-1798 were selected from
Kharif-2011 and nine crosses viz., MTU1001 X Pothana, MTU- 1001 X Bhadrakali,
MTU- 1001 X JGL-1798, WGL-2395 X
Pothana, WGL-2395 X Bhdrakali, WGL2395 X JGL-1798, MTU-1010 X Pothana,
MTU-1010 X Bhadrakali and MTU-1010 X
JGL-1798 were made to produce F1
generation in Rabi 2011-12. The F1 were
selfed to produce F2 generations in Kharif
2012 and backcrossed with parents to produce
18 backcross generations. The experiment
was carried out by six generations viz., P1, P2,
F1, F2, B1 and B2 were raised during Rabi2012-13 at college farm, College of
Agriculture, Professor Jayashankar Telangana
State Agricultural University, Rajendranagar,
Hyderabad. Thirty day old seedlings were
transplanted into 6 m2 (2m X 3m) plots by
adopting a spacing of 20 cm between rows
and 15 cm between plants with in a row.. The
recommended agronomic practices were
followed to raise the crop. Observations were
recorded for the following traits nitrogen use
efficiency, No. of filled grains hill-1, 1000
seed weight and Grain yield (kg ha-1).
Nitrogen use efficiency defined as the ratio of
grain yield to applied fertilizer nitrogen is a
key parameter for evaluating a crop cultivar.
Grain from net plot area was thoroughly sun
dried, threshed, cleaned and weight of grains
was recorded and expressed in yield per
hectare. The data were analyzed statistically
following the method given by Singh and
Chaudhary (2001).
Results and Discussion
The mean performances of six generations
(P1, P2, F1, F2, B1 and B2) of nine crosses i.e.,
MTU- 1001 X Pothana, MTU- 1001 X
Bhadrakali, MTU- 1001 X JGL-1798, WGL2395 X Pothana, WGL-2395 X Bhdrakali,
WGL-2395 X JGL-1798, MTU-1010 X
Pothana, MTU-1010 X Bhadrakali and MTU1010 X JGL-1798 generated and nitrogen use
efficiency, grain yield and yield traits were
analyzed and furnished below.
Mean performance of generations for NUE
and yield related traits in crosses of rice
In the cross MTU-1001 X Pothana, significant
difference was observed between generations
(Table 1). Parent P1 (1458.67) significantly
recorded higher number of filled grains hill-1
than the parent P2 (1315.67). F1 (1548.67)
mean was higher than the both parents. F2
(1467.85) generation also recorded higher
2206
Int.J.Curr.Microbiol.App.Sci (2020) 9(5): 2205-2214
than both the parents. Among the back
crosses, B1 (1532.07) was higher than to B2
(1419.30) for number of filled grains hill-1.
1000 grain weight was significantly different
in both the parents and parent P1 (16.58)
recorded higher 1000 grain weight than P2
(15.39). The hybrid F1 (15.72) recorded
maximum 1000 grain weight than the F2
(14.91). Among the back crosses, significant
differences were observed between B1 (16.94)
and B2 (15.71) and B1 was higher in 1000
grain weight than B2 which recorded
maximum 1000 grain weight compared to all
generations. Nitrogen use efficiency (NUE) of
parent P1 (42.96) recorded higher value than
parent P2 (41.94). The hybrid F1 (45.73)
recorded higher NUE compared to all
generations. F2 (42.54) recorded NUE similar
to better parent. Among the back crosses,
significant differences were observed between
B1 (45.17) and B2 (43.60) and B1 was higher
in NUE than B2 and parents. The parents
deviated significantly for grain yield and
parent P1 (5155.27) recorded higher yield than
parent P2 (5033.30). Among the entire
generations, the hybrid F1 (5487.67) recorded
maximum grain yield, while F2 (5104.50)
yielded higher grain yield than the parent P2.
Among the back crosses, B1 (5420.79)
recorded more yield than B2 (5231.81), which
in turn yielded more than both parents. In
cross MTU-1001 X Pothana the characters
that could be improved by crossing included
NUE and grain yield. The superiority of these
characters was shown in F1 or subsequent
populations over parents.
In the cross MTU-1001 X Bhadrakali, parent
P1 (1458.67) significantly recorded higher
number of filled grains hill-1 than the parent P2
(1296.67). F1 (1520.00) mean was higher than
the both parents. F2 (1451.85) was on par with
better parent. Among the back crosses, B2
(1527.51) was higher than to B1 (1419.30)
and superior among all generations. 1000
grain weight showed significant difference in
both the parents and parent P1 (16.58)
recorded higher value than P2 (15.05). The
hybrid F1 (15.50) recorded higher value than
the F2 (14.97). Among the back crosses,
significant differences were observed between
B1 (15.71) and B2 (17.25) and B2 was higher
in 1000 grain weight than B1 which recorded
maximum 1000 grain weight compared to all
generations. Nitrogen use efficiency of parent
P1 (42.96) recorded higher NUE than parent
P2 (41.63). The hybrid F1 (45.17) recorded
higher NUE compared to all generations. The
F2 (42.22) recorded lower NUE then better
parent. Among the back crosses, significant
differences were observed between B1 (43.60)
and B2 (44.79) and B2 was higher in NUE
than parents. The parents deviated
significantly for grain yield and parent P1
(5155.27) recorded higher yield than parent P2
(4996.17). Among the entire generations, the
hybrid F1 (5420.35) recorded maximum grain
yield, while F2 (5066.80) yielded higher grain
yield than the P2. Among the back crosses, B2
(5374.48) recorded more yield than B1
(5231.81), which in turn yielded more than
both parents. MTU-1001 X Bhadrakali in F1
generation showed significant improvement
for all characters except 1000 grain weight.
The seed at F1 stage as such can be used as
hybrid.
In the cross MTU-1001 X JGL-1798, parent
P1 (1458.67) significantly recorded higher
number of filled grains hill-1 than the parent P2
(1352.67). F1 (1603.33) recorded higher value
than all generations. F2 (1525.60) generation
values were also higher than both the parents.
Among the back crosses, B1 (1527.51)
showed higher value than to B2 (1386.17) for
number of filled grains hill-1. 1000 grain
weight was significantly different in both the
parents and parent P1 (16.58) recorded values
on par with 1000 grain weight than P2
(16.46). The hybrid F1 (18.56) recorded
maximum 1000 grain weight than the F2
(17.51). Among the back crosses, significant
2207
Int.J.Curr.Microbiol.App.Sci (2020) 9(5): 2205-2214
differences were observed between B1 (17.25)
and B2 (15.70) and B1 was higher in 1000
grain weight than parents. Nitrogen use
efficiency of parent P1 (42.96) recorded was
higher than parent P2 (42.67). The hybrid F1
(46.51) recorded higher NUE compared to all
generations. F2 (43.02) recorded higher NUE
than parent. Among the back crosses,
significant differences were observed between
B1 (44.79) and B2 (43.19) and B1 was higher
in NUE than and parents. The parents slightly
significantly for grain yield and parent P1
(5155.27) recorded higher yield than parent P2
(5120.63). Among the entire generations, the
hybrid F1 (5581.30) recorded maximum grain
yield, while F2 (5162.52) yielded higher grain
yield than the parents. Among the back
crosses, B1 (5374.48) recorded more yield
than B2 (5182.30), which in turn yielded more
than both parents.
MTU-1001X JGL-1798 shows superiority in
all characters and was on par with parents. F1
better performance observed in yield was also
reflected in 1000 grain weight and has a basis
in NUE.
In the cross WGL-2395 X Pothana,
significant difference was observed between
generations (Table 2). Number of filled grains
hill-1 for parent P1 (1565.33) was significantly
higher than the parent P2 (1315.67). The
hybrid F1 (1451.00) mean was lower than
better parent. F2 (1379.60) recorded lower
number of filled grains hill-1 compared to
parent P1. Among the back crosses, B2
(1534.43) was higher than B1 (1386.17). 1000
grain weight was significantly different in
both the parents and parent P1 (20.09)
recorded higher value than P2 (15.39). The
hybrid F1 (15.32) recorded lower value than
the parents. F2 (14.56) recorded lower 1000
grain weight among all generations. Among
the back crosses, significant differences were
observed between B1 (15.70) and B2 (19.29)
and B2 was higher in 1000 grain weight than
B1. Nitrogen use efficiency of parent P1
(44.82) recorded was higher than parent P2
(41.94). The hybrid F1 (44.49) recorded lower
and slightly on par value with better parent. F2
(41.79) recorded lower NUE among all
generations. Among the back crosses,
significant differences were observed between
B1 (43.19) and B2 (45.35) and B2 which was
higher in NUE than all generations. The
parent P1 (5377.93) recorded higher yield than
parent P2 (5033.30). The hybrid F1
(5338.83.35) recorded lower value than the
better parent, while F2 (5015.06) yielded
lower grain yield than the parents. Among the
back crosses, B2 (5442.10) recorded more
yield than B1 (5182.30), which in turn yielded
more than both parents.
Performance of WGL-2395 X Pothana cannot
be rated for superior performance in early
generations (F1) for crop improvement
through characters like 1000 grain weight,
NUE and grain yield populations have to be
carried upto B2.
In the cross WGL-2395 X Bhadrakali, (Table
2) number of filled grains hill-1 for parent P1
(1565.33) was significantly higher than parent
P2 (1296.67). The F1 (1444.33) mean was
lower than better parent. F2 (1389.93)
recorded lower number of filled grains hill1
compared to parent P1. Among the back
crosses, B1 (1534.43) was higher than to B2
(1455.71).
1000
grain
weight
was
significantly different between parents and
parent P1 (20.09) recorded higher value than
P2 (15.05). The hybrid F1 (14.95) recorded
lower value than the parents. F2 (14.35)
recorded lower 1000 grain weight among all
generations.
Among the backcrosses,
significant differences were observed between
B1 (19.29) and B2 (18.04) and B1 was higher
in 1000 grain weight than B2. Nitrogen use
efficiency of parent P1 (44.82) recorded was
higher than parent P2 (41.63). The hybrid F1
(44.28) recorded lower and slightly on par
2208
Int.J.Curr.Microbiol.App.Sci (2020) 9(5): 2205-2214
value with better parent. F2 (41.61) recorded
lower NUE among all generations and was on
par with parent P2. Among the back crosses,
B1 (45.35) recorded higher NUE than all
generations. Parent P1 (5377.93) recorded
higher yield than parent P2 (4996.17). The
hybrid F1 (5313.77) recorded lower value than
the better parent, while F2 (4993.16) yielded
lower grain yield than the parents. Among the
back crosses, B2 (5442.10) recorded more
yield than B1 (5309.18), which in turn yielded
more than both parents. Data revealed that
parent P1 (WGL-2395) was significantly
superior for NUE, yield and yield contributing
characters. Thus P1 can be used as for transfer
of characters in other crosses for bringing
about heterosis.
Table.1 Mean performance of generations for NUE, yield and yield related traits in crosses of
rice genotypes
Trait/cross
P1
No. of filled
grains hill-1
1000 grain wt
(g)
NUE
1458.67
Grain yield
(kg ha-1)
5155.27
1458.67
No. of filled
grains hill-1
1000 grain wt
(g)
NUE
Grain yield
(kg ha-1)
P2
F1
F2
B1
B2
S.Em± C.D (5%)
MTU-1001 X Pothana
1315.67 1548.67 1467.85 1532.07 1419.30 34.30
99.06
16.58
15.39
15.72
14.91
16.94
15.71
0.41
1.20
42.96
41.94
45.73
42.54
45.17
43.60
0.41
1.18
5033.30 5487.67 5104.50 5420.79 5231.81
40.29
116.36
MTU-1001 X Bhadrakali
1296.67 1520.00 1451.27 1419.30 1527.51
36.06
104.14
0.45
1.30
16.58
15.05
15.50
14.97
15.71
17.25
42.96
5155.27
41.63
45.17
42.22
43.60
44.79
4996.17 5420.35 5066.80 5231.81 5374.48
0.39
37.46
1.13
108.19
No. of filled
grains hill-1
1000 grain wt
(g)
NUE
1458.67
MTU-1001 X JGL-1798
1352.67 1603.33 1525.60 1527.51 1386.17
30.93
89.31
Grain yield
(kg ha-1)
5155.27
16.58
16.46
18.56
17.51
17.25
15.70
0.27
0.79
42.96
42.67
46.51
43.02
44.79
43.19
0.38
1.10
40.17
115.99
5120.63 5581.30 5162.52 5374.48 5182.30
2209
Int.J.Curr.Microbiol.App.Sci (2020) 9(5): 2205-2214
Table.2 Mean performance of generations for NUE, yield and yield related traits in crosses of
rice genotypes
Trait/cross
P1
No. of filled grains
hill-1
1000 grain wt (g)
NUE
Grain yield (kg ha-1)
1565.33
No. of filled grains
hill-1
1000 grain wt (g)
NUE
Grain yield (kg ha-1)
1565.33
No. of filled grains
hill-1
1000 grain wt (g)
NUE
Grain yield (kg ha-1)
20.09
44.82
5377.93
P2
F1
F2
B1
B2
S.Em±
WGL-2395 X Pothana
1315.67 1451.00 1379.60 1386.17 1534.43 26.28
C.D (5%)
75.90
15.39
15.32
14.56
15.70
19.29
41.94
44.49
41.79
43.19
45.35
5033.30 5338.83 5015.06 5182.30 5442.10
WGL-2395 X Bhadrakali
1296.67 1444.33 1389.93 1534.43 1455.71
0.11
0.30
30.12
0.31
0.86
86.97
29.31
84.64
0.15
0.30
29.79
0.44
0.87
86.04
1565.33
15.05
14.95
14.35
19.29
18.04
41.63
44.28
41.61
45.35
44.24
4996.17 5313.77 4993.16 5442.10 5309.18
WGL-2395 X JGL-1798
1352.67 1460.00 1400.60 1455.71 1454.12
24.34
70.29
20.09
44.82
5377.93
16.46
15.45
14.80
18.04
15.93
42.67
44.62
41.86
44.24
43.77
5120.63 5354.60 5023.64 5309.18 5252.79
0.12
0.26
27.26
0.36
0.77
78.72
20.09
44.82
5377.93
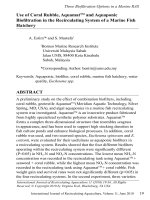
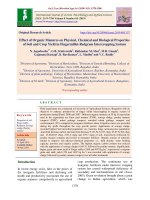
Figure.1 Mean performance of MTU-1010 X JGL-1798 with respect to nitrogen use efficiency
(NUE) of rice genotypes
2210
Int.J.Curr.Microbiol.App.Sci (2020) 9(5): 2205-2214
Table.3 Mean performance of generations for NUE, yield and yield related traits in crosses of
rice genotypes
Trait/cross
P1
No. of filled grains
hill-1
1000 grain wt (g)
NUE
1502.67
Grain yield (kg ha-1)
5311.50
No. of filled grains
hill-1
1000 grain wt (g)
NUE
Grain yield (kg ha-1)
1502.67
No. of filled grains
hill-1
1000 grain wt (g)
NUE
Grain yield (kg ha-1)
22.05
44.26
P2
F1
F2
B1
B2
S.Em±
MTU-1010 X Pothana
1315.67 1510.33 1425.93 1454.12 1378.75 28.38
16.65
45.56
14.94
42.64
15.93
43.77
15.86
43.35
81.96
0.54
0.40
1.56
1.14
5033.30 5467.40 5116.64 5252.79 5202.50
MTU-1010 X Bhadrakali
1296.67 1473.00 1410.93 1378.75 1454.07
38.73
111.83
32.74
94.55
0.56
0.39
36.19
1.63
1.13
104.51
1502.67
15.05
16.07
15.01
15.86
15.65
41.63
45.07
42.21
43.35
43.77
4996.17 5408.70 5065.20 5202.50 5252.39
MTU-1010 X JGL-1798
1352.67 1578.67 1487.85 1454.07 1368.53
27.08
78.21
22.05
44.26
5311.50
16.46
19.93
18.38
15.65
15.37
42.67
46.17
42.94
43.77
42.71
5120.63 5539.80 5153.04 5252.39 5125.73
0.43
0.37
38.83
1.25
1.08
112.14
22.05
44.26
5311.50
15.39
41.94
C.D (5%)
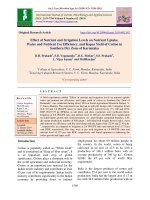
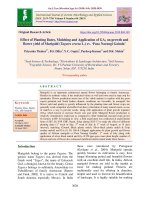
Figure.2 Mean performance of MTU-1010 X JGL-1798 with respect to grain yield of rice
genotypes
2211
Int.J.Curr.Microbiol.App.Sci (2020) 9(5): 2205-2214
In the cross WGL-2395 X JGL-1798, (Table
2) number of filled grains hill-1 for parent P1
(1565.33) significantly recorded higher value
than the parent P2 (1352.67). The F1
(1460.00) mean was lower than better parent.
F2 (1400.60) recorded lower number of filled
grains hill-1 compared to parent P1. Among
the back crosses, B1 (1455.71) was similar to
B2 (1454.12). 1000 grain weight was
significantly different in both the parents and
parent P1 (20.09) recorded higher value than
P2 (16.46). The hybrid F1 (15.45) recorded
lower than the parents. F2 (14.80) recorded
lower 1000 grain weight among all
generations. Among the back crosses,
significant differences were observed between
B1 (18.04) and B2 (15.93) and B1 was higher
in 1000 grain weight than B2. Nitrogen use
efficiency of parent P1 (44.82) recorded
higher value than parent P2 (42.67). The
hybrid F1 (44.62) recorded lower and slightly
on par value with better parent. F2 (41.86)
recorded lower NUE among all generations.
Among the back crosses, B1 (44.24) recorded
higher NUE than and B2 (43.77). The parent
P1 (5377.93) recorded higher yield than parent
P2 (5120.63). The hybrid F1 (5354.60)
recorded lower value than the better parent,
while F2 (5023.64) yielded lower grain yield
than the parents. Among the back crosses, B1
(5309.18) recorded more yield than B2
(5252.79). Variable performance was shown
by the cross WGL-2395 X JGL-1798. Parents
involved were on par with F1, B1 and B2.
In the cross MTU-1010 X Pothana, the data
(Table 3) revealed that parent P1 (1502.67)
significantly recorded higher number of filled
grains hill-1 than the parent P2 (1315.67). F1
(1510.33) mean was higher than the both
parents. F2 (1425.93) recorded higher value
than the P2. Among the back crosses, B1
(1454.12) was higher than to B2 (1378.75) for
number of filled grains hill-1. 1000 grain
weight was significantly different in both the
parents and parent P1 (22.05) recorded higher
1000 grain weight than P2 (15.39). The hybrid
F1 (16.65) recorded maximum 1000 grain
weight than F2 (14.94). Among the back
crosses, B2 (15.86) was almost similar to B1
(15.93). Nitrogen use efficiency of parent P1
(44.26) was higher than parent P2 (41.94).
The hybrid F1 (45.56) recorded higher NUE
compared to all generations. F2 (42.64)
recorded lower NUE than better parent.
Among the back crosses, B1 (43.77) and B2
(43.35) was almost similar in NUE. Parent P1
(5311.50) recorded higher grain yield than
parent P2 (5033.30). Among the entire
generations, hybrid F1 (5467.40) recorded
maximum grain yield, while F2 (5116.64)
yielded higher grain yield than the parent P2.
Among the back crosses, B1 (5252.79)
recorded more yield than B2 (5202.50).
In the cross MTU-1010 X Bhadrakali, (Table
3) parent P1 (1502.67) significantly recorded
higher number of filled grains hill-1 than the
parent P2 (1296.67). The F1 (1473.00) mean
was higher than P2. The F2 (1410.93) recorded
higher number of filled grains hill-1 than P2.
Among the back crosses, B2 (1454.07) was
higher than to B1 (1378.75) for number of
filled grains hill-1. 1000 grain weight was
significantly different in both the parents and
parent P1 (22.05) recorded higher 1000 grain
weight than P2 (15.05). The hybrid F1 (16.07)
recorded maximum 1000 grain weight than
the F2 (15.01). Among the back crosses, B1
(15.86) was almost similar in 1000 grain
weight to B2 (15.65). Nitrogen use efficiency
of parent P1 (44.26) recorded was higher than
parent P2 (41.63). The hybrid F1 (45.07)
recorded higher NUE compared to all
generations. F2 (42.21) recorded lower NUE
than better parent. Among the back crosses,
B2 (43.77) and B1 (43.35) were almost
similar. Grain yield, parent P1 (5311.50)
recorded higher yield than parent P2
(4996.17). Among the entire generations, the
hybrid F1 (5408.70) recorded maximum grain
yield, while F2 (5065.20) yielded higher grain
2212
Int.J.Curr.Microbiol.App.Sci (2020) 9(5): 2205-2214
yield than the parent P2. Among the back
crosses, B2 (5252.39) recorded more yield
than B1 (5202.50). Parental performance was
superior in the cross MTU-1010 X
Bhadrakali.
In the cross MTU-1010 X JGL-1798, parent
P1 (1502.67) significantly recorded higher
number of filled grains hill-1 than the parent P2
(1352.67). F1 (1578.67) value was higher
among all the generations. F2 (1487.85)
generation also recorded higher value than the
parent P2. Among the back crosses, B1
(1454.07) was higher than to B2 (1368.53) for
number of filled grains hill-1. 1000 grain
weight was significantly different in both the
parents and parent P1 (22.05) recorded higher
1000 grain weight than P2 (16.46). The hybrid
F1 (19.93) recorded maximum 1000 grain
weight than the F2 (18.38). Among the back
crosses, no significant differences were
observed between B1 (15.65) and B2 (15.37).
Nitrogen use efficiency of parent P1 (44.26)
was higher than parent P2 (42.67). The hybrid
F1 (46.17) recorded higher NUE compared to
all generations. F2 (42.94) recorded lower
NUE than better parent. Among the back
crosses, significant differences were observed
and B1 (43.77) recorded higher NUE than B2
(42.71) (Fig. 1). Parent P1 (5311.50) recorded
higher grain yield than parent P2 (5120.63).
Among the entire generations, the hybrid F1
(5539.80) recorded maximum grain yield,
while F2 (5153.04) yielded higher grain yield
than parent P2. Among the back crosses, B1
(5252.39) recorded more yield than B2
(5125.73) (Fig. 2). Superiority of the cross
MTU-1010 X JGL-1798 was expressed at by
grain yield and NUE.
The mean data obtained from six generations
of the nine cross combinations for NUE and
yield traits were subjected to generation mean
analysis using scaling testes to test the fitness
of additive-dominance model and Haymans
six parameter model to find the significant
inter-allelic interactions.
Predominance of dominance component over
additive component and the importance of
epistatic interactions, hybrid breeding can be
a better strategy for rice improvement
provided hybrid seed production is relatively
simple and economically viable. Recurrent
selection, biparental mating and diallel
selective mating system may also be
profitable to exploit both additive and nonadditive components for bringing about
improvement in grain yield and its attributes.
Such a strategy will help in increasing the
frequency of favorable alleles while
maintaining the genetic variation in breeding
population (Hallauer and Miranda, 1988 and
Doerksen et al., 2003).
To sum up, with regard to rice breeding to
earn high yield variety, it is very important to
know about genetic structure of each trait
including inheritability, gene mode of action
and number of controller genes. This
information makes breeders able to design
appropriate strategies. Generation mean
analysis can be commonly used for evaluating
of effect of those genes which are involved in
quantitative traits (Kearsy and Pooni, 1996).
Estimates of genetic effects using generation
mean analysis, genes of like effects must be
completely associated with the parents.
Therefore, selection of parents contrasting for
the trait being measured is crucial for this
type of investigation. Any dispersal of like
genes among the two parents may cause
cancelling of some effects, resulting in the
underestimation of additive (d), additive ×
additive (i) and additive × dominance (j)
effects (Wilson et al., 2000).
From the investigation it can be concluded
that the cultivars with high uptake efficiency
had higher nitrogen contents than cultivars
with low uptake efficiency from nitrogen
application. Therefore, the cultivars with high
uptake efficiency could reduce the losses of N
and facilitates increased N uptake and result
2213
Int.J.Curr.Microbiol.App.Sci (2020) 9(5): 2205-2214
in the development of superior nitrogen use
efficient rice cultivars. Improvement of traits
with simple selection techniques will not be
able to fix superior lines in the early
segregating generations. Knowledge about the
way genes act and interact will determine the
breeding system to optimize gene action more
efficiently to elucidate the role of breeding
systems in the evolution of crop plants.
References
Ahrens T D, Lobell D B, Ortiz-Monasterio J
I, Li Y, Matson P A. 2010. Narrowing
the agronomic yield gap with improved
nitrogen use efficiency: a modeling
approach. Ecological Applicants, 20:
91–100.
Doerksen, T.K., Kannenberg, L and Lee, E.
2003. Effects of recurrent selection on
combining ability in maize breeding
population. Crop science. 43: 16521668.
Hallauer, A.R and Miranda, J.B. 1988.
Quantitative
Genetics
in
Maize
Breeding. The Iowa State University
Press, Ames, USA.
Kang S G, Hassan M S, Sang W G, Min-Kyu
Choi, Young-Doo Kim, Hong-Kyu
Park, Chowdhury A and Jeom-Ho Lee.
2013. Nitrogen use efficiency of high
yielding japonica rice (Oryza sativa L.)
influenced by variable nitrogen
applications. Korean journal of Crop
Science 58(3): 213-219.
Keasrey, M.J. and Pooni, H.S. 1996. The
Genetical Analysis of Quantitative
Traits. Chapman and Hall. First Edition.
London.
Lea, P. J. and Miflin, B. J. Glutamate
synthase and the synthesis of glutamate
in plants. Plant Physiol. Biochem., 41:
555- 564 (2003).
Singh, R. K and Chaudhary, B. D. 2001.
Biometrical Methods in Quantitative
Genetic Analysis. Kalyani Publishers
New Delhi India. 79-101.
Wilson, J.A., Glover, D.V and Nyquist, W.E.
2000. Genetic effects of the soft starch
(h) and background loci on volume of
starch granules in five inbreds of maize.
Plant Breeding. 119: 173-176.
Zhao L, Wu L, Wu M and Li Y. 2011.
Nutrient uptake and water use
efficiency as affected by modified rice
cultivation methods with irrigation.
Paddy Water Environment, 9: 25-32.
How to cite this article:
Rajesh Kunta, Ramesh Thatikunta and Saida Naik, D. 2020. Mean Performance of Nitrogen
Use Efficiency and Grain Yield in Rice Genotypes. Int.J.Curr.Microbiol.App.Sci. 9(05): 22052214. doi: />
2214