Development and external validation of nomograms to predict the risk of skeletal metastasis at the time of diagnosis and skeletal metastasis-free survival in nasopharyngeal carcinoma
Bạn đang xem bản rút gọn của tài liệu. Xem và tải ngay bản đầy đủ của tài liệu tại đây (1.11 MB, 13 trang )
Yang et al. BMC Cancer (2017) 17:628
DOI 10.1186/s12885-017-3630-9
RESEARCH ARTICLE
Open Access
Development and external validation of
nomograms to predict the risk of skeletal
metastasis at the time of diagnosis and
skeletal metastasis-free survival in
nasopharyngeal carcinoma
Lin Yang1,2,3† , Liangping Xia1,2,3†, Yan Wang1,2,3†, Shasha He1,2,3, Haiyang Chen4, Shaobo Liang5, Peijian Peng6,
Shaodong Hong1,2,3* and Yong Chen1,2,3*
Abstract
Background: The skeletal system is the most common site of distant metastasis in nasopharyngeal carcinoma (NPC);
various prognostic factors have been reported for skeletal metastasis, though most studies have focused on a single
factor. We aimed to establish nomograms to effectively predict skeletal metastasis at initial diagnosis (SMAD) and skeletal
metastasis-free survival (SMFS) in NPC.
Methods: A total of 2685 patients with NPC who received bone scintigraphy (BS) and/or 18F–deoxyglucose
positron emission tomography/computed tomography (18F–FDG PET/CT) and 2496 patients without skeletal metastasis
were retrospectively assessed to develop individual nomograms for SMAD and SMFS. The models were validated externally
using separate cohorts of 1329 and 1231 patients treated at two other institutions.
Results: Five independent prognostic factors were included in each nomogram. The SMAD nomogram had a significantly
higher c-index than the TNM staging system (training cohort, P = 0.005; validation cohort, P < 0.001). The SMFS nomogram
had significantly higher c-index values in the training and validation sets than the TNM staging system (P < 0.001
and P = 0.005, respectively). Three proposed risk stratification groups were created using the nomograms, and
enabled significant discrimination of SMFS for each risk group.
Conclusion: The prognostic nomograms established in this study enable accurate stratification of distinct risk
groups for skeletal metastasis, which may improve counseling and facilitate individualized management of
patients with NPC.
Keywords: Nasopharyngeal carcinoma, Skeletal metastasis at the time of diagnosis (SMAD), Skeletal metastasis
free survival (SMFS), Prognosis, Nomograms
* Correspondence: ;
†
Equal contributors
1
Sun Yat-sen University Cancer Center, 651 East Dong Feng Road,
Guangzhou 510060, China
Full list of author information is available at the end of the article
© The Author(s). 2017 Open Access This article is distributed under the terms of the Creative Commons Attribution 4.0
International License ( which permits unrestricted use, distribution, and
reproduction in any medium, provided you give appropriate credit to the original author(s) and the source, provide a link to
the Creative Commons license, and indicate if changes were made. The Creative Commons Public Domain Dedication waiver
( applies to the data made available in this article, unless otherwise stated.
Yang et al. BMC Cancer (2017) 17:628
Background
Nasopharyngeal carcinoma (NPC) is a malignant head
and neck cancer with a distinct ethnic and geographic
pattern of distribution; the highest incidences of NPC
(30–80 cases per 10,000/year) are observed in southern
China and South East Asia [1]. Developments in advanced
imaging modalities and instrumentation have enabled more
precise tumor staging. Currently, approximately 5–8% of
cases of NPC have distant metastasis (M1) at first diagnosis;
the skeleton is the most common distant metastasis site,
representing 70% to 80% cases of M1 disease [2–4]. Distant
metastasis at diagnosis is associated with poorer survival
outcomes and reduced quality of life. Moreover, research
on M1 disease is sparse due to the poor survival outcomes
of patients with skeletal metastases. However, increasing
evidence indicates long-term survival and even a complete
response can be achieved among a small proportion of
patients with skeletal metastases, especially those who
receive aggressive treatment [5]. This indicates different
treatment methods could significantly improve the prognosis of selected high-risk M1 cases. However, solely relying
on the TNM classification to predict the outcomes of
patients with skeletal metastasis may result in inaccurate
assessment, leading to unnecessary treatment and financial
burdens or – even worse – the patient receiving a suboptimal treatment strategy. Moreover, individualized follow-up
and treatment strategies may be required for specific subgroups of patients with different risks of skeletal metastasis.
Bone scintigraphy (BS) remains is the leading diagnostic
method for bone metastasis during initial work-up as it is
widely available and low cost. However, BS is not routinely
conducted during follow-up as it has a low diagnostic
sensitivity, especially for early bone metastatic lesions;
metastases mainly located in the bone marrow are frequently not detected by BS [6]. Although 18F–FDG PET/
CT has a higher sensitivity than BS for detecting bone
metastases in primary NPC, 18F–FDG PET/CT technique
is expensive [7]. However, differentiation of malignant and
benign lesions on BS and 18F–FDG PET remains problematic, even for experienced nuclear physicians.
As far as we are aware, research on the frequency of
bone metastases at initial diagnosis (SMAD) and skeletal
metastasis-free survival (SMFS) in NPC is rare and
narrowly-focused [8–11]. The lack of such data hampers
accurate patient staging and risk stratification and delays
the design of more reliable treatment protocols, as the M1
category is a “catch-all” classification that includes patients
whose treatment response could be potentially curable or
incurable. Identifying subgroups of patients with different
risks of bone metastasis could help determine the appropriate imaging techniques and follow-up timing in a more personalized manner. Furthermore, more accurate prediction
of the risk of skeletal metastasis could provide valuable
decision-making information for clinicians and patients.
Page 2 of 13
Nomograms incorporate a variety of important factors
and have been demonstrated to be reliable prediction
tools for quantifying individual risk in cancer. Nomograms
can provide more precise prognoses than the traditional
TNM staging system in several tumor types. To date, there
has been no attempt to establish nomograms to predict
SMAD and SMFS in NPC. We hypothesized nomograms
combining T category, N category and other objective
laboratory indexes could generate more accurate predictive models for SMAD and SMFS. Therefore, we
assessed the prognostic risk factors for SMAD and
SMFS in a large cohort of patients with NPC and validated
the resulting nomograms using an external cohort treated
at two other institutions.
Methods
Training cohort
The training cohort was derived from patients treated at
Sun Yat-sen University Cancer Center between and
December, 2012. The inclusion criteria were: (i) pathologically confirmed NPC; (ii) complete pretreatment
clinical information and laboratory data; (iii) BS and/or
18F–FDG PET/CT at diagnosis of NPC; and (iv) complete
follow-up data. Exclusion criteria were incomplete followup data, death due to non-NPC-associated accident, or
previous/synchronous malignant tumors. Ethical approval
was obtained from the institutional review boards. The
requirement for informed consent was waived as this was
a retrospective study. The study protocol complied with
the Declaration of Helsinki and was approved by the
Ethics Committee of Sun Yat-sen University Cancer Center.
A standardized form was designed to retrieve all relevant data, including sociodemographic data (age, gender,
smoking history, alcohol exposure, family history of
malignant tumors, family history of NPC); baseline
laboratory data including plasma Epstein-Barr virus (EBV)
DNA copy number, serum calcium, serum magnesium,
serum phosphorus, serum albumin(ALB), serum globulin
(GLB), serum aspartate transaminase (AST), serum alanine
transaminase (ALT), serum alkaline phosphatase (ALP),
serum lactate dehydrogenase (LDH), serum C-reactive
protein (CRP); T category [primary tumor location, size,
extension], N category [number/location of lymph node
metastases); and treatment data (radiotherapy technique, fractions, dosage; chemotherapy). Clinical stage
was assessed using the seventh edition of the AJCC/
UICC TNM staging system.
Treatment
All patients were treated using definitive radiotherapy
(RT). The dose ranges for the nasopharynx, node-positive
region and node-negative regions were 60–80, 60–70, and
50–60 Gy, respectively. Patients with stage I or II NPC did
not receive chemotherapy; patients with stage III or IV
Yang et al. BMC Cancer (2017) 17:628
NPC received induction, concurrent or adjuvant chemotherapy (or a combination of these strategies) as recommended by the institutional guidelines. Induction or
adjuvant chemotherapy were cisplatin with 5-fluorouracil;
cisplatin with taxoids; or cisplatin, 5-fluorouracil and
taxoids (every 3 weeks; two to three cycles). Concurrent
chemotherapy was cisplatin in weeks 1, 4 and 7 of
radiotherapy or cisplatin weekly.
Validation cohort
To examine the general applicability of the model, an
independent external validation cohort of 1329 consecutive
patients with NPC who received definitive radiotherapy at
the Fifth affiliated hospital of Sun-Yat Sen University and
the First hospital of the Foshan between January, 2006 and
December, 2012 were included. Inclusion and exclusion
were the same as the training cohort. Sufficient data was
available for all patients to score all variables in the nomograms established in this study.
Statistical analysis
SMAD was defined as the presence of skeletal metastasis
on BS or 18F–FDG PET/CT at initial diagnosis (before
receiving any treatment). SMFS was measured as time
from diagnosis to detection of skeletal metastasis or censorship at last follow-up. In the training set, continuous
variables were expressed as mean (± standard deviation),
medians and ranges were transformed into dichotomous
variables using the median value. Categorical variables
were compared using the chi-square test or Fisher’s exact
test; categorical/continuous variables, univariate logistic
regression. Variables achieving significance at the level of
P < 0.05 were entered into multivariate logistic regression
analyses via stepwise procedures. In the training set,
survival curves for different variables were plotted using
the Kaplan-Meier method and compared using the logrank test. Significant variables (P < 0.05) were entered into
the Cox proportional hazards multivariate analyses to
identify independent prognostic factors via forward stepwise procedures (P < 0.05). Statistical data analyses were
performed using SPSS 22.0 (SPSS, Chicago, IL, USA).
Based on multivariate analyses, nomograms were generated to provide visualized risk prediction using the survival
and rms packages of R 2.14.1 ().
Nomograms were subjected to bootstrap resampling
(n = 1000) for interval and external validation to correct the concordance index (c-index) and explain variance
with respect to over-optimism. The ability of the nomograms and TNM staging system to predict survival were
compared using the c-index, a variable equivalent to the
area under curve (AUC) of receiver operating characteristic
curves for censored data. The maximum c-index value is
1.0, which indicates perfect prediction, while 0.5 indicates
the probability of correctly predicting the outcomes by
Page 3 of 13
random chance. The nomogram and TNM staging system
were compared using rcorrp.cens in the Hmisc module
of R. The nomogram for 1-, 3-, and 5-year SMFS was
calibrated by comparing predicted and actual observed
survival rates. During external validation, the nomogram
point scores were calculated for individual patients, then
Cox regression analysis was performed using total point
scores as a predictor in the validation cohort.
In addition to numerically comparing discriminative
ability by c-index, we also attempted to confirm the
superior independent discriminative ability of the nomograms over the standard TNM staging system. The training
cohort were evenly grouped into three risk groups by
nomogram score, then we investigated the predictive ability
of the risk stratification cut-off points and different subgroups (TNM stage) using Kaplan-Meier survival curve
analysis. A two-sided P value <0.05 was deemed significant.
Details of the R code used to generate the nomograms can
be assessed in the additional information online (Additional
file 1). This trial was registered with Clinical Trials.Gov
(NCT00705627); all data has been deposited at Sun Yat-sen
University Cancer Center for future reference (number
RDD RDDA2017000293).
Results
Patient characteristics and survival
A total of 2685 and 1329 patients in the training and
external validation cohorts were eligible for the SMAD
analyses (Additional file 2: Figure S1). Median age was
45-years-old (range, 23 to 78-years-old) for the training
cohort and 45-years-old (range, 19 to 70-years-old) for
the validation cohort. After excluding patients with
distant metastasis at diagnosis, 2469 and 1231 patients
were included in the analyses for SMFS. Median followup for SMFS in the training cohort was 65.0 months and
61.8 months in the validation cohort. Five-year SMFS
was 86% in the training cohort and 85.4.0% in the validation cohort. In both cohorts, a total of 391 patients
(9.7%) developed skeletal metastases after initial diagnosis, and 287 patients (7.7%) were confirmed to have skeletal metastases at initial diagnosis. The characteristics of
the cohorts are summarized in Table 1 and Additional
file 3: Table S1.
Univariate and multivariate analyses
The factors associated with significantly poorer SMAD
included in the univariate logistic regression model were
sex (male); elevated LDH, CRP, ALP, platelets, monocytes,
neutrophils and plasma EBV DNA; decreased hemoglobin
(HGB) and ALB; and advanced clinical N category. All
significant variables were entered into multivariate logistic
regression; ALP, LDH, HGB, plasma EBV DNA and N
category retained independent prognostic significance for
SMAD.
Yang et al. BMC Cancer (2017) 17:628
Page 4 of 13
Table 1 Associations between the clinical and laboratory characteristics of the patients and SMAD as indicated by the chi-square
test or Fisher’s exact test
Characteristic
Number (%)
Training cohort
P-value
Validation cohort
Number (%)
SMAD
Absent
Present
Age, years
0.379
< 45
1404 (52.3%)
1311 (93.4%)
93 (6.6%)
679 (51.1%)
≥ 45
1281 (47.7%)
1185 (92.5%)
96 (7.5%)
650 (48.9%)
Male
2131 (79.4%)
1969 (92.4%)
162 (7.6%)
Female
554 (20.6%)
527 (95.1%)
27 (4.9%)
Sex
0.025
Smoking Status
986 (74.2%)
343 (25.8%)
0.055
Absent
1708 (63.3%)
1600 (93.7%)
108 (6.3%)
795 (59.8%)
Present
977 (36.4%)
896 (91.7%)
81 (8.3%)
534 (40.2%)
Absent
2382 (88.7%)
2215 (93.0%)
167 (7.0%)
Present
303 (11.3%)
281 (92.7%)
22 (7.3%)
Drinking Status
0.873
Family history
1117 (84.0%)
212 (16.0%)
0.566
Absent
1926 (71.7%)
1787 (92.8%)
139 (7.2%)
967 (72.8%)
Present
759 (28.3%)
709 (93.4%)
50 (6.6%)
362 (27.2%)
< 2.4
1370 (51.0%)
1273 (92.9%)
97 (7.1%)
≥ 2.4
1315 (49.0%)
1223 (93.0%)
92 (7.0%)
Calcium, mmol/L
0.932
Phosphorus, mmol/L
501 (37.7%)
828 (62.3%)
0.587
< 1.15
1398 (52.1%)
1296 (92.7%)
102 (7.3%)
676 (50.9%)
≥ 1.15
1287 (47.9%)
1200 (93.2%)
87 (6.8%)
653 (49.1%)
< 0.93
1410 (52.2%)
1304 (92.5%)
106 (7.5%)
≥ 0.93
1275 (47.5%)
1192 (93.5%)
83 (6.5%)
Magnesium, mmol/L
0.308
CRP, mg/L
919 (69.1%)
410 (30.9%)
< 0.001
< 1.91
1345 (50.1%)
1283 (95.4%)
62 (4.6%)
722 (54.3%)
≥ 1.91
1340 (49.9%)
1213 (90.5%)
127 (9.5%)
607 (45.7%)
< 6.9
1376 (51.2%)
1289 (93.7%)
87 (6.3%)
≥ 6.9
1309 (48.8%)
1207 (92.2%)
102 (7.8%)
9
WBCs, ×10
0.137
Neutrophils, ×109
677 (50.9%)
652 (49.1%)
0.001
< 4.2
1356 (50.5%)
1283 (94.6%)
73 (5.4%)
691 (52.0%)
≥ 4.2
1329 (49.5%)
1213 (91.3%)
116 (8.7%)
638 (48.0%)
< 145
1379 (51.4%)
1264 (91.7%)
115 (8.3%)
≥ 145
1306 (48.6%)
1232 (94.3%)
74 (5.7%)
HGB, g/L
Platelets, ×109
0.007
758 (57.0%)
571 (43.0%)
0.013
< 229
1343 (50.0%)
1265 (94.2%)
78 (5.8%)
638 (48.0%)
≥ 229
1342 (50.0%)
1231 (91.7%)
111 (8.3%)
691 (52.0%)
1345 (50.1%)
1256 (93.4%)
89 (6.6%)
ALT, U/L
< 22.2
0.392
725 (54.6%)
Yang et al. BMC Cancer (2017) 17:628
Page 5 of 13
Table 1 Associations between the clinical and laboratory characteristics of the patients and SMAD as indicated by the chi-square
test or Fisher’s exact test (Continued)
≥ 22.2
1340 (49.9%)
1240 (92.5%)
100 (7.5%)
< 21
1366 (50.9)
1281 (93.8%)
85 (6.2%)
≥ 21
1319 (49.1%)
1215 (92.1%)
104 (7.9%)
AST, U/L
604 (45.4%)
0.092
ALP, U/L
675 (50.8%)
654 (49.2%)
< 0.001
< 70
1357 (50.5%)
1304 (96.1%)
53 (3.9%)
744 (56.0%)
≥ 70
1328 (49.5%)
1192 (89.8%)
136 (10.2%)
585 (44.0%)
< 172.2
1344 (50.1%)
1287 (95.8%)
57 (4.2%)
≥ 172.2
1341 (49.9%)
1209 (90.2%)
132 (9.8%)
LDH, U/L
< 0.001
ALB, g/L
706 (53.1%)
623 (46.9%)
0.003
< 44.9
1351 (50.3%)
1236 (91.5%)
115 (8.5%)
576 (43.3%)
≥ 44.9
1334 (49.7%)
1260 (94.5%)
74 (5.5%)
753 (56.7%)
< 30.5
1341 (49.9%)
1251 (93.3%)
90 (6.7%)
≥ 30.5
1344 (50.1%)
1245 (92.6%)
99 (7.4%)
GLB, g/L
0.507
Cholesterol, mmol/L
793 (59.7%)
536 (40.3%)
0.054
< 5.12
1353 (50.4%)
1245 (92.0%)
108 (8.0%)
576 (43.3%)
≥ 5.2
1332 (49.6%)
1251 (93.9%)
81 (6.1%)
753 (56.7%)
< 1.8
1392 (51.8%)
1287 (92.5%)
105 (7.5%)
≥ 1.8
1293 (48.2%)
1209 (93.5%)
84 (6.5%)
T lymphocytes, ×109
0.289
Monocytes, ×109
622 (46.8%)
707 (53.2%)
0.005
< 0.4
1385 (51.6%)
1306 (94.3%)
79 (5.7%)
462 (34.8%)
≥ 0.4
1300 (48.4%)
1190 (91.5%)
110 (8.5%)
867 (65.2%)
Undifferentiated
2592 (96.5%)
2410 (93.0%)
182 (7.0%)
Differentiated
93 (3.5%)
86 (92.5%)
7 (7.5%)
Pathology
0.852
Cranial nerve injury
1300 (97.8%)
29 (2.2%)
0.730
Absent
2498 (93.0%)
2321 (92.9%)
177 (7.1%)
1234 (92.9%)
Present
187 (7.0%)
175 (93.6%)
12 (6.4%)
95 (7.1%)
< 1000
1130 (42.1%)
1092 (96.6%)
38 (3.4%)
526 (39.6%)
1000–9999
585 (21.8%)
555 (94.9%)
30 (5.1%)
265 (19.9%)
10,000–99,999
599 (22.3%)
555 (92.7%)
44 (23.3%)
325 (24.5%)
100,000–999,999
290 (10.8%)
245 (84.5%)
45 (15.5%)
156 (11.7%)
≥ 1,000,000
81 (3.0%)
49 (60.5%)
32 (39.5%)
57 (4.3%)
1
167 (6.2%)
158 (94.6%)
37 (5.4%)
81 (6.1%)
2
525 (19.6%)
488 (93.0%)
37 (7.0%)
328 (24.7%)
3
1374 (51.2%)
1278 (93.0%)
96 (7.0%)
630 (47.4%)
4
619 (23.1%)
572 (92.4%)
47 (7.6%)
EBV-DNA, copies/ml
< 0.001
T category
0.804
N category
0
290 (21.8%)
< 0.001
319 (11.9%)
312 (97.8%)
7 (2.2%)
250 (18.8%)
Yang et al. BMC Cancer (2017) 17:628
Page 6 of 13
Table 1 Associations between the clinical and laboratory characteristics of the patients and SMAD as indicated by the chi-square
test or Fisher’s exact test (Continued)
1
921 (34.3%)
887 (96.3%)
34 (3.7%)
449 (33.8%)
2
775 (28.9%)
697 (89.9%)
78 (10.1%)
370 (27.8%)
3
549 (20.4%)
494 (90.0%)
55 (10.0%)
243 (18.3%)
4
121 (4.5%)
106 (87.6%)
15 (12.4%)
Radiotherapy technique
17 (1.3%)
0.451
IMRT +3DCRT
1341(49.9%)
1252 (93.4%)
89 (6.6%)
705(65.9%)
CRT
1344(51.1%)
1244 (92.6%)
100 (7.4%)
624(34.1%)
Radiotherapy
505(18.8%)
481 (95.2%)
24 (4.8%)
CCRT
1136 (42.3%)
1086 (95.6%)
50(4.4%)
425 (32.2%)
Neo + radiotherapy
483 (18.0%)
419 (86.7%)
64 (13.3%)
265 (20.1%)
Neo + CCRT
561(20.9%)
510 (90.9%)
51(9.1%)
311 (23.5%)
Treatment method
P < 0.001
318 (24.1%)
SMAD
Absent
2496 (93.0%)
1231 (92.6%)
Present
189 (7%)
98 (7.4%)
Abbreviations: SMAD skeletal metastasis at time of diagnosis, WBCs white blood cells, HGB hemoglobin, GLB globulin, ALB albumin, ALT alanine transaminase, AST
aspartate transaminase, ALP alkaline phosphatase, LDH lactate dehydrogenase, CRP C-reactive protein, GGT gamma glutamyl transpeptidase, EBV-DNA Epstein-Barr
virus DNA, Undifferentiated undifferentiated non-keratinizing carcinoma, Differentiated differentiated carcinoma, CRT conventional radiotherapy, IMRT intensity
modulated radiation therapy, 3D–CRT three dimensional conformal radiation therapy, RT radiotherapy, CCRT concurrent radiotherapy, Neo
neoadjuvant chemotherapy
The factors associated with significantly poorer SMFS
in the univariate Cox regression models were advanced
age; elevated LDH, CRP, ALP, monocytes and plasma
EBV-DNA; decreased globulin (GLB) and ALB; and
advanced clinical N category. ALP, LDH, CRP, plasma
EBV DNA and N category retained independent prognostic value in multivariate logistic regression. Detailed
summaries of the multivariate analyses are shown in
Tables 2 and 3.
than the c-index values for the TNM classification with
respect to SMAD (0.64; 95% CI, 0.60–0.67; P < 0.001)
and SMFS (0.58; 95% CI, 0.54–0.63; P = 0.005), respectively (Table 4).
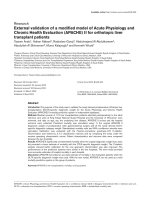
The calibration plots demonstrated good agreement
between the nomogram predictions and actual 1-, 3-,
and 5-year SMFS rates observed in both the training and
the validation cohorts (Fig. 2).
Nomograms for risk stratification
Nomograms for predicting SMAD and SMFS
The independent prognostic factors for SMAD and
SMFS were used to construct nomograms (Fig. 1). Each
variable was assigned a score. By determining the total
score for all variables on the total point scale, the probabilities of specific outcomes could be determined by
drawing a vertical line from the total score. Plasma EBV
DNA copy number was the most important factor for
prediction of both SMAD and SMFS.
In the training cohort, the SMAD nomogram had a
bootstrap-corrected c-index of 0.83 (95% CI, 0.78–0.87),
significantly higher than the TNM classification (0.73;
95% CI, 0.70–0.77; P = 0.005). The c-index of the nomogram for SMFS (0.70; 95% CI, 0.67–0.74) was also
significantly higher than the TNM classification (0.59;
95% CI, 0.56–0.63; P < 0.001). In the external validation
cohort, the c-index value of the nomogram for SMAD
was 0.76 (95% CI, 0.71–0.79) and 0.61 (95% CI, 0.55–
0.66) for SMFS; both of which were significantly better
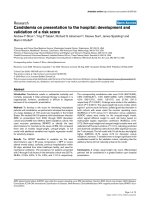
We determined the cut-off values for the nomogramgenerated scores by which the patients in the training
cohort could be stratified into three risk groups. Each
group had a distinct prognosis (Additional file 3: Table S2).
This stratification could effectively predict SMFS for the
three proposed risk groups in both the training and validation cohorts (Fig. 3). The risk stratification even provided
significant distinction between the Kaplan-Meier SMFS
curves for each of the three risk groups within each TNM
stage (Fig. 3).
Discussion
This is the first study to retrospectively assess a very
large number of patients with NPC to evaluate the prognostic value of a wide range of clinical and laboratory
parameters in order to establish effective prognostic
tools for skeletal metastasis. The nomograms established
in this analysis demonstrated superior discriminative
ability compared to the TMM classification of the
Yang et al. BMC Cancer (2017) 17:628
Page 7 of 13
Table 2 Associations between the clinical and laboratory characteristics of the patients and SMAD in univariate and multivariate
logistic regression analysis
Characteristic
Univariate
HR
Multivariate
95% CI
P-value
Age (≥ 45 vs. < 45 years)
1.142
0.850–1.535
0.379
Gender (Male vs. Female)
0.623
0.410–0.946
0.027
Smoking Status (Present vs. Absent)
1.139
0.993–1.807
0.056
Drinking Status (Present vs. Absent)
1.038
0.655–1.647
0.873
Family history (Present vs. Absent)
0.907
0.649–1.267
0.566
Calcium, mmol/L (≥ 2.4 vs. < 2.4)
0.987
0.734–1.327
0.932
Phosphorus, mmol/L (≥ 1.15 vs. < 1.15)
0.921
0.685–1.239
0.587
Magnesium, mmol/L (≥ 0.93 vs. < 0.93)
0.857
0.636–1.154
0.308
CRP, mg/L (≥ 1.91 vs. < 1.91)
2.167
1.583–2.965
< 0.001
WBCs, ×109 (≥ 6.9 vs. < 6.9)
1.252
0.931–1.684
0.137
Neutrophils, ×109 (≥ 4.2 vs. < 4.2)
1.681
1.241–2.276
0.001
HGB, g/L (≥ 145 vs. < 145)
0.660
0.488–0.893
0.007
Platelets, ×109 (≥ 229 vs. < 229)
1.462
1.083–1.974
0.013
ALT, U/L (≥ 22.2 vs. < 22.2)
1.138
0.846–1.530
0.392
HR
95% CI
P-value
0.672
0.477–0.948
0.023
AST, U/L (≥ 21 vs. < 21)
1.290
0.958–1.736
0.093
ALP, U/L (≥ 70 vs. < 70)
2.807
2.024–3.893
< 0.001
2.148
1.509–3.056
< 0.001
LDH, U/L (≥ 172.2 vs. < 172.2)
2.465
1.789–3.396
< 0.001
1.512
1.069–2.139
0.019
ALB, g/L (≥ 44.9 vs. < 44.9)
0.631
0.466–0.854
0.003
GLB, g/L (≥ 30.5 vs. < 30.5)
1.105
0.822–1.486
0.507
1.000
1.000
Cholesterol, mmol/L (≥ 5.12 vs. < 5.12)
0.746
0.554–1.006
0.055
T lymphocytes, ×109 (≥ 1.8 vs. < 1.8)
0.852
0.632–1.147
0.290
Monocytes, ×109 (≥ 0.4 vs. < 0.4)
1.528
1.133–2.062
0.006
Pathology (Differentiated vs. Undifferentiated
1.078
0.492–2.363
0.852
Cranial nerve injury (Absent vs. Present)
0.899
0.491–1.646
0.899
1.000
1.000
1000–9999
1.553
0.952–2.534
0.078
1.293
0.784–2.131
10,000–99,999
2.278
1.459–3.558
< 0.001
1.588
0.998–2.530
0.051
100,000–999,999
5.278
3.354–8.307
< 0.001
3.234
1.982–5.279
< 0.001
18.767
10.822–32.544
< 0.001
10.703
5.876–19.498
< 0.001
1.000
1.000
EBV-DNA, copies/ml
< 1000
≥ 1,000,000
< 0.001
T category
1
< 0.001
0.314
0.805
2
1.331
0.629–2.818
0.455
3
1.319
0.653–2.663
0.440
4
1.443
0.692–3.007
0.328
0
1.000
1.000
1
1.708
0.750–3.893
2
4.988
3
4.962
4
6.307
N category
< 0.001
0.002
1.000
1.000
0.202
1.292
0.559–2.984
0.549
2.276–10.933
< 0.001
2.924
1.304–6.557
0.009
2.232–11.035
< 0.001
2.299
0.996–5.306
0.051
2.504–15.887
< 0.001
2.606
0.983–6.905
0.054
Abbreviations: SMAD skeletal metastasis at the time of diagnosis, WBCs white blood cells, HGB hemoglobin, GLB globulin, ALB albumin, ALT alanine
transaminase, AST aspartate transaminase, ALP alkaline phosphatase, LDH lactate dehydrogenase, CRP C-reactive protein, GGT gamma glutamyl
transpeptidase, EBV-DNA Epstein-Barr virus DNA, Undifferentiated undifferentiated non-keratinizing carcinoma, Differentiated differentiated carcinoma
Yang et al. BMC Cancer (2017) 17:628
Page 8 of 13
Table 3 Associations between the clinical and laboratory characteristics of the patients and SMFS in univariate and multivariate
logistic regression analysis
Characteristic
Univariate
Multivariate
HR
95% CI
P-value
Age (≥ 45 vs. < 45 years)
1.288
1.008–1.647
0.043
Gender (Male vs. Female)
0.867
0.635–1.184
0.371
Smoking Status (Present vs. Absent)
1.120
0.871–1.440
0.376
Drinking Status (Present vs. Absent)
0.911
0.615–1.349
0.642
Family history (Present vs. Absent)
0.831
0.627–1.010
0.198
Calcium, mmol/L (≥ 2.4 vs. < 2.4)
0.927
0.725–1.186
0.548
Phosphorus, mmol/L (≥ 1.15 vs. < 1.15)
0.927
0.725–1.185
0.545
Magnesium, mmol/L (≥ 0.93 vs. < 0.93)
0.804
0.552–1.172
0.257
CRP, mg/L (≥ 1.91 vs. < 1.91)
2.092
1.618–2.706
< 0.001
WBCs, ×109 (≥ 6.9 vs. < 6.9)
1.050
0.822–1.342
0.694
Neutrophils, ×109 (≥ 4.2 vs. < 4.2)
1.177
0.921–1.504
0.193
HGB, g/L (≥ 145 vs. < 145)
0.835
0.653–1.068
0.150
9
Platelets, ×10 (≥ 229 vs. < 229)
1.134
0.887–1.449
0.315
ALT, U/L (≥ 22.2 vs. < 22.2)
0.971
0.760–1.241
0.814
HR
95% CI
1.450
1.108–1.897
P-value
0.007
0.023
AST, U/L (≥ 21 vs. < 21)
1.283
1.003–1.641
0.047
ALP, U/L (≥ 70 vs. < 70)
2.023
1.570–2.606
< 0.001
1.654
1.275–2.145
< 0.001
LDH, U/L (≥ 172.2 vs. < 172.2)
1.951
1.514–2.514
< 0.001
1.424
1.098–1.847
< 0.001
ALB, g/L (≥ 44.9 vs. < 44.9)
0.694
0.542–0.889
0.004
1.000
1.000
GLB, g/L (≥ 30.5 vs. < 30.5)
1.594
1.242–2.047
< 0.001
Cholesterol, mmol/L (≥ 5.12 vs. < 5.12)
0.955
0.747–1.220
0.710
T lymphocytes, ×10 (≥ 1.8 vs. < 1.8)
0.913
0.714–1.167
0.468
Monocytes, ×109 (≥ 0.4 vs. < 0.4)
1.431
1.118–1.832
0.004
Pathology (Differentiated vs. Undifferentiated
0.410
0.153–1.101
0.077
Cranial nerve injury (Absent vs. Present)
1.075
0.666–1.736
0.767
< 1000
1.000
1.000
1000–9999
1.955
1.349–2.832
< 0.001
1.521
1.045–2.215
0.029
10,000–99,999
2.757
1.959–3.881
< 0.001
1.822
1.277–2.601
0.001
100,000–999,999
4.569
3.147–6.631
< 0.001
2.706
1.829–4.004
< 0.001
≥ 1,000,000
7.451
4.221–13.151
< 0.001
4.764
1.829–8.533
< 0.001
Radiotherapy
1.000
1.000
CCRT
1.064
0.639–1.773
0.811
Neo + Radiotherapy
0.188
0.834–2.521
0.188
Neo + CCRT
0.752
0.426–1.325
< 0.001
0.745
0.378–1.471
0.397
1
1.000
1.000
2
3.190
1.269–8.020
0.014
3
3.752
1.538–9.157
0.004
4
3.966
1.596–9.856
0.003
9
EBV-DNA, copies/ml
< 0.001
Treatment method
Radiotherapy technology (IMRT + 3DCRT vs. CRT)
< 0.001
0.040
T category
0.021
Yang et al. BMC Cancer (2017) 17:628
Page 9 of 13
Table 3 Associations between the clinical and laboratory characteristics of the patients and SMFS in univariate and multivariate
logistic regression analysis (Continued)
N category
< 0.001
< 0.001
0
1.000
1.000
1.000
1.000
1
1.731
0.928–3.230
0.085
1.432
0.765–2.681
2
3.017
1.638–5.558
< 0.001
2.149
1.156–3.995
0.016
3
5.987
3.281–10.925
< 0.001
3.613
1.947–6.704
< 0.001
4
6.310
3.079–12.933
< 0.001
3.629
1.742–7.559
0.001
0.262
Abbreviations: SMFS skeletal metastasis-free survival, WBCs white blood cells, HGB hemoglobin, GLB globulin, ALB albumin, ALT alanine transaminase, AST aspartate
transaminase, ALP alkaline phosphatase, LDH lactate dehydrogenase, CRP C-reactive protein, GGT gamma glutamyl transpeptidase, EBV-DNA Epstein-Barr virus
DNA, Undifferentiated undifferentiated non-keratinizing carcinoma, Differentiated, differentiated carcinoma
seventh edition of the UICC/AJCC staging system and
enabled risk scoring for individual patients. The independent prognostic factors for skeletal metastasis (SMAD,
SMFS) included N category, circulating EBV-DNA, LDH,
ALP, HGB and CRP; each of these factors has been
previously reported to play a vital role in tumor progression or metastasis.
Advanced N category was significantly associated with
skeletal metastasis in this study, which reflects the
assumption that the tumor cells responsible for distant
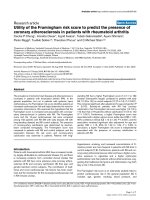
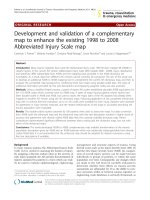
Fig. 1 Nomograms for predicting SMAD (a) and SMFS (b) in NPC. Points refers to the value of each factor included in the nomogram; total points,
total points for all factors; 1/3/5-year survival, survival probability based on total points; ALP, alkaline phosphatase; HGB, hemoglobin; LDH, lactate
dehydrogenase; CRP, C-reactive protein; EBV, Epstein-Barr virus; SMAD, skeletal metastasis at diagnosis; SMFS, skeletal-metastasis free survival
Yang et al. BMC Cancer (2017) 17:628
Page 10 of 13
Table 4 The c-index values for performance of the multivariate model and the TNM classification for prediction of SMAD and SMFS
in the training set and validation set
Model
Training set
Validation set
C-index
95% CI
P-value
C-index
95% CI
P-value
Nomograms (SMAD)
0.83
0.78–0.87
0.005
0.76
0.71–0.79
< 0.001
TNM classification (SMAD)
0.73
0.70–0.77
0.64
0.60–0.67
Nomograms (SMFS)
0.70
0.67–0.74
TNM classification (SMFS)
0.59
0.56–0.63
< 0.001
0.61
0.55–0.0.66
0.58
0.54–0.63
0.005
Abbreviations: SMAD skeletal metastasis at the time of diagnosis, SMFS skeletal metastasis-free survival
metastasis disseminate from the lymph nodes, rather
than the primary tumor. In agreement with our findings,
high serum ALP has also previously been reported to be
a negative prognostic factor for skeletal metastasis and is
used in the clinic to predict the presence of bone metastases
in a range of cancers, including lung cancer and prostate
cancer [12, 13]. The hydrolase ALP dephosphorylates a
variety of molecules. Serum ALP is usually low in healthy
individuals, but increases during pregnancy and in patients
with bile duct obstruction, kidney disease, hepatocellular
carcinoma or bone metastasis [14–18]. Yang et al. reported
a high serum LDH level was an independent, unfavorable
Fig. 2 Calibration plots for SMFS at 1, 3 and 5 years in the training cohort (a, b, c) and validation cohort (d, e, f). Nomogram-predicted SMFS is plotted
on the x-axis; actual rates of SMFS are plotted on the y-axis. The dashed lines along the 45-degree line through the origin represent the perfect calibration models in which the predicted probabilities are identical to the actual probabilities. SMFS, skeletal-metastasis free survival
Yang et al. BMC Cancer (2017) 17:628
Page 11 of 13
Fig. 3 Kaplan–Meier curves of SMFS for the three risk group stratifications. Nomogram risk group stratifications for the 33 and 66 percentiles are
shown for the training cohort (a, c) and validation cohort (b, d). SMFS, skeletal-metastasis free survival
risk factor for overall survival (OS) and distant-metastasis
free survival (DMFS) in non-metastatic NPC [19]. This
study provides the first evidence that high serum LDH is an
independent prognostic factor for skeletal metastasis in
NPC. Rapid tumor cell proliferation initiates anaerobic
glycolysis to produce energy, which requires the transformation of pyruvate to lactate by LDH, a key enzyme of
glycolysis [20]. In addition, increased LDH levels lead to a
low extracellular pH and activate the hypoxia-inducible
factor (HIF) pathway, which is well-recognized to promote tumor growth, aggressiveness and distant metastasis [21–25].
In the regions where NPC is endemic, EBV infection
is associated with an increased risk of NPC, and plasma
EBV DNA is a useful prognostic marker in both early
and advanced NPC [26, 27]. The present study indicates that circulating EBV DNA is also an independent
prognostic factor for skeletal metastasis in NPC. Leung
et al. reported that the EBV DNA cutoff value of 4000
copies/mL could categorize patients with early-stage
NPC into a high-risk subgroup (with similar survival
outcomes to patients with stage III disease) and a lowrisk subgroup (with similar survival outcomes to stage I
disease) [28]. A previously-established nomogram for
disease-free survival (DFS) revealed incorporation of
plasma EBV DNA increased the C-index compared to
the model that did not include EBV DNA [29]. In further confirmation of its prognostic value, plasma EBV
DNA was incorporated as a significant factor into the
prognostic models for SMAD and SMFS in this study,
and resulted in more accurate risk discrimination for
individual patients.
Reduced HGB was also an independent prognostic
factor for poor SMAD, consistent with the report by
Ong et al. [30]. Anemia is more common in patients
with advanced stage disease and/or a poor performance
status, both of which are associated with a higher probability of skeletal metastasis in NPC. Elevated CRP has
been associated with advanced tumor classification, bone
invasion and lymph node metastasis in NPC [31]. Similarly, CRP moderately enhanced the predictive ability of
the SMFS nomogram in this study. The link between
inflammation and cancer is well-recognized; prolonged
exposure to proinflammatory cytokines may eventually
result in the induction of CRP synthesis and is considered to be a prognostic factor in NPC [32, 33]. In the
future, improving nutrition status, inflammatory status
and immune function could potentially further improve
the clinical outcome of patients with NPC.
The present study has several limitations. First, the
time span of data collection was nearly 7 years for the
data set. Therefore, the question of whether the nomograms can be applied to patients currently receiving
treatment should be asked. However, at our institution,
the pathologic examination has not changed during this
period of time. Second, patient comorbidities were not
assessed. Liu et al. previously reported that comorbidity
could affect OS to some extent in NPC [34]. However,
the diversity of comorbidities makes it difficult to establish
categorized variables and quantify risk. Therefore, the
Yang et al. BMC Cancer (2017) 17:628
prognostic significance of comorbidities should be assessed
in future nomogram studies. Finally, whether this nomogram can be applied to younger patients (aged <18-yearsold) or patients in areas with a low occurrence of NPC
remains to be determined.
In summary, we have developed and externally-validated
nomograms to predict SMAD and SMFS based on analyses
of a relatively large number of patients with NPC. The
nomograms provide significantly better discrimination than
the current seventh TNM classification of the AJCC staging
system and also enable individualized prognostication of
skeletal metastasis. Moreover, the accuracy of the nomograms was validated using large datasets for patients treated
at other two institutions. In conclusion, these nomograms
represent useful tools for predicting skeletal metastasis,
facilitating patient counseling, and providing timely surveillance and clinical assessments.
Conclusion
This is the first large cohort study to establish a prediction nomogram for skeletal metastasis in non-metastatic
NPC; the predictive accuracy of the model was validated
in an external cohort.
Page 12 of 13
HSD and CY revised it critically for important intellectual content; CY agreed
to be accountable for all aspects of the work and ensuring questions related
to the accuracy or integrity of this work are appropriately investigated and
resolved. All authors (YL, XLP, WY, CHY, HSS, CHY, LSB, PPJ, HSD and CY)
have read and approved the final manuscript.
Ethics approval and consent to participate
Ethical approval was obtained from the institution through the respective
institutional review boards, which belong to the Ethics Committee of Sun
Yat-sen University Cancer Center. All patients provided written informed
consent to participate in this study.
Consent for publication
Not applicable
Competing interests
The authors declare that they have no competing interests.
Publisher’s Note
Springer Nature remains neutral with regard to jurisdictional claims in
published maps and institutional affiliations.
Author details
1
Sun Yat-sen University Cancer Center, 651 East Dong Feng Road,
Guangzhou 510060, China. 2State Key Laboratory of Oncology in Southern
China, Guangzhou, China. 3Collaborative Innovation Center for Cancer
Medicine, Guangzhou, China. 4The Six Affiliated Hospital of Sun Yat-sen
University, Guangzhou, China. 5The First Hospital of Foshan, Foshan, China.
6
The Fifth Affiliated Hospital of Sun Yat-sen University, Zhuhai, China.
Received: 3 December 2016 Accepted: 28 August 2017
Additional files
Additional file1: R code of the nomograms for SMAD and SMFS in
non-metastatic NPC after definitive radiotherapy. (DOCX 20 kb)
Additional file 2: Figure S1. Schematic of patient inclusion and
exclusion. (TIFF 30204 kb)
Additional file 3: Table S1. Associations between clinical and
laboratory characteristics and SMFS as indicated by the chi-square test or
Fisher’s exact test. (DOC 174 kb)
Abbreviations
18-FDG PET/CT: 18F–deoxyglucose positron emission tomography/computed
tomography; ALB: Albumin; ALP: Alkaline phosphatase; ALT: Alanine transaminase;
AST: Aspartate transaminase; AUC: Area under curve; BS: Bone scintigraphy;
CRP: C-reactive protein; DMFS: Distant-metastasis free survival; EBV: Epstein-Barr
virus; GLB: Globulin; HGB: Hemoglobin; HIF: Hypoxia-inducible factor; LDH: Lactate
dehydrogenase; NPC: Nasopharyngeal carcinoma; OS: overall survival;
RT: radiotherapy; SMAD: Skeletal metastasis at initial diagnosis; SMFS: Skeletal
metastasis-free survival
Acknowledgements
Not applicable
Funding
There was no funding for this research.
Availability of data and materials
Raw data was deposited in the Research Data Deposit system (research data
deposit number RDDA2017000293, ) of Sun
Yat-sen University Cancer and can be obtained from the corresponding
authors on reasonable request.
Authors’ contributions
YL, XLP and CY made substantial contributions to study conception and
design; YL, WY, HSS, HSD, LSB, CHY and PPJ collected the data; YL, WY, and
XLP analyzed the data and drafted the manuscript; LSB, CHY and PPJ
analyzed the data; YL gave final approval of the version to be published;
References
1. Cao SM, Simons MJ, Qian CN. The prevalence and prevention of
nasopharyngeal carcinoma in China. Chinese J Cancer. 2011;30(2):114–9.
2. Fong KW, Chua EJ, Chua ET, Khoo-Tan HS, Lee KM, Lee KS, Sethi VK, Tan BC,
Tan TW, Wee J, et al. Patient profile and survival in 270 computer
tomography-staged patients with nasopharyngeal cancer treated at the
Singapore General Hospital. Ann Acad Med Singap. 1996;25(3):341–6.
3. Heng DM, Wee J, Fong KW, Lian LG, Sethi VK, Chua ET, Yang TL, Khoo Tan HS,
Lee KS, Lee KM, et al. Prognostic factors in 677 patients in Singapore with
nondisseminated nasopharyngeal carcinoma. Cancer. 1999;86(10):1912–20.
4. Tan EH, Khoo KS, Wee J, Fong KW, Lee KS, Lee KM, Chua ET, Tan T, Khoo-Tan
HS, Yang TL, et al. Phase II trial of a paclitaxel and carboplatin combination in
Asian patients with metastatic nasopharyngeal carcinoma. Ann Oncol. 1999;
10(2):235–7.
5. Fandi A, Bachouchi M, Azli N, Taamma A, Boussen H, Wibault P, Eschwege F,
Armand JP, Simon J, Cvitkovic E. Long-term disease-free survivors in
metastatic undifferentiated carcinoma of nasopharyngeal type. J Clin Oncol.
2000;18(6):1324–30.
6. Algra PR, Bloem JL, Tissing H, Falke TH, Arndt JW, Verboom LJ. Detection of
vertebral metastases: comparison between MR imaging and bone
scintigraphy. Radiographics. 1991;11(2):219–32.
7. Liu FY, Chang JT, Wang HM, Liao CT, Kang CJ, Ng SH, Chan SC, Yen TC.
[18F]fluorodeoxyglucose positron emission tomography is more sensitive than
skeletal scintigraphy for detecting bone metastasis in endemic nasopharyngeal
carcinoma at initial staging. J Clin Oncol. 2006;24(4):599–604.
8. Tsuya A, Kurata T, Tamura K, Fukuoka M. Skeletal metastases in non-small
cell lung cancer: a retrospective study. Lung cancer. 2007;57(2):229–32.
9. Sun JM, Ahn JS, Lee S, Kim JA, Lee J, Park YH, Park HC, Ahn MJ, Ahn YC,
Park K. Predictors of skeletal-related events in non-small cell lung cancer
patients with bone metastases. Lung cancer. 2011;71(1):89–93.
10. Sekine I, Nokihara H, Yamamoto N, Kunitoh H, Ohe Y, Tamura T. Risk factors
for skeletal-related events in patients with non-small cell lung cancer
treated by chemotherapy. Lung cancer. 2009;65(2):219–22.
11. Delea T, Langer C, McKiernan J, Liss M, Edelsberg J, Brandman J, Sung J,
Raut M, Oster G. The cost of treatment of skeletal-related events in patients
with bone metastases from lung cancer. Oncology. 2004;67(5–6):390–6.
12. Min JW, Um SW, Yim JJ, Yoo CG, Han SK, Shim YS, Kim YW. The role of
whole-body FDG PET/CT, Tc 99m MDP bone scintigraphy, and serum
Yang et al. BMC Cancer (2017) 17:628
13.
14.
15.
16.
17.
18.
19.
20.
21.
22.
23.
24.
25.
26.
27.
28.
29.
30.
31.
32.
33.
34.
alkaline phosphatase in detecting bone metastasis in patients with newly
diagnosed lung cancer. J Korean Med Sci. 2009;24(2):275–80.
Schindler F, Lajolo PP, Pinczowski H, Fonseca FL, Barbieri A, Massonetto LH,
Katto FT, Del Giglio A. Bone and total alkaline phosphatase for screening
skeletal metastasis in patients with solid tumours. European J Cancer Care.
2008;17(2):152–6.
Bashiri A, Katz O, Maor E, Sheiner E, Pack I, Mazor M. Positive placental
staining for alkaline phosphatase corresponding with extreme elevation
of serum alkaline phosphatase during pregnancy. Arch Gynecol Obstet.
2007;275(3):211–4.
Al Mamari S, Djordjevic J, Halliday JS, Chapman RW. Improvement of serum
alkaline phosphatase to <1.5 upper limit of normal predicts better outcome
and reduced risk of cholangiocarcinoma in primary sclerosing cholangitis.
J Hepatol. 2013;58(2):329–34.
Damera S, Raphael KL, Baird BC, Cheung AK, Greene T, Beddhu S. Serum
alkaline phosphatase levels associate with elevated serum C-reactive protein
in chronic kidney disease. Kidney Int. 2011;79(2):228–33.
Lu Y, Lu Q, Chen HL. Diagnosis of primary liver cancer using lectin affinity
chromatography of serum alkaline phosphatase. J Exp Clin Cancer Res.
1997;16(1):75–80.
Sonpavde G, Pond GR, Berry WR, de Wit R, Armstrong AJ, Eisenberger MA,
Tannock IF. Serum alkaline phosphatase changes predict survival
independent of PSA changes in men with castration-resistant prostate
cancer and bone metastasis receiving chemotherapy. Urol Oncol. 2012;
30(5):607–13.
Yang L, Hong S, Wang Y, He Z, Liang S, Chen H, He S, Wu S, Song L, Chen
Y. A novel prognostic score model incorporating CDGSH iron sulfur
Domain2 (CISD2) predicts risk of disease progression in laryngeal squamous
cell carcinoma. Oncotarget. 2016;7(16):22720–32
Warburg O. On the origin of cancer cells. Science. 1956;123(3191):309–14.
Axelson H, Fredlund E, Ovenberger M, Landberg G, Pahlman S. Hypoxiainduced dedifferentiation of tumor cells–a mechanism behind
heterogeneity and aggressiveness of solid tumors. Semin Cell Dev Biol.
2005;16(4–5):554–63.
Colgan SM, Mukherjee S, Major P. Hypoxia-induced lactate dehydrogenase
expression and tumor angiogenesis. Clin Colorectal Cancer. 2007;6(6):442–6.
Maxwell PH. The HIF pathway in cancer. Semin Cell Dev Biol. 2005;16(4–5):
523–30.
Rofstad EK. Microenvironment-induced cancer metastasis. Int J Radiat Biol.
2000;76(5):589–605.
Stubbs M, McSheehy PM, Griffiths JR, Bashford CL. Causes and consequences
of tumour acidity and implications for treatment. Mol Med Today. 2000;6(1):
15–9.
McDermott AL, Dutt SN, Watkinson JC. The aetiology of nasopharyngeal
carcinoma. Clinical otolaryngology and allied sciences. 2001;26(2):82–92.
Lo YM, Chan AT, Chan LY, Leung SF, Lam CW, Huang DP, Johnson PJ.
Molecular prognostication of nasopharyngeal carcinoma by quantitative
analysis of circulating Epstein-Barr virus DNA. Cancer Res. 2000;60(24):6878–81.
Leung SF, Zee B, Ma BB, Hui EP, Mo F, Lai M, Chan KC, Chan LY, Kwan WH,
Lo YM, et al. Plasma Epstein-Barr viral deoxyribonucleic acid quantitation
complements tumor-node-metastasis staging prognostication in
nasopharyngeal carcinoma. J Clin Oncol. 2006;24(34):5414–8.
Tang LQ, Li CF, Li J, Chen WH, Chen QY, Yuan LX, Lai XP, He Y, Xu YX, Hu
DP, et al. Establishment and Validation of Prognostic Nomograms for
Endemic Nasopharyngeal Carcinoma. J Natl Cancer Inst. 2016;108(1).
Ong YK, Heng DM, Chung B, Leong SS, Wee J, Fong KW, Tan T, Tan EH.
Design of a prognostic index score for metastatic nasopharyngeal
carcinoma. Eur J Cancer. 2003;39(11):1535–41.
Chen HH, Chen IH, Liao CT, Wei FC, Lee LY, Huang SF. Preoperative
circulating C-reactive protein levels predict pathological aggressiveness in
oral squamous cell carcinoma: a retrospective clinical study. Clin
Otolaryngol. 2011;36(2):147–53.
Balkwill F, Mantovani A. Cancer and inflammation: implications for
pharmacology and therapeutics. Clin Pharmacol Ther. 2010;87(4):401–6.
Allin KH, Nordestgaard BG. Elevated C-reactive protein in the diagnosis,
prognosis, and cause of cancer. Crit Rev Clin Lab Sci. 2011;48(4):155–70.
Liu H, Chen QY, Guo L, Tang LQ, Mo HY, Zhong ZL, Huang PY, Luo DH, Sun
R, Guo X, et al. Feasibility and efficacy of chemoradiotherapy for elderly
patients with locoregionally advanced nasopharyngeal carcinoma: results
from a matched cohort analysis. Radiat Oncol. 2013;8:70.
Page 13 of 13
Submit your next manuscript to BioMed Central
and we will help you at every step:
• We accept pre-submission inquiries
• Our selector tool helps you to find the most relevant journal
• We provide round the clock customer support
• Convenient online submission
• Thorough peer review
• Inclusion in PubMed and all major indexing services
• Maximum visibility for your research
Submit your manuscript at
www.biomedcentral.com/submit