Prognostic and clinicopathological significance of circulating tumor cells detected by RT-PCR in non-metastatic colorectal cancer: A meta-analysis and systematic review
Bạn đang xem bản rút gọn của tài liệu. Xem và tải ngay bản đầy đủ của tài liệu tại đây (1.98 MB, 13 trang )
Yang et al. BMC Cancer (2017) 17:725
DOI 10.1186/s12885-017-3704-8
RESEARCH ARTICLE
Open Access
Prognostic and clinicopathological
significance of circulating tumor cells
detected by RT-PCR in non-metastatic
colorectal cancer: a meta-analysis and
systematic review
Chaogang Yang1†, Kun Zou2†, Liang Zheng1 and Bin Xiong1*
Abstract
Background: Circulating tumor cells (CTCs) have been accepted as a prognostic marker in patients with metastatic
colorectal cancer (mCRC, UICC stage IV). However, the prognostic value of CTCs in patients with non-metastatic
colorectal cancer (non-mCRC, UICC stage I-III) still remains in dispute. A meta-analysis was performed to investigate
the prognostic significance of CTCs detected by the RT-PCR method in patients diagnosed with non-mCRC patients.
Methods: A comprehensive literature search for relevant articles was performed in the EmBase, PubMed, Ovid, Web
of Science, Cochrane library and Google Scholar databases. The studies were selected according to predetermined
inclusion/exclusion criteria. Using the random-effects model of Stata software, version12.0 (2011) (Stata Corp, College
Station, TX, USA), to conduct the meta-analysis, and the hazard ratio (HR), risk ratio (RR) and their 95% confidence
intervals (95% CIs) were regarded as the effect measures. Subgroup analyses and meta-regression were also conducted
to clarify the heterogeneity.
Results: Twelve eligible studies, containing 2363 patients with non-mCRC, were suitable for final analyses.
The results showed that the overall survival (OS) (HR = 3.07, 95% CI: [2.05–4.624], P < 0.001; I2 = 55.7%,
P = 0.008) and disease-free survival (DFS) (HR = 2.58, 95% CI: [2.00–3.32], P < 0.001; I2 = 34.0%, P = 0.085)
were poorer in patients with CTC-positive, regardless of the sampling time, adjuvant therapy and TNM
stage. CTC-positive was also significantly associated with regional lymph nodes (RLNs) metastasis (RR = 1.62,
95% CI: [1.17–2.23], P = 0.003; I2 = 74.6%, P<0.001), depth of infiltration (RR = 1.41, 95% CI: [1.03–1.92], P = 0.03;
I2 = 38.3%, P = 0.136), vascular invasion (RR = 1.66, 95% CI: [1.17–2.36], P = 0.004; I2 = 46.0%, P = 0.135), tumor
grade (RR = 1.19, 95% CI: [1.02–1.40], P = 0.029; I2 = 0%, P = 0.821) and tumor-node-metastasis (TNM) stage(I, II
versus III) (RR = 0.76, 95% CI 0.71–0.81, P < 0.001; I2 = 0%, P = 0.717). However, there was no significant relationship
between CTC-positive and tumor size (RR = 1.08, 95% CI: [0.94–1.24], P = 0.30; I2 = 0%, P = 0.528).
(Continued on next page)
* Correspondence:
†
Equal contributors
1
Department of Gastrointestinal Surgery & Department of Gastric and
Colorectal Surgical Oncology, Zhongnan Hospital of Wuhan University; Hubei
Key Laboratory of Tumor Biological Behaviors & Hubei Cancer Clinical Study
Center, No.169 Donghu Road, Wuchang District, Wuhan 430071, China
Full list of author information is available at the end of the article
© The Author(s). 2017 Open Access This article is distributed under the terms of the Creative Commons Attribution 4.0
International License ( which permits unrestricted use, distribution, and
reproduction in any medium, provided you give appropriate credit to the original author(s) and the source, provide a link to
the Creative Commons license, and indicate if changes were made. The Creative Commons Public Domain Dedication waiver
( applies to the data made available in this article, unless otherwise stated.
Yang et al. BMC Cancer (2017) 17:725
Page 2 of 13
(Continued from previous page)
Conclusions: Detection of CTCs by RT-PCR method has prognostic value for non-mCRC patients, and CTC-positive was
associated with poor prognosis and poor clinicopathological prognostic factors. However, the prognostic value of CTCs
supports the use of CTCs as an indicator of metastatic disease prior to the current classification of mCRC meaning it is
detectable by CT/MRI.
Keywords: Circulating tumor cells, Non-metastatic colorectal cancer, RT-PCR, Prognosis, Meta-analysis
Background
Colorectal cancer (CRC) is the third most commonly diagnosed cancer and the fourth leading cause of cancerrelated death [1]. In China, CRC is ranked fourth in
morbidity and mortality among the gastrointestinal cancers [2]. Due to the difficulties of early diagnosis, a large
proportion of patients with CRC are undiagnosed until
an advanced stage. Due to the continuous improvement
of the treatment methods, decreasing CRC mortality
rates have been observed in a large number of countries
worldwide [3], especially for the patients with nonmetastatic colorectal cancer (non-mCRC, UICC I-III).
Unfortunately, the 5-year overall survival (OS) of nonmCRC patients is still low and approximately 25–50% of
patients with stage II-III CRC will experience recurrence
or distant metastasis after comprehensive treatment [4],
which is the main reason for studying the prognosis in
those patients. The mechanisms of recurrence and
metastasis of CRC are very complicated and remains unclear. Recurrence and metastasis may involve series of
cell biological behaviors, including circulating tumor
cells (CTCs), which have been gradually recognized to
play an important role in the process of distant metastasis, according to the “seed and soil theory” [5].
CTCs, which were defined as the “break away” cancer
cells in the peripheral blood (PB) of cancer patients,
were firstly proposed by Ashworth in1869 [6] and
further demonstrated by Engell in 1955 [7]. These cells,
which shed intermittently from the solid tumors, circulate in the bloodstream, and arrive at different positions,
are the main cause of distant metastases [8]. However,
the lower concentration of PB in the solid tumors, which
are confined to local growth [9, 10], makes it difficult to
detect in early CRC. During the past few decades, with a
variety of highly sensitive and specific diagnostic
approaches including reverse transcriptase-polymerase
chain reaction (RT-PCR), immunocytochemistry, flow
cytometry, and the CellSearch system, the efficiency of
detecting CTCs is increasing gradually. Encouraging
results from numerous studies have demonstrated that
the presence of CTCs was significantly associated with
poor prognosis of CRC patients. However, most large-scale data were collected from patients with mCRC [11,
12], there were only limited data on the significance of
CTC in patients with non-mCRC. In those studies, the
diagnostic method used to detect CTCs was
predominantly the CellSearch system [13–15], which is
the first and only method approved by the US Food and
Drug Administration (FDA) for evaluating the prognosis
of CRC patients [16]. However, while there are advantages of high specificity and reproducibility for CTC
detection, as a semi-automated system, CellSearch has
the disadvantages of moderate sensitivity and subjective
verification. Compared to CellSearch, RT-PCR has
higher sensitivity and is more objective for detection of
CTCs [17, 18]. Therefore, it has also been widely used
for the detection of CTCs for non-mCRC patients, and
the clinical utility has been demonstrated in several
studies. Shimada et al. reported that CTCs detection
with the RT-PCR method was correlated with tumor
metastasis and prognosis [19]. However, Kust et al.
showed that CTCs detected with RT-PCR had unfavorable prognostic significance for non-mCRC patients
[20]. Therefore, the prognostic role of CTC detection
with RT-PCR in non-mCRC is still controversial.
We performed a pooled analysis of published studies
to quantitatively and comprehensively summarize the
prognostic relevance of CTCs detected by RT-PCR in
patients with non-mCRC.
Methods
Search strategy
A literature search for relevant studies was performed
systematically from the EmBase, PubMed, Ovid, Web of
Science, Cochrane library and Google Scholar database
with key words “colorectal cancer”, “circulating tumor
cells” or “CTCs” and “polymerase chain reaction or
PCR” by two researchers (CG Yang and K Zou) independently (up to July, 2016). No time restriction was
imposed. In order to prevent missing relevant studies,
“related articles” function of PubMed and Google
Scholar were used to identify other potentially relevant
publications.
Inclusion and exclusion criteria
The inclusion criteria for our meta-analysis were: (1)
investigated the clinicopathological or prognostic significance of CTC detection in non-mCRC patients; (2) used
any form of RT-PCR for detecting CTCs; (3) hazard
ratio (HR) or a risk ratio(RR) with a 95% confidence
Yang et al. BMC Cancer (2017) 17:725
interval (95% CI) of OS or/and disease-free survival
(DFS) reported in the study or had sufficient data to calculate; (4) collected the samples from PB. Exclusion criteria were: (1) studies including mCRC patients; (2) the
number of patients was less than 20. (3) exclusion of letters, reviews, and articles published with non-English
language. (4) the study was redundant, based on the
same database or patient population as an included
study. To avoid the inclusion of redundant studies, all
the included studies were checked carefully, including
their authors, organizations, accrual period, and population of patients.
Data extraction and quality assessment
Two reviewers (CG Yang and K Zou) evaluated the quality of the included studies and extracted data independently. The following information was collected: first
author, year of publication, country, characteristics of
the study population (number, sex and age), TNM stage
(UICC), detection markers, adjuvant therapy, sampling
time (pre/intra/post-operation), rate of CTC positivity
rate, follow-up period, the HR and their associated
standard errors on prognostic outcomes (OS or/and
DFS). If the HRs and its 95% CI were not directly provided in the original articles, we used the method designed by Jayne F. Tierney [21] to calculate them from
the available data. In addition, when HRs were presented
by both univariate and multivariate analyses, the latter
ones were preferable because multivariate analyses also
considered possible confounding of exposure effects
[22]. The quality assessment was based on the
Newcastle-Ottawa Scale (NOS) criteria, which is recommended by the Cochrane Library for the cohort study,
score 5–9 is considered as high quality and 1–4 is low
quality [23]. The results of quality assessment and data
extraction were confirmed by two reviewers. Any disagreements about data extraction and quality assessment
were resolved by comprehensive discussion and were
checked by the third investigator.
Statistical analysis
Statistical analyses were implemented with Stata software, version 12.0 (2011) (Stata Corp, College Station,
TX, USA). The RR and HR were regarded as effect
measures for summarizing the clinicopathological and
prognostic significance of CTCs detected by RT-PCR
in non-mCRC. By convention, a HR >1 indicates a
poorer prognosis in the CTC-positive group in contrast with negative group and a RR > 1 implies CTCpositive be associated with a parameter. All statistical
values were reported with 95% confidence intervals
(95% CIs) and P value < 0.05 was considered statistically significant. To retain maximum information, we
added additional information into included study from
Page 3 of 13
original authors or excluded studies if the included
and excluded studies were based on the same
patients’ population and some information of interest
was reported in the excluded studies but not in the
included studies. All relevant studies were included in
the overall analysis. Subgroup analyses were performed based on the sampling time (pre/intra/postOP), TNM stage (II/III), adjuvant therapy (without/
post-OP chemotherapy) and detection markers (single/multiple). All data analyses used a random effects
model, because it provided more conservative
estimates and more tailored to multicenter studies in
which heterogeneity was usually present [24]. The
Cochrane’s Q statistic and I2 statistic were applied to
evaluate the heterogeneity among studies. P value < 0.01
for the Q statistic and/or I2 > 50% were considered
significant heterogeneity [25]. The I2 value indicated
the degree of heterogeneity. Potential heterogeneity
between-study was illustrated by forest plots. If
necessary, meta-regression was performed to explore the
potential source of heterogeneity. Lastly, we evaluated
potential publication bias by a funnel plot, which was further validated by the Egger [26] and Begg’s test [27].
Results
Baseline characteristics of the eligible studies
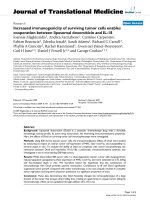
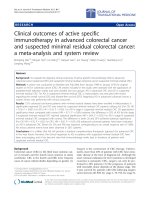
Initially, 206 relevant studies were identified in the systematic literature search process. By checking the titles and
abstracts, 164 studies were excluded and 42 potential
studies were retrieved. An additional 30 studies were then
excluded after they were fully reviewed because they
lacked sufficient data (2 studies), were redundant (2
studies), or included stage IV patients (26 studies). Finally,
12 studies were yielded as meeting our inclusion criteria
and were eligible for our meta-analysis (Fig. 1).
Twelve eligible studies, including 23 sets of data, contained 2363 patients with non-mCRC [19, 20, 28–37]. The
studies were conducted in seven countries (Australia,
China, Croatia, Germany, Japan, Spain and the UK) and
were published between 2002 and 2016. All studies detected tumor cells from PB with the molecular detection
method (PCR, RT-PCR, or RT followed by quantitative
PCR). Table 1 summarizes the main baseline characteristics and study design variables. The quality of the eligible
cohort studies was assessed with NOS and is summarized
in Table 2.
Effects of CTCs on OS and DFS for non-mCRC patients
Data on OS were available in 13 sets of data included
in eight studies [19, 20, 28–30, 33, 35, 36]. The pooled
analysis showed CTC-positive was significantly associated with a poor OS (HR = 3.07, 95% CI: [2.05–4.624],
P < 0.001), with significant between-study heterogeneity
(I2 = 55.7%, P = 0.008; Fig. 2a) in non-mCRC patients.
Yang et al. BMC Cancer (2017) 17:725
Page 4 of 13
[1.96–4.47], P < 0.001; HR = 3.59, 95% CI: [2.26–5.71],
P = 0.015; Fig. 3c. DFS, HR = 2.83, 95% CI: [1.92–
4.19], P < 0.001; HR = 3.19, 95% CI: [2.26–4.50], P <
0.001; Fig. 3d). For TNM stage, subgroup analyses
were only performed to explore the prognostic value of
CTCs for stage II and III CRC patients; the results demonstrated that CTC-positive was significantly associated with
poor OS (HR = 3.72, 95% CI: [2.36–5.85], P < 0.001;
HR = 2.94, 95% CI: [2.09–4.14], P < 0.001; Fig. 3e) and DFS
(HR = 2.77, 95% CI: [1.90–4.02], P < 0.001; HR = 3.00,
95% CI: [2.19–4.11], P < 0.001; Fig. 3f ) for both stage
II and III CRC patients.
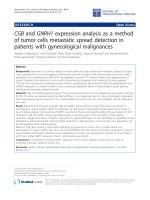
Association between CTCs and clinicopathological
parameters
Fig. 1 Flow chart showing the selection process for the included studies
Seventeen sets of data included in all enrolled studies
contained the data on DFS [19, 20, 28–37]; the
pooled analysis indicated CTC-positive was also associated with a significantly decreased DFS (HR = 2.58,
95% CI: [2.00–3.32], P < 0.001) with no between-study
heterogeneity (I2 = 34.0%, P = 0.085; Fig.
2b). To further investigate the effect of CTCs detection on the prognosis of non-mCRC patients under
different conditions, subgroup analyses were performed based on different sampling time (pre-OP and
intra/post-OP), TNM stage (II/III) and adjuvant therapy status (without/post-OP chemotherapy). The results demonstrated CTC-positive was significantly
associated with poor OS (HR = 3.65, 95% CI: [2.49–
5.36], P < 0.001; HR = 2.44, 95% CI: [1.19–4.99], P =
0.015; Fig. 3a) and DFS (HR = 3.08, 95% CI: [2.21–
4.31], P < 0.001; HR = 2.23, 95% CI: [1.50–3.29], P < 0.001;
Fig. 3b) in non-mCRC patients, regardless of pre-OP or
intra/post-OP sample collection. Furthermore, due to the
limited number of studies on about neoadjuvant radiotherapy or/and chemotherapy and post-OP adjuvant
radiotherapy in the included studies, we conducted a subgroup analysis to evaluate to prognostic value of CTCs in
patients who did and did not receive post-operative
chemotherapy. The results showed no difference between these two groups (OS, HR = 2.96, 95% CI:
Seven studies [19, 28, 29, 31, 35–37] including eight sets
of data were evaluated to determine the relationship
between CTC-positive and regional lymph nodes
metastasis. The results showed regional lymph nodes
metastasis was associated with CTC-positive (RR = 1.62,
95% CI: [1.17–2.23], P = 0.003) with significant betweenstudy heterogeneity (I2 = 74.6%, P<0.001; Fig. 4a). The
depth of tumor infiltration was associated with CTC-positive (RR = 1.41, 95% CI: [1.03–1.92], P = 0.03; I2 = 38.3%, P
= 0.136; Fig. 4b). Studies assessed by pooled analysis
showed significant association between CTC-positive and
vascular invasion (RR = 1.66, 95% CI: [1.17–2.36], P =
0.004; I2 = 46.0%, P = 0.135; Fig. 4c). Eight sets of data
from seven studies [19, 28, 29, 31, 35–37] demonstrated
that tumor grade was associated with CTC-positive (RR =
1.19, 95% CI: [1.02–1.40], P = 0.029; I2 = 0%, P = 0.821; Fig.
4d). Eight studies [19, 20, 28, 29, 31, 35–37] reported the
relationship between CTC-positive and TNM stage (I,
II versus III). As shown in Fig. 3e, CTC-positive in
stage III is greater than in stage I and II (RR = 0.76,
95% CI: [0.71–0.81], P < 0.001; I2 = 0%, P = 0.717; Fig.
4e). Furthermore, the pooled analysis found no significant relationship between CTC-positive and tumor
size (RR = 1.08, 95% CI: [0.94–1.24], P = 0.30; I2 = 0%, P =
0.528; Fig. 4f).
Exploring the sources of heterogeneity
To examine the intra-study inconsistencies on OS, we
stratified the eligible studies according to variables as
shown in Table 3. The pooled analyses results showed
the heterogeneity did not drop to an insignificant level,
regardless of the variables. Therefore, meta-regression
was further implied to explore the source of heterogeneity on OS. As shown in Table 4, for the studies on OS,
only positive rate of CTC detection was significantly
correlated with intra-study variability (P = 0.021), and it
explained 93.8% of the between-study variance in the
multivariate analysis.
Country
Croatia
China
China
China
Japan
Japan
Japan
Japan
Japan
Japan
Japan
Japan
Japan
Japan
Japan
Japan
China
UK
Article
Kust 2016 [33]
Liu 2013 [28]
Liu 2013 (1) [28]
Liu 2013 (2) [28]
Yokobori (1) 2013 [29]
Yokobori (2) 2013 [29]
Yokobori (3) 2013 [29]
Yokobori (4) 2013 [29]
Shimada (1) 2012 [19]
Shimada (2) 2012 [19]
Iinuma (1) 2011 [30]
Iinuma (1–1) 2011 [30]
Iinuma (1–2) 2011 [30]
Iinuma (2) 2011 [30]
Iinuma (2–1) 2011 [30]
Iinuma (2–2) 2011 [30]
Uen 2008 [31]
Barreto 2007 [32]
113(NR)
438(234/204)
Validation: 97(NR)
Validation: 143(NR)
Validation: 315(175/140)
Training:150(NR)
Training: 176(NR)
Training: 420(224/196)
86(47/39)
111(60/51)
Validation: 103(63/40)
Validation: 158(96/62)
Training: 131(75/56)
Training: 151(86/65)
51(NR)
41(NR)
92(60/32)
82(49/33)
Number (M/F)a
Table 1 Baseline characteristics of the included studies
Mean:67
NR
NR
NR
Mean:66.0 ± 12.4
NR
NR
Mean:66.0 ± 12.4
Median:68(27–82)
Median:68(27–82)
Mean:67.51 ± 11.08
Mean:67.51 ± 11.08
Mean:66.76 ± 11.02
Mean:66.76 ± 11.02
I-III
I-III
III
II
I-III
III
II
I-III
III
II
III
II
III
II
III
II
NRo
NR
I-III
I-III
TSd
Mean:66 ± 9.6
Mean:66 ± 9.6
Age Mean ± SDb/
Median (range) (yc)
CEA, CK20
CK19, CK20,
CEA, hTERT
CEA, CK19,
CK20, CD133
CEA, CK19,
CK20, CD133
CEA, CK19,
CK20, CD133
CEA, CK19,
CK20, CD133
CEA, CK19,
CK20, CD133
CEA, CK19,
CK20, CD133
CEA, CK19,
CK20, CD133
CEA, CK19,
CK20, CD133
PLS3
PLS3
PLS3
PLS3
CK20
CK20
CK20
CK20
Markers
Post-OP CT
for III and
part of II
Post-OP CT
for III and
part of II
Post-OP CT
Without
_
Post-OP CT
Without
_
Post-OP CT
Without
Post-OP CT
Without
Post-OP CT
Without
Post-OP CT
Without
Post-OP
(24 hq)
Post-OP
(1 Wp)
_
_
Post-OP
_
_
Post-OP
Post-OP
Post-OP
Pre-OP
Pre-OP
Pre-OP
Pre-OP
_
_
Pre-OP
Pre-OP
Post-OPk CTl
for III and
part of II
_
STe
Adjuvant
therapy
DFS
DFS
34
(30.09%)
OS
DFS
OS
DFS
OS
DFS
OS
DFS
OS
DFS
OS
DFS
OS
DFS
OS
DFS
OS
DFS
OS
DFS
OS
DFS
OS
DFS
OS
DFS
OS
DFS
OS
DFS
OSm
DFSn
OMg
137
(31.27%)
NR
NR
75
(23.81%)
NR
NR
106
(25.24%)
61
(70.93%)
63
(56.76%)
30
(29.12%)
35
(22.15%)
38
(29%)
33
(21.85%)
NR
NR
31
(25%)
22
(26.83%)
Rate
(+)f
Reported in text
Reported in text
Reported in text
Reported in text
Reported in text
Reported in text
Reported in text
Reported in text
Reported in text
Reported
in text
Reported in text
Reported in text
Reported in text
Reported in text
Reported in text
Reported in text
Reported in text
Data extrapolated
HRh estimate
Yes
Yes
Yes
Yes
Yes
Yes
Yes
Yes
Yes
Yes
Yes
Yes
Yes
Yes
Yes
Yes
Yes
Yes
CSi
Yes
Yes
Yes
Yes
Yes
Yes
Yes
Yes
Yes
Yes
Yes
Yes
Yes
Yes
Yes
Yes
Yes
No
MAj
Yang et al. BMC Cancer (2017) 17:725
Page 5 of 13
Germany
Australia
Japan
Spain
Japan
Koch 2006 [33]
Lloyd 2006 [34]
Sadahrio 2005 [35]
Bessa 2003 [36]
Ito 2002 [37]
99(62/37)
66 (23/43)
100(NR)
125 (74/51)
90(59/31)
Number (M/F)a
NR
Median:73
NR
Median:74 (43–95)
Mean:66.1
Age Mean ± SDb/
Median (range) (yc)
I-III
I-III
I-III
I-II
II
TSd
CEA
CEA
CEA
CK20, CEA,
EphB4,
LAMγ2, MAT
CK20
Markers
NR
Post-OP CT
for III and
part of II
NR
Without
Post-OP CT
for rectal
cancer
Adjuvant
therapy
Post-OP
Post-OP
Intra-OP
Pre-OP
Post-OP
STe
26
(26.26%)
36
(54.55%)
39
(39%)
5 (4%)
28
(31.1%)
Rate
(+)f
DFS
OS
DFS
OS
DFS
DFS
OS
DFS
OMg
Data extrapolated
Reported in text
Data extrapolated
Data extrapolated
Reported in text
HRh estimate
Yes
Yes
Yes
Yes
Yes
CSi
No
Yes
Yes
No
No
MAj
NOTE: aM/F Male/female, bSD Standard deviation, cY Year, dTS Tumor stage (UICC), eST Sampling time, fRate (+) Rate of CTCs-positive patients, gOM Outcome measured, hHR Hazard ratio, iCS Curative surgery,
j
MA Multivariance analysis, kOP Operation, lCT Chemotherapy, mOS Overall survival, nDFS Disease-free survival, oNR Not reported, pW Week, qh hour
Country
Article
Table 1 Baseline characteristics of the included studies (Continued)
Yang et al. BMC Cancer (2017) 17:725
Page 6 of 13
Yang et al. BMC Cancer (2017) 17:725
Page 7 of 13
Table 2 The assessment of the risk of bias in each Cohort study using the Newcastle-Ottawa Scale
Study
Kust 2016 [20]
Selection (0–4)
Comparability (0–2)
Outcome (0–3)
REC
SNEC
AE
DO
SC
AF
AO
FU
Total
AFU
0
1
1
1
0
0
0
1
0
4
Liu 2013 [28]
0
1
1
1
0
0
1
1
0
5
Yokobori 2013 [29]
1
1
1
1
0
0
1
1
0
6
Shimada 2012 [19]
1
1
1
1
0
0
1
1
1
7
Iimuna 2011 [30]
0
1
1
1
0
0
1
1
0
5
Uen 2008 [31]
0
1
1
1
0
0
1
1
0
5
Barreto 2007 [32]
0
0
1
1
0
0
1
1
0
4
Koch 2006 [33]
0
1
1
1
0
0
1
0
0
4
Lloyd 2006 [34]
0
0
1
1
0
0
1
0
0
3
Sadahrio 2005 [35]
1
1
1
1
0
0
1
1
1
7
Bessa 2003 [36]
0
1
1
1
0
0
1
1
0
5
Ito 2002 [37]
0
1
1
1
0
0
1
1
0
5
NOTE: REC representativeness of the exposed cohort, SNEC selection of the non-exposed cohort, AE ascertainment of exposure; DO: demonstration that outcome
of interest was not present at start of study, SC study controls for age, sex, AF study controls for any additional factors (chemoradiotherapy, curative resection), AO
assessment of outcome, FU follow-up long enough (36 M) for outcomes to occur, AFU adequacy of follow-up of cohorts (≥90%).Total: the points of each study
Publication bias
Potential publication bias was assessed by Begg’s and
Egger’s tests. P < 0.05 indicated the existence of publication bias. There was no evidence of publication bias for the
pooled analysis of OS (PBegg = 0.246, PEgger = 0.964) and
DFS (PBegg = 0.434, PEgger = 0.301). The funnel plots of publication bias on OS and DFS are shown in Fig. 5a and b,
respectively.
Discussion
Currently, the treatment strategies for non-mCRC
include radical surgery as well as neoadjuvant and
adjuvant radio-chemotherapy. In clinical practice, the
oncologist selects the most appropriate regiment
depending on the TNM stage, which is based on the
extent of tumor invasion (T), the presence of metastases
or micro-metastases in regional lymph nodes (N) and distant metastases (M) [38]. The clinical TNM stage, which
is based on the imaging examination, can help oncologists
assess whether neoadjuvant radio-chemotherapy should
be incorporated before surgery, whereas the pathological
TNM stage, which is based on the histopathologic examination of post-operative samples, provides information
on whether adjuvant radio-chemotherapy should be included after curative resection. Despite advances in therapeutic approaches, it is estimated that approximately 30%
of patients will develop metastases and eventually succumb to their disease after comprehensive treatment [39].
In general, the prognosis outcome of non-mCRC patients
is directed by the TNM-stage, which provides the
Fig. 2 Summary estimates of hazard ratio for overall survival and disease-free survival of patients with CTC positivity. a overall survival; b disease-free survival
Yang et al. BMC Cancer (2017) 17:725
Page 8 of 13
Fig. 3 Subgroup analyses. a&b Pre-operation and intra/post-operation on overall survival and disease-free survival, respectively; c&d Without and with postchemotherapy on overall survival and disease-free survival, respectively; e&f Stage II and stage III on overall survival and disease-free survival, respectively
prognostic information with approximately 93% 5-year
stage-specific survival rate for stage I, 84% for stage II,
and 83% for stage III [40] and is influenced by clinicopathological parameters such as vascular invasion, poor
differentiation, tumor size and serum tumor markers
(i.e., carcinoembryonic antigen, CEA). Recently, many
molecular biomarkers and high-risk gene signatures
have been demonstrated to provide further information
Yang et al. BMC Cancer (2017) 17:725
Page 9 of 13
Fig. 4 Summary estimates of risk ratio for clinicopathological parameters associated with CTCs-positive. a Regional lymph nodes metastasis;
b Depth of infiltration; c Vascular invasion; d Tumor grade; e TNM stage (Stage I, II vs. Stage III); f Tumor size
to support clinical decisions, however, none were conclusively accurate to evaluate the prognosis of all
patients.
Since CTCs were first identified in PB of CRC
patients, the clinical value of CTCs had become a debated topic throughout the medical community. From the
clinical perspective, CTC analyses has an advantage in
terms of a cost and ease of operation to serve as a monitoring tool pre and post treatments. Numerous studies had
demonstrated that CTCs detection could provide
important prognostic information for patients with CRC.
A previous meta-analysis by Groot et al. had demonstrated
the prognosis significance of detection of CTCs in patients
with mCRC [41]. Peach et al. reviewed the prognostic value
of postoperative detection of CTCs in non-mCRC patients
and concluded that the presence of CTCs in PB was an
independent predictor of recurrence [42]. However, the
two meta-analyses were limited by the presence of methodological heterogeneity; the included studies used several
different methods to detect CTCs and were not stratified
Yang et al. BMC Cancer (2017) 17:725
Page 10 of 13
Table 3 Results of subgroup analyses on OS
Variables
2
d
HR[95%CI]
Number
I
P
Yes
3.65[2.49–5.36]
6
0.00%
0.578
No
2.44[1.19–4.99]
7
72.90%
0.001
East Asia
3.39[2.27–5.05]
10
46.50%
0.051
Non-East Asia
2.10[0.52–8.54]
3
74.50%
0.02
Single
2.72[1.48–5.00]
9
66.80%
0.002
Multiple
3.77[2.62–5.43]
4
0.00%
0.799
Pre-op
3.65[2.49–5.36]
6
0.00%
0.578
Intra/post-op
2.44[1.19–4.99]
7
72.90%
0.001
Year > mediana
Country
Marker
Sampling time point
Patient no. > medianb
Yes
3.45[2.57–4.65]
6
0.00%
0.801
No
2.59[1.08–6.22]
7
74.20%
0.001
Detection rate > meanc
Yes
1.57[0.42–5.79]
4
74.10%
0.009
No
3.71[2.84–4.85]
9
0.00%
0.796
Low
4.06[1.64–10.05]
2
0.00%
0.384
High
2.95[1.87–4.65]
11
61.50%
0.004
Overall
3.07[2.05–4.62]
13
55.70%
0.008
Quality of study
NOTE: aThe median year for OS was 2012
b
The median patient no. for OS was 103
c
The mean detection rate for OS was 38.12%
d
Two-tailed P value of tests for heterogeneity
by detection method. With regard to the detection
methods of CTCs, the prognostic utility of the CellSearch
system in CRC patients had been demonstrated by a metaanalysis [43]. However, the clinical application of the RTPCR approach in the non-mCRC patients has still not been
illustrated by a large-scale data analysis.
This study is the first comprehensive meta-analysis to
validate the clinical significance of CTC detection by RTTable 4 Results of meta-regression on OS
Variables
Coef.a
Std. Err.b
P value
Adj R-squaredc
Year
0.5072
0.4559
0.2900
0.67%
Country
0.5352
0.5770
0.3740
1.08%
Marker
0.4133
0.5021
0.4280
−11.42%
Time point
−0.5072
0.4559
0.2900
0.67%
Patient no.
0.3751
0.4688
0.4410
−10.13%
Detection rate(mean)
−1.1526
0.4288
0.0210
93.80%
Quality of study
−0.3412
0.7123
0.6410
−12.93%
NOTE: aCoef.: coefficient
b
Std. Err.: standard Error
c
Adj R-squared: Proportion of between-study variance explained
PCR method only in non-mCRC. The results demonstrated that CTC-positive patients had poorer OS and
DFS than CTCs-negative patients at different sampling
time (pre-OP and intra/post-OP), TNM stage (II/III) and
adjuvant therapy status (without/post-OP chemotherapy),
indicating that the clinical prognosis of patients with
non-mCRC is significantly associated with the CTCs
detected by RT-PCR in PB. Our pooled analyses also
assessed the association between CTCs and clinicopathological parameters of non-mCRC patients and showed that
CTC-positive was correlated with regional lymph nodes
metastasis, deep depth of tumor infiltration, vascular invasion, poor differentiation of tumor and later TNM stage.
Moreover, all these parameters have been shown to be an
indicators of poor prognosis in CRC patients. Combined
with the results of our collective evaluation, CTC-positive
in PB has been demonstrated to be considered a prognostic and predictive marker for patients with non-mCRC.
Numerous studies have demonstrated that there was not
relationship between tumor size and the positivity of
CTCs detection [28, 35]; the results of our study were
consistent with these previous studies.
Although we limited the studies included in our metaanalysis to those that used RT-PCR to reduce the heterogeneity caused by the difference in detection methods,
no significant heterogeneity was found in the pooled
analysis of DFS (I2 = 34.0%, P = 0.085). Nevertheless,
there was still a certain extent of heterogeneity in our
meta-analysis. Especially for OS, heterogeneity was
mainly caused by data from the study by Shimada et al.
[19]. Heterogeneity may also come from differences in
the year, country and quality of publication, along with
differences in sampling time, detection marker, or detection rate. Differences in the experimental designs in the
cohort studies also generated non-negligible heterogeneity. To explore the potential sources of heterogeneity,
subgroup analyses were performed based on year, country and quality of publication, sampling time, marker,
number of patients, or detection rate, but the results
were inconclusive (Table 3). Further, the results of the
meta-regression clarified the heterogeneity and showed
the detection rate was mainly responsible for the heterogeneity on OS. The detection rate of CTCs was greatly
different based on different stage of early CRC. Stage I
was too low, however, and the CTC-positive rate was
significantly increased in stage III CRC patients, which
had already been confirmed in studies using the CellSearch system [14, 15].
Theoretically, the association between prognosis and
post-OP CTCs status was more convincing because
post-OP CTCs status contains pre-OP CTCs and released CTCs during the operation [44]. However, the
rapid apoptotic death of pre-OP CTCs may release mass
tumor genes or antigens due to the change of the
Yang et al. BMC Cancer (2017) 17:725
Page 11 of 13
Fig. 5 Publication bias analysis. a Funnel plot of the studies on overall survival; b Funnel plot of the studies on disease-free survival
survival microenvironment in the process of operation,
which might lead to a certain degree of detection bias.
Therefore, the samples of post-OP samples could more
accurately reflect the CTC status by including CTC
release, apoptosis, and necrosis and could provide
more information about the prognosis of patients.
Ikeguchi M et al. [45] found that in blood samples
collected within 48 h after the operation, patients
with CTC-positive had better prognosis than CTCsnegative patients. In our meta-analysis, the estimated
result for OS remained stable and was not significantly affected by sampling time, which indicated
CTCs detection not only at pre-OP but also post-OP
could provide a prognostic factor. Thus, uncertainties
still remain that sampling time could provide more
accurate prognostic information, and further studies
are needed to evaluate this relationship.
There were several limitations in our meta-analysis.
First, our data for the meta-analysis came from previously published studies, and several included studies
did not report HR. Therefore, we had to calculate
them from the reported data with limited access to
the raw data, which might affect the accuracy of the
results. Second, there was considerable heterogeneity
in our study. Although we eliminated the heterogeneity from detection methodology, RT-PCR cannot
achieve CTCs enumeration and lacks biologic specificity. However, it does have the advantage of high
sensitivity for CTCs detection [46]. We addressed the
between-study heterogeneity by using a random
effects model to obtain more conservative estimates.
Third, language selection brings bias. We restricted
the eligible studies to those written in English and
excluded the relevant studies of other languages
according to language criteria, which may cause language bias leading to an overestimation of effect sizes
[47]. Despite these limitations, our meta-analysis is
the first study to assess the prognostic significance of
CTCs detected by RT-PCR in non-mCRC patients.
Our results provides an example for other studies
that standardized testing method, optimized sampling
time, complete analysis and report of results should
be used to derive more accurate prognostic significance of CTCs in non-mCRC and CRC patients.
Conclusions
Based on available evidence, our meta-analysis suggested
that the detection of CTCs in PB by RT-PCR is a prognostic factor for patients with non-mCRC, and CTC-positive
was associated with poor prognosis and poor clinicopathological prognostic factors. However, the prognostic value
of CTCs supports the use of CTCs as an indicator of
metastatic disease prior to the current classification of
mCRC meaning it is detectable by CT/MRI. Further highquality, well-designed, large-scale multicenter studies are
required to evaluate the clinical significance and utility of
CTCs detected by RT-PCR in non-mCRC patients.
Abbreviations
CIs: Confidence intervals; CRC: Colorectal cancer; CT: Chemotherapy;
CTCs: Circulating tumor cells; DFS: Disease-free survival; HR: Hazard ratio;
mCRC: Metastatic CRC; non-mCRC: Non-metastatic CRC; OP: Operative;
OS: Overall survival; PB: Peripheral blood; RLNs: Regional lymph nodes;
RR: Relative risk; RT-PCR: Reverse-transcriptase polymerase chain reaction;
TNM: Tumor-node-metastasis
Acknowledgements
Not applicable
Funding
This work was supported by National Natural Science Foundation of China
(No. 81572874). The funding body was not involved in the design of the
study and collection, analysis, and interpretation of data and in writing the
manuscript.
Availability of data and materials
The datasets supporting the conclusions of this article are included within
the article.
Authors’ contributions
CY and KZ contributed equally to this work. CY, KZ, and BX were responsible
for conception and design of the study. CY and KZ did the studies selection,
data extraction, statistical analyses and writing of the manuscript. LZ
participated in studies selection and data extraction, and provided statistical
expertise. CY, KZ and LZ contributed to the literature search, studies
Yang et al. BMC Cancer (2017) 17:725
Page 12 of 13
selection, and figs. CY, KZ and ZW provided clinical expertise and
interpretation of data. The report was drafted, revised, and approved by all
investigators. All authors read and approved the final manuscript.
15.
Ethics approval and consent to participate
Not applicable
16.
Consent for publication
Not applicable
Competing interests
The authors declare that they have no competing interests.
17.
18.
Publisher’s Note
Springer Nature remains neutral with regard to jurisdictional claims in published
maps and institutional affiliations.
Author details
1
Department of Gastrointestinal Surgery & Department of Gastric and
Colorectal Surgical Oncology, Zhongnan Hospital of Wuhan University; Hubei
Key Laboratory of Tumor Biological Behaviors & Hubei Cancer Clinical Study
Center, No.169 Donghu Road, Wuchang District, Wuhan 430071, China.
2
Department of Oncology, Central Hospital of Wuhan, No.16 Gusaoshu Road,
Jianghan District, Wuhan 430014, China.
19.
20.
21.
22.
Received: 26 November 2016 Accepted: 25 October 2017
References
1. Torre LA, Bray F, Siegel RL, Ferlay J, Lortet-Tieulent J, Jemal A. Global cancer
statistics, 2012. CA Cancer J Clin. 2015;65(2):87–108.
2. Chen W, Zheng R, Baade PD, Zhang S, Zeng H, Bray F, Jemal A, Yu XQ, He J.
Cancer statistics in China, 2015. CA Cancer J Clin. 2016;66(2):115–32.
3. Edwards BK, Ward E, Kohler BA, Eheman C, Zauber AG, Anderson RN, Jemal
A, Schymura MJ, Lansdorp-Vogelaar I, Seeff LC, et al. Annual report to the
nation on the status of cancer, 1975-2006, featuring colorectal cancer trends
and impact of interventions (risk factors, screening, and treatment) to
reduce future rates. Cancer. 2010;116(3):544–73.
4. Hayashi M, Inoue Y, Komeda K, Shimizu T, Asakuma M, Hirokawa F,
Miyamoto Y, Okuda J, Takeshita A, Shibayama Y, et al. Clinicopathological
analysis of recurrence patterns and prognostic factors for survival after
hepatectomy for colorectal liver metastasis. BMC Surg. 2010;10:27.
5. Fidler IJ. The pathogenesis of cancer metastasis: the 'seed and soil'
hypothesis revisited. Nat Rev Cancer. 2003;3(6):453–8.
6. Ashworth T. A case of cancer in which cells similar to those in the tumours
were seen in the blood after death. Aust Med J. 1869;14(3):146–9.
7. Engell HC. Cancer cells in the circulating blood; a clinical study on the
occurrence of cancer cells in the peripheral blood and in venous blood
draining the tumour area at operation. Acta chirurgica Scandinavica
Supplementum. 1955;201:1–70.
8. Pantel K, Alix-Panabieres C. Circulating tumour cells in cancer patients:
challenges and perspectives. Trends Mol Med. 2010;16(9):398–406.
9. Tibbe AG, Miller MC, Terstappen LW. Statistical considerations for
enumeration of circulating tumor cells. Cytometry Part A. 2007;71(3):154–62.
10. Paterlini-Brechot P, Benali NL. Circulating tumor cells (CTC) detection: clinical
impact and future directions. Cancer Lett. 2007;253(2):180–204.
11. Seeberg LT, Waage A, Brunborg C, Hugenschmidt H, Renolen A, Stav I,
Bjornbeth BA, Brudvik KW, Borgen EF, Naume B, et al. Circulating tumor cells
in patients with colorectal liver metastasis predict impaired survival. Ann
Surg. 2015;261(1):164–71.
12. Aggarwal C, Meropol NJ, Punt CJ, Iannotti N, Saidman BH, Sabbath KD,
Gabrail NY, Picus J, Morse MA, Mitchell E, et al. Relationship among
circulating tumor cells, CEA and overall survival in patients with metastatic
colorectal cancer. Ann Oncol. 2013;24(2):420–8.
13. Sotelo MJ, Sastre J, Maestro ML, Veganzones S, Vieitez JM, Alonso V,
Gravalos C, Escudero P, Vera R, Aranda E, et al. Role of circulating tumor
cells as prognostic marker in resected stage III colorectal cancer. Ann Oncol.
2015;26(3):535–41.
14. Kuboki Y, Matsusaka S, Minowa S, Shibata H, Suenaga M, Shinozaki E,
Mizunuma N, Ueno M, Yamaguchi T, Hatake K. Circulating tumor cell (CTC)
count and epithelial growth factor receptor expression on CTCs as
23.
24.
25.
26.
27.
28.
29.
30.
31.
32.
33.
34.
35.
biomarkers for cetuximab efficacy in advanced colorectal cancer. Anticancer
Res. 2013;33(9):3905–10.
Bork U, Rahbari NN, Scholch S, Reissfelder C, Kahlert C, Buchler MW, Weitz J,
Koch M. Circulating tumour cells and outcome in non-metastatic colorectal
cancer: a prospective study. Br J Cancer. 2015;112(8):1306–13.
Zhe X, Cher ML, Bonfil RD. Circulating tumor cells: finding the needle in the
haystack. Am J Cancer Res. 2011;1(6):740–51.
Riethdorf S, Fritsche H, Muller V, Rau T, Schindlbeck C, Rack B, Janni W,
Coith C, Beck K, Janicke F, et al. Detection of circulating tumor cells in
peripheral blood of patients with metastatic breast cancer: a validation
study of the CellSearch system. Clin Cancer Res. 2007;13(3):920–8.
Allard WJ, Matera J, Miller MC, Repollet M, Connelly MC, Rao C, Tibbe AG,
Uhr JW, Terstappen LW. Tumor cells circulate in the peripheral blood of
all major carcinomas but not in healthy subjects or patients with
nonmalignant diseases. Clin Cancer Res. 2004;10(20):6897–904.
Shimada R, Iinuma H, Akahane T, Horiuchi A, Watanabe T. Prognostic
significance of CTCs and CSCs of tumor drainage vein blood in Dukes'
stage B and C colorectal cancer patients. Oncol Rep. 2012;27(4):947–53.
Kust D, Samija I, Kirac I, Radic J, Kovacevic D, Kusic Z. Cytokeratin 20 positive
cells in blood of colorectal cancer patients as an unfavorable prognostic
marker. Acta Clin Belg. 2016;71(4):235–43.
Tierney JF, Stewart LA, Ghersi D, Burdett S, Sydes MR. Practical methods
for incorporating summary time-to-event data into meta-analysis. Trials.
2007;8:16.
Smith T, Smith B, Ryan MA. Survival analysis using Cox proportional hazards
modeling for single and multiple event time data. In: Proceedings of the
twenty-eighth annual SAS users group international conference, SAS
Institute, inc, Cary, paper; 2003. p. 228–54.
Stang A. Critical evaluation of the Newcastle-Ottawa scale for the
assessment of the quality of nonrandomized studies in meta-analyses. Eur J
Epidemiol. 2010;25(9):603–5.
Schmidt FL, Oh IS, Hayes TL. Fixed- versus random-effects models in metaanalysis: model properties and an empirical comparison of differences in
results. The British journal of mathematical and statistical psychology. 2009;
62(Pt 1):97–128.
Higgins JP, Thompson SG. Quantifying heterogeneity in a meta-analysis.
Stat Med. 2002;21(11):1539.
Egger M, Davey Smith G, Schneider M, Minder C. Bias in meta-analysis
detected by a simple, graphical test. BMJ. 1997;315(7109):629–34.
Begg CB, Mazumdar M. Operating characteristics of a rank correlation test
for publication bias. Biometrics. 1994;50(4):1088–101.
Liu Y, Qian J, Feng JG, Ju HX, Zhu YP, Feng HY, Li DC. Detection of
circulating tumor cells in peripheral blood of colorectal cancer patients
without distant organ metastases. Cell Oncol. 2013;36(1):43–53.
Yokobori T, Iinuma H, Shimamura T, Imoto S, Sugimachi K, Ishii H, Iwatsuki
M, Ota D, Ohkuma M, Iwaya T, et al. Plastin3 is a novel marker for circulating
tumor cells undergoing the epithelial-mesenchymal transition and is
associated with colorectal cancer prognosis. Cancer Res. 2013;73(7):2059–69.
Iinuma H, Watanabe T, Mimori K, Adachi M, Hayashi N, Tamura J, Matsuda K,
Fukushima R, Okinaga K, Sasako M, et al. Clinical significance of circulating
tumor cells, including cancer stem-like cells, in peripheral blood for
recurrence and prognosis in patients with Dukes' stage B and C colorectal
cancer. J Clin Oncol. 2011;29(12):1547–55.
Uen YH, CY L, Tsai HL, FJ Y, Huang MY, Cheng TL, Lin SR, Wang JY.
Persistent presence of postoperative circulating tumor cells is a poor
prognostic factor for patients with stage I-III colorectal cancer after curative
resection. Ann Surg Oncol. 2008;15(8):2120–8.
Barreto G, Neve R, Shrikhande SV, Shukla PJ. Role of circulating tumour cells
in predicting recurrence after excision of primary colorectal carcinoma (Br J
Surg 2007; 94: 96-105). Br J Surg. 2007;94(5):644. author reply 644-645
Koch M, Kienle P, Kastrati D, Antolovic D, Schmidt J, Herfarth C, von Knebel
Doeberitz M, Weitz J. Prognostic impact of hematogenous tumor cell
dissemination in patients with stage II colorectal cancer. Int J Cancer. 2006;
118(12):3072–7.
Lloyd JM, McIver CM, Stephenson SA, Hewett PJ, Rieger N, Hardingham JE.
Identification of early-stage colorectal cancer patients at risk of relapse postresection by immunobead reverse transcription-PCR analysis of peritoneal
lavage fluid for malignant cells. Clin Cancer Res. 2006;12(2):417–23.
Sadahiro S, Suzuki T, Ishikawa K, Saguchi T, Maeda Y, Yasuda S, Makuuchi H,
Yurimoto S, Murayama C. Detection of carcinoembryonic antigen
messenger RNA-expressing cells in portal and peripheral blood during
Yang et al. BMC Cancer (2017) 17:725
36.
37.
38.
39.
40.
41.
42.
43.
44.
45.
46.
47.
Page 13 of 13
surgery does not influence relapse in colorectal cancer. Ann Surg Oncol.
2005;12(12):988–94.
Bessa X, Pinol V, Castellvi-Bel S, Piazuelo E, Lacy AM, Elizalde JI, Pique JM,
Castells A. Prognostic value of postoperative detection of blood circulating
tumor cells in patients with colorectal cancer operated on for cure. Ann
Surg. 2003;237(3):368–75.
Ito S, Nakanishi H, Hirai T, Kato T, Kodera Y, Feng Z, Kasai Y, Ito K, Akiyama S,
Nakao A, et al. Quantitative detection of CEA expressing free tumor cells in
the peripheral blood of colorectal cancer patients during surgery with realtime RT-PCR on a LightCycler. Cancer Lett. 2002;183(2):195–203.
Treanor D, Quirke P. Pathology of colorectal cancer. Clin Oncol. 2007;
19(10):769–76.
Sargent D, Sobrero A, Grothey A, O'Connell MJ, Buyse M, Andre T, Zheng Y,
Green E, Labianca R, O'Callaghan C, et al. Evidence for cure by adjuvant
therapy in colon cancer: observations based on individual patient data from
20,898 patients on 18 randomized trials. J Clin Oncol. 2009;27(6):872–7.
Gunderson LL, Jessup JM, Sargent DJ, Greene FL, Stewart A. Revised tumor
and node categorization for rectal cancer based on surveillance,
epidemiology, and end results and rectal pooled analysis outcomes. J Clin
Oncol. 2010;28(2):256–63.
Groot Koerkamp B, Rahbari NN, Buchler MW, Koch M, Weitz J. Circulating
tumor cells and prognosis of patients with resectable colorectal liver
metastases or widespread metastatic colorectal cancer: a meta-analysis. Ann
Surg Oncol. 2013;20(7):2156–65.
Peach G, Kim C, Zacharakis E, Purkayastha S, Ziprin P. Prognostic significance
of circulating tumour cells following surgical resection of colorectal cancers:
a systematic review. Br J Cancer. 2010;102(9):1327–34.
Huang X, Gao P, Song Y, Sun J, Chen X, Zhao J, Xu H, Wang Z. Metaanalysis of the prognostic value of circulating tumor cells detected with the
CellSearch system in colorectal cancer. BMC Cancer. 2015;15:202.
Weitz J, Kienle P, Lacroix J, Willeke F, Benner A, Lehnert T, Herfarth C, von
Knebel Doeberitz M. Dissemination of tumor cells in patients undergoing
surgery for colorectal cancer. Clin Cancer Res. 1998;4(2):343–8.
Ikeguchi M, Kaibara N. Detection of circulating cancer cells after a
gastrectomy for gastric cancer. Surg Today. 2005;35(6):436–41.
Wicha MS, Hayes DF. Circulating tumor cells: not all detected cells are bad
and not all bad cells are detected. J Clin Oncol. 2011;29(12):1508–11.
Pham B, Klassen TP, Lawson ML, Moher D. Language of publication
restrictions in systematic reviews gave different results depending on
whether the intervention was conventional or complementary. J Clin
Epidemiol. 2005;58(8):769–76.
Submit your next manuscript to BioMed Central
and we will help you at every step:
• We accept pre-submission inquiries
• Our selector tool helps you to find the most relevant journal
• We provide round the clock customer support
• Convenient online submission
• Thorough peer review
• Inclusion in PubMed and all major indexing services
• Maximum visibility for your research
Submit your manuscript at
www.biomedcentral.com/submit