MicroRNA-195 acts as an anti-proliferative miRNA in human melanoma cells by targeting Prohibitin 1
Bạn đang xem bản rút gọn của tài liệu. Xem và tải ngay bản đầy đủ của tài liệu tại đây (2.19 MB, 12 trang )
Cirilo et al. BMC Cancer (2017) 17:750
DOI 10.1186/s12885-017-3721-7
RESEARCH ARTICLE
Open Access
MicroRNA-195 acts as an anti-proliferative
miRNA in human melanoma cells by
targeting Prohibitin 1
Priscila Daniele Ramos Cirilo1,2,3, Luciana Nogueira de Sousa Andrade1, Bruna Renata Silva Corrêa2,4, Mei Qiao2,
Tatiane Katsue Furuya1, Roger Chammas1 and Luiz Otavio Ferraz Penalva2*
Abstract
Background: Melanoma is the most lethal type of skin cancer. Since chemoresistance is a significant barrier,
identification of regulators affecting chemosensitivity is necessary in order to create new forms of intervention.
Prohibitin 1 (PHB1) can act as anti-apoptotic or tumor suppressor molecule, depending on its subcellular localization.
Our recent data shown that accumulation of PHB1 protects melanoma cells from chemotherapy-induced cell death.
Lacking of post-transcriptional regulation of PHB1 could explain this accumulation. Interestingly, most of melanoma
patients have down-regulation of microRNA-195. Here, we investigate the role of miR-195, its impact on PHB1
expression, and on chemosensitivity in melanoma cells.
Methods: TCGA-RNAseq data obtained from 341 melanoma patient samples as well as a panel of melanoma cell lines
were used in an expression correlation analysis between PHB1 and predicted miRNAs. miR-195 impact on PHB1 mRNA
and protein levels and relevance of this regulation were investigated in UACC-62 and SK-MEL-5 melanoma lines by
RT-qPCR and western blot, luciferase reporter and genetic rescue experiments. Cell proliferation, cell-cycle analysis and
caspase 3/7 assay were performed to investigate the potential action of miR-195 as chemosensitizer in melanoma cells
treated with cisplatin and temozolomide.
Results: Analysis of the TCGA-RNAseq revealed a significant negative correlation (Pearson) between miR-195 and PHB1
expression. Moreover, RT-qPCR data showed that miR-195 is down-regulated while PHB1 is up-regulated in a collection
of melanoma cells. We demonstrated that miR-195 regulates PHB1 directly by RT-qPCR and western blot in melanoma
cells and luciferase assays. To establish PHB1 as a relevant target of miR-195, we conducted rescue experiments in which
we showed that PHB1 transgenic expression could antagonize the suppressive effect miR-195 on the proliferation of
melanoma cells. Finally, transfection experiments combined with drug treatments performed in the UACC-62 and SKMEL-5 melanoma cells corroborated miR-195 as potential anti-proliferative agent, with potential impact in sensitization of
melanoma cell death.
Conclusions: This study support the role of miR-195 as anti-proliferative miRNA via targeting of PHB1 in melanoma cells.
Keywords: Melanoma, microRNA-195, Prohibitin 1, Cisplatin, Temozolomide, Vemurafenib
* Correspondence:
Priscila Daniele Ramos Cirilo and Luciana Nogueira de Sousa Andrade
contributed equally for this work.
Roger Chammas and Luiz Otavio Ferraz Penalva supervised equally this work.
2
The University of Texas Health Science Center at San Antonio, Children’s
Cancer Research Institute, 7703 Floyd Curl Drive, San Antonio, TX 78229-390,
USA
Full list of author information is available at the end of the article
© The Author(s). 2017 Open Access This article is distributed under the terms of the Creative Commons Attribution 4.0
International License ( which permits unrestricted use, distribution, and
reproduction in any medium, provided you give appropriate credit to the original author(s) and the source, provide a link to
the Creative Commons license, and indicate if changes were made. The Creative Commons Public Domain Dedication waiver
( applies to the data made available in this article, unless otherwise stated.
Cirilo et al. BMC Cancer (2017) 17:750
Background
Melanoma is the most aggressive and lethal type of skin
cancer. It has been reported to be the fifth and seventh
most common cancer type in the US among men and
women, respectively [1]. The National Cancer Institute
estimates that 76,380 new cases of melanoma were diagnosed and about 10,000 people have died from this disease in the US in 2016. Most melanomas diagnosed at
stage 0-III are excised surgically, with lymph node management. However, unresectable stage III, IV and recurrent melanomas are treated with chemotherapy, targeted
therapy or immunotherapy [1].
Cutaneous melanoma is classified into four subtypes
based on the status of the most significant mutated
genes: BRAF, RAS, NF1, and Triple-WT (wild-type) [2].
About 50% of patients harboring a BRAF V600E mutation show good response rates (about 80%) after receiving targeted therapies such as vemurafenib (PLX-4032),
but the average duration of disease-free survival is less
than six months [3]. Immunotherapy has been used to
treat metastatic melanoma with significant improvement
in overall survival and progression-free survival compared
to chemotherapy [4]. Therapeutic strategies using conventional chemotherapy, alone or in combination with other
therapies, are under investigation to improve the efficacy
of treatment of metastatic melanoma [5, 6]. Better knowledge of the molecular mechanisms and signaling pathways associated with chemoresistance in melanoma is
necessary to design novel therapeutic strategies.
Melanoma arises from malignant transformation of melanocytes induced mainly by exposure to intense intermittent ultraviolet radiation, an optimal oxidative stress
microenvironment [7]. Thus, melanoma cells originate
under stress conditions, which favor their therapy-resistant
phenotype. Proteomic assays performed in our laboratory
have shown that melanoma cells exposed to high doses of
cisplatin (25 μM) induced accumulation of anti-apoptotic
molecules and proteins involved in the oxidative stress response, including Prohibitin 1 [8]. The human Prohibitin 1
gene (PHB1) is located on chromosome 17q21 and encodes PHB1, a highly conserved protein that is ubiquitously expressed in many cell types [9]. A growing body of
evidence indicates that the subcellular localization of PHB1
is a determinant of its function [10–12]. At the level of the
cell plasma membrane, PHB1 is a transmembrane adaptor
that activates downstream signal transduction. It has been
reported that C-RAF stabilization in the RAS-RAF-MEKERK pathway depends on PHB1 [13]. PHB1 may serve as a
novel druggable target in C-RAF-mediated vemurafenib
resistance since treatment with the natural compound
rocaglamide A disrupts the interaction between PHB1 and
C-RAF in melanoma cells [14]. In the nucleus, PHB1 regulates transcriptional activation, cell cycle and E2F function
[15]. In the mitochondrial inner membrane, PHB1 and
Page 2 of 12
PHB2 heterodimers are implicated in mitochondrial genome stabilization, mitochondrial morphology, oxidative
stress, and apoptosis [9, 16]. We observed PHB1 accumulation in the mitochondria and nucleus of melanoma cells
after high doses of cisplatin and demonstrated that PHB1
knockdown sensitizes melanoma cells to cisplatin-induced
cell death [8].
MicroRNAs (miRNAs) are important regulators of
gene expression, functioning via translation repression
and/or mRNA degradation (for review see [17]). Aberrantly expressed miRNAs have been shown to initiate or
drive the progression of cancer, acting as potential oncogenes or tumor suppressors in several tumor types, including melanoma [18, 19]. There is a growing body of
evidence that the involvement of miRNAs is crucial in the
progression of metastatic melanoma. Down-regulation of
miR-137 in melanoma was strongly associated with MITF
up-regulation, one of the most important gene involved
with melanoma risk (for review see [20]). MicroRNA-7,
for example, is downregulated in VemR A375 and MelCV melanoma cells, both resistant to vemurafenib. Reestablishment of miR-7 expression reverse this resistance by
targeting EGFR/IGF-1R/CRAF pathway [21]. Recently, Li
et al. [22] showed that microRNA-488-3p sensitizes malignant melanoma cells to cisplatin by targeting PRKDC
gene. Therefore, lacking of post-transcriptional mechanisms involved in drug resistance such as intrinsic tumor
down-regulation of miRNAs could induce up-regulation
of chemoresistance-related genes [23]. Here, we demonstrate that miR-195, a classical tumor suppressor in
many types of cancer, is down-regulated in melanoma
and directly regulates PHB1 expression. Moreover, miR195 mimics impact cancer related phenotypes and modulate drug response in melanoma cells.
Methods
Analysis of melanoma samples from the Cancer Genome
Atlas
The miRanda Database was used to generate a list of
miRNAs predicted to target PHB1. Data from The
Cancer Genome Atlas (TCGA) were used to evaluate
the expression of miR-195 and PHB1. We downloaded level 3 data of 341 matched mRNA-Seq and
miRNA-Seq tumor samples, as well as one normal
sample for each data set. Pearson correlation was
used to calculate pairwise correlations between PHB1
and miRNAs expression. Gene expression analyses
comparing melanoma samples with normal samples
were performed using EdgeR [24].
Cell lines
Human melanoma cell lines SK-MEL-5, SK-MEL-19,
SK-MEL-37, SK-MEL-147, UACC-62, WM35, WM793B,
WM1366, WM1552C, WM1617, Lox10, MZ2Mel, and
Cirilo et al. BMC Cancer (2017) 17:750
Human immortalized keratinocytes (HaCat) were maintained with DMEM (Gibco/Thermo Fisher Scientific,
Waltham, MA, USA) medium supplemented with 10%
fetal bovine serum (FBS) and antibiotics (10,000 units/
mL of penicillin and 10,000 μg/mL of streptomycin).
Human melanocytes (NGM) were maintained with
DMEM/F-12 medium supplemented with 20% FBS and
1% Human Melanocyte Growth Supplement (HMGS)
(LifeTechnologies/Thermo Fisher Scientific, Waltham,
MA, USA). HeLa cells were maintained with RPMI
medium supplemented with 10% FBS and antibiotics.
The sources of all cell lines used at this study are described in detail in Additional file 1: Table S1. UACC-62
and SK-MEL-5 were selected for functional assays since
these lines were isolated from metastatic melanoma and
are positive for the BRAF-V600E mutation [25]. Cells
were screened monthly for Mycoplasma contamination.
MicroRNAs mimics transfection
UACC-62 and SK-MEL-5 cells were transfected with
microRNA mimics using Lipofectamine RNAiMAX
transfection reagent (Invitrogen/Thermo Fisher Scientific,
Waltham, MA, USA). We used miRNA mimic Syn-hasmiR-195 (5′-TCCTTCATTCCACCGGAGTCTG-3′) (GE
Dharmacon, Lafayette, CO USA) and ALL STARS Negative control siRNA (QIAGEN, Hilden, Germany). PHB1
expression in melanoma cells was evaluated by quantitative real time polymerase chain reaction (RT-qPCR) and
western blot 48 h (24 h mimics plus 24 h of drugs) and
72 h (24 h mimics plus 48 h of drugs) after treatment,
respectively.
Page 3 of 12
agaTGCTGCTgaa…3′) using Pfu Turbo DNA polymerase
(2.5 U/μL) following the manufacturer’s instructions
(Stratagene, La Jolla, CA, USA). PHB1-ORF (819 bp) was
cloned into a pENTR223 cassette in an ORFExpress System (GeneCopoeia, Rockville, MD USA) and then into a
pcDNA3.1-nV5-DEST plasmid using the Gateway System
(Invitrogen/Thermo Fisher Scientific, Waltham, MA,
USA). Sanger sequencing confirmed all construct inserts.
Stable cell lines generation
UACC-62 cells stably expressing PHB1-ORF (Open
Reading Frame, without 5′ and 3’UTR) or pcDNA3.1EV (empty vector) (Invitrogen/Thermo Fisher Scientific,
Waltham, MA, USA) were generated by transfection
followed by G418 selection (Gibco/Thermo Fisher Scientific, Waltham, MA, USA) (0.8 mg/mL). Plasmid transfections were carried out using the Lipofectamine 3000
reagent (Invitrogen/Thermo Fisher Scientific, Waltham,
MA, USA). The PHB1 expression level was monitored
using immunoblotting assays.
Quantitative RT-PCR
Stable UACC-62 cells expressing PHB1 were reversely
transfected with four siRNAs (25 nM) sequences targeting PHB1 (Dharmacon, ON-TARGETplus SMARTpool
siRNA J-010530-05,-06,-07, and −08, Thermo Scientific)
using Lipofectamine RNAiMAX transfection reagent
(Invitrogen/Thermo Fisher Scientific, Waltham, MA,
USA). Negative control ON-TARGETplus Non-targeting
siRNA reagent (D-001810-01-05) was obtained from
Dharmacon. Endogenous and recombinant PHB1 expression were evaluated 72 h after siRNA transfections
and identified by immunoblotting assay.
After lysis with TRIzol® reagent (Invitrogen/Thermo
Fisher Scientific, Waltham, MA, USA), total RNA was
isolated from the aqueous phase upon mixing with
chloroform, precipitated with isopropanol, washed with
75% ethanol and re-suspended in nuclease-free water.
cDNA was synthesized using the High Capacity cDNA
Reverse Transcription Kit (Applied Biosystems/Thermo
Fisher Scientific, Waltham, MA, USA). Quantitative RTPCR for PHB1 (Fwd: 5′-GTGTGGTTGGGGAATTCA
TGTGG-3′; Rev.: 5′-CAGGCCAAACTTGCCAATGG
AC-3′), and endogenous control A-CTB (Fwd: 5′-CCT
GGCACCCAGCACAAT-3′; Rev.: 5′-GGGCCGGACT
CGTCATACT-3′) were carried out using SYBR Green
Master Mix (Applied Biosystems/Thermo Fisher Scientific, Waltham, MA USA). The miRNA-195 or RNU48
(endogenous control) transcripts were quantified using
TaqMan Small RNA assays (Applied Biosystems/Thermo
Fisher Scientific, Waltham, MA, USA). All reactions were
performed in an ABI 7500 Real Time PCR machine (Applied Biosystems/Thermo Fisher Scientific, Waltham, MA
USA) and data were acquired using the ABI SDS 2.0.1
software package and analyzed using the 2-ΔΔCt method.
Plasmids construction and site-directed mutation
Immunoblotting
A 852 bp (position 82–934) fragment of PHB1 3’UTR region (PHB1–3’UTR-WT) was synthesized by GeneArt
System (Invitrogen/Thermo Fisher Scientific, Waltham,
MA, USA) and sub-cloned into the pmirGLO DualLuciferase miRNA Target Expression vector (Promega,
Madison, WI USA) at NheI/XhoI restriction sites. Sitedirected mutation was performed in order to delete miR195 binding-site region (PHB1–3’UTR-del195–5′-…
After collection, cells were suspended and sonicated in
2xSDS Laemmli sample buffer. A 12% SDS-PAGE gel
with a 4% stacking gel was run in Tris-glycine- SDS buffer. A semi-dry transfer procedure onto a nitrocellulose
membrane was carried out. After transfer, the membrane
was blocked with Tris-buffered saline (TBS) with 1%
Tween-20 and 5% milk. Membranes were probed with a
goat polyclonal anti-Prohibitin 1 antibody (PHB1, 1:200,
siRNAs transfection
Cirilo et al. BMC Cancer (2017) 17:750
Santa Cruz, Santa Cruz, CA USA), mouse-V5 Tag Monoclonal antibody (V5-Tag, 1:4000, Invitrogen), mouse monoclonal anti-alpha Tubulin antibody (TUB, 1:2000, Sigma),
and monoclonal anti-beta-actin antibody (ACT-B, 1:2000,
Abcam, Cambridge, UK). Horseradish peroxidase (HRP)conjugated anti-Goat IgG antibody (1:6000) was used as a
secondary antibody for anti-PHB1 while HRP-conjugated
goat anti-mouse IgG antibody (Pierce) was used as a secondary antibody for anti-TUB and anti-ACT-B (for both
1:4000) and for anti-V5-Tag (1:8000). Proteins were detected using the electro-chemoluminescence FluorChem R
System (Protein Simple, San Jose, CA, USA).
Page 4 of 12
Caspase 3/7 apoptosis assay
A caspase 3/7 activity-based assay was performed for
apoptosis quantification. UACC-62 and SK-MEL-5 cells
were seeded in 96 well plates and reverse transfected
with either miR-195 or miRNA-control (10 nM). After
24 h, cells were exposed to cisplatin or temozolomide
(2.5 and 50 μM, respectively). After 48 h, the apoptosis
index was monitored in the supernatant using the
Caspase-Glo 3/7 Assay Reagent according to manufacturer’s instructions (Promega, Madison, WI, USA). Luciferase measurements were performed with the SpectraMax
M5 Multi-Mode Microplate Reader (Molecular Devices,
Sunnyvale, CA, USA).
Cell proliferation assay
Cell proliferation assay was conducted using UACC-62
and SK-MEL-5 cell lines seeded in 96-well plates
(3 × 10³ cells per well). Cells were reverse transfected
(RNAiMax) with miRNA-195/miRNA-control mimics
(10 nM). After 24 h, cells were treated with cisplatin
(2.5, 5.0 and 10 μM, SIGMA, Darmstadt, Germany),
temozolomide (50, 250 and 450 μM, SIGMA, Darmstadt, Germany) or DMSO 0.1% as vehicle. Forty-eight
hours after treatment, the nuclear counting per mm2 (%)
of treated cells was compared to the non-treated cells
(IncuCyte, Essen BioScience, Ann Arbor, MI, USA). For
miR-195-PHB1 antagonism studies, two clones of the
UACC-62 cell line overexpressing either ORF-PHB1 or
pcDNA3.1-EV were used. MicroRNA-195 or miRNAcontrol was transfected into stable each cell line. Nuclear
counting per mm2 was carried out daily for five days
after transfection using IncuCyte software and viability
of control (%) was calculated.
Cell death and cell cycle analysis
UACC-62 and SK-MEL-5 cells were seeded at 2 × 10⁵
cells per well in a 12 multiwell plate. Cells were reverse
transfected (RNAiMax) with miRNA-195/miRNA-control mimics (10 nM). After 24 h, cells were treated with
cisplatin (2.5 and 10 μM), temozolomide (50 and
250 μM) or DMSO 0.1%. After 48 h, cells were trypsinized, fixed in 70% ethanol and kept at −20 °C until analysis by flow cytometry (Attune® Acoustic Focusing
Cytometer, Applied Biosystems/Thermo Fisher Scientific,
Waltham, MA, USA). Cell death and cell cycle analysis
were performed by propidium iodide (PI) staining. PI incorporates stoichiometrically to DNA, allowing relative
quantitation of DNA content. Cell death analysis, indicated as hypodiploid cells (Sub-G1) and cell cycle distribution (G0/G1, S, and G2/M) analysis were performed using
the FlowJo v10 Cytometric Software algorithm (FlowJo
LLC, Ashland, Oregon, USA). The percentage of cell
death was expressed in bar graphs (GraphPad, La Jolla,
CA). Cell cycle distribution profiles were plotted in a
chart.
Dual-GLO luciferase assay
For the luciferase assays, 8 × 10³ HeLa cells were plated
24 h prior to plasmid transfection in a 96-well plate in
triplicate. 10 ng of each pmiR-GLO-3′-UTR-PHB1 or
pmiR-GLO-PHB1–3’UTR-del195 reporter vector were
mixed with 500 nM of each miRNA-195 or miRNAcontrol in 25 μL OptiMEM (Invitrogen/Thermo Fisher
Scientific, Waltham, MA USA). A 0.5 μL aliquot of Lipofectamine 2000 transfection reagent (Invitrogen/Thermo
Fisher Scientific, Waltham, MA USA) was added in 25 μL
OptiMEM. Mixes were combined and after formation of
the nucleic acid:lipid complex, the transfection solution
was overlaid onto the previously plated HeLa cells.
HeLa cells were selected for luciferase assays based
on their high transfection efficiency and reproducibility according to our previous experience [26, 27]. After incubation for 48 h, a HeLa cell extract was prepared using
the Reporter Lysis Buffer (Promega, Madison, WI, USA).
A 50 μL amount of Luciferase Assay Reagent (Promega,
Madison, WI USA) was added to 10 μL of cell lysate
and luminescence was measured with a GloMaxMulti + Microplate Multimode Reader (Promega,
Madison, WI, USA). Data were normalized by Firefly/
Renilla luciferase activity.
Statistical analysis
Statistical analyses were conducted using GraphPad
Prism Software v6.01 (GraphPad, La Jolla, CA). The
difference between two groups were analyzed by the
unpaired t test. The differences between three or more
groups were analyzed by ANOVA with Tukey’s multiple
comparisons test. A value of P ≤ 0.05 was considered to
be statistically significant.
Results
PHB1 expression is negatively correlated with miRNA-195
expression
To define regulators that could influence the expression
of PHB1 in melanoma, we looked into the miRanda
Database and identified 28 miRNAs with putative sites
Cirilo et al. BMC Cancer (2017) 17:750
in the PHB1 3’UTR region. Next, we conducted an expression correlation analysis. We identified 341 melanoma
samples (melanoma skin cancer type) in The Cancer Genome Atlas and examined mRNA-Seq and miRNA-Seq
data. We checked PHB1 and miRNAs expression levels in
control and tumor samples to determine which miRNAs
from the candidate list showed the strongest anticorrelation with PHB1. We calculated Pearson correlations between the fold-changes of PHB1 and each of the
miRNAs. Among the top three negatively correlated miRNAs, miRNA-195 caught our attention (Pearson’s
r = −0.23; P < 0.001, Fig. 1a). miR-195 acts as a classical
tumor suppressor miRNA in many tumor types and regulates anti-apoptotic molecules in drug resistance pathways
[28]. To corroborate the observed negative correlation, we
analyzed the gene expression levels of PHB1 and miR-195
in 12 melanoma cell lines compared to melanocytes
(NGM) (Fig. 1b). Taken together, these data indicate that
PHB1 up-regulation in melanoma could be due in part to
a decrease in miR-195 expression.
PHB1 expression is modulated by miRNA-195
To investigate whether miR-195 regulates directly PHB1
expression, UACC-62 and SK-MEL-5 melanoma cells
were transfected with miR-195 mimics or a miR-control.
After 24 and 48 h, cells were collected for mRNA and
protein quantification, respectively. PHB1 mRNA decreased by approximately 50% in UACC-62 and by 20% in
SK-MEL-5 cells upon miR-195 transfection (Fig. 2a and
Additional file 2: Figure S1A, P ≤ 0.0001 and P ≤ 0.01,
Page 5 of 12
respectively). PHB1 protein levels were decreased by approximately 50% and 30% in UACC-62 and SK-MEL-5
cells after miR-195 mimics transfection compared to miRcontrol (Fig. 2b and Additional file 2: Figure S1B, respectively). In addition, miR-195 is still up-regulated even
48 and 72hs after transfection (Fig. 2c and d and
Additional file 2: Figure S1C and D, respectively. To confirm that PHB1 is a direct target of miR-195, an 852 bp
fragment of the 3′-UTR of PHB1 containing the putative
miR-195 binding site was cloned (pmiR-GLO-PHB1–
3’UTR-WT) and a miR-195 binding site deletion clone
was prepared (pmiR-GLO-PHB1–3’UTR-del195) (Fig. 2e,
upper panel). A co-transfection experiment showed that
miR-195 decreased the expression of pmiR-GLO-PHB3’UTR-WT by approximately 40%, based on luciferase/
renilla activity (P ≤ 0.0001). Deletion of miR-195 binding
site in PHB1 3′ UTR decreased the regulation (P ≤ 0.05)
(Fig. 2e, lower panel). In fact, the deletion of miR-195
binding site in PHB 3′ UTR reduced drastically the effect
of miR-195 but did not completely abolished it. We
checked the sequence of PHB 3’UTR and identified another sequence that partially matches miR-195 seed sequence. It is possible that this site is weakly recognized by
miR-195 and contributes to the regulation.
PHB1 antagonizes the suppressive effect of miRNA-195
on cell proliferation
To determine the anti-proliferative effect of miR-195,
UACC-62 melanoma cells were transfected with either
miR-195 or miR-CTRL mimics (10 nM) and the
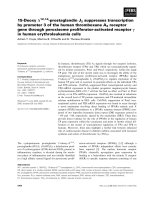
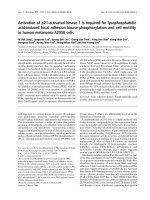
Fig. 1 MicroRNA-195 is down-regulated and PHB1 is up-regulated in patient and melanoma cell lines. a Scatter plot of the RNA Sequence data
(TCGA) of 341 samples from melanoma patients compared to normal skin samples. The red line indicates an inverse correlation of expression
between the samples for miR-195 and PHB1 genes (Pearson’s r = −0.23; P ≤ 0.001). b MicroRNA-195 is down-regulated (open columns down) and
PHB1 up-regulated (full columns up) in 12/12 melanoma cell lines evaluated by RT-qPCR compared to melanocytes (NGM cells) using 2(− ΔΔ Ct)
method. TCGA data are reported as means ± SD of relative quantification Log2 base values
Cirilo et al. BMC Cancer (2017) 17:750
Page 6 of 12
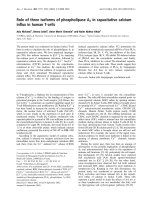
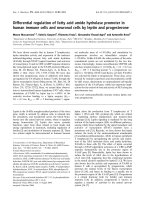
Fig. 2 MicroRNA-195 modulates PHB1 expression in melanoma cells and in a gene reporter assay. UACC-62 melanoma cells were transfected with
either miR-control/mir-195. miR-195 mimics transfection produced a significant reduction of PHB1 (P ≤ 0.0001) (a) mRNA and (b) protein levels
compared to miR-control. For RT-qPCR experiments, ACT-B mRNA was used as an endogenous control and the data were analyzed using the 2
(−ΔΔCt)
method; for immunoblotting ACT-B was also used as loading control. Protein quantification (fold-change based on the control) is indicated
above the blots. In (c) and (d) miR-195 levels 48 and 72 h after transfection, respectively. RNU48 was used as an endogenous control and the data
were analyzed using the 2 (−ΔΔCt) method. (e) Schematic representation of the PHB1–3’UTR region. pmiR-GLO-PHB1–3’UTR wild type (PHB1-WT)
was submitted to a mutagenesis assay to delete the miR-195 binding-site sequence (PHB1-del195). HeLa cells were transiently co-transfected with
either pmiR-GLO-PHB1–3’UTR-WT/pmiR-GLO-PHB1–3’UTR-del195 in the presence of miRNA-control/miR-195 mimics. After 48 h, Firefly and Renilla
luciferase activity was measured and normalized. Results shown that miR-195 decreased luciferase activity by about 40% (P ≤ 0.0001). Statistical
analysis was carried out using the unpaired t test and data are reported as means ± SD. Representative examples of at least three independent
experiments are reported. *P ≤ 0.05; ****P ≤ 0.0001
Cirilo et al. BMC Cancer (2017) 17:750
proliferative indices were plotted as a survival curve
for five days. Figure 3a shows the proliferation curve for
cells transfected with miR-CTRL, reaching a 90% proliferation rate at 120 h, while cells with miR-195 reached a
10% proliferation rate at the same time point. Similar
results were observed for SK-MEL-5 (Additional file 3:
Figure S2). To determine if this suppressive effect of
miR-195 takes place primarily via PHB1 inhibition, we
conducted rescue experiments. UACC-62 stable cells
containing a PHB1 open reading frame construct or
pcDNA3.1 empty vector (EV) were generated and transfected with mimics under the same conditions as described above. The stable expression of transgenic PHB1
was confirmed by immunoblotting (Additional file 4:
Figure S3). The proliferative index was plotted for 6.5 days
(Fig. 3b). UACC-62-EV cells and cells transfected with
Page 7 of 12
miR-CTRL reached the saturation density along 120 h
and showed a proliferation index of about 100% at the
160 h time-point (Fig. 3b). However, when these cells were
transfected with miR-195, the proliferation index decreased to 18–30%. In cells transfected with the open
reading frame (ORF) of PHB1, and therefore not susceptible to miR-195 inhibition, a different scenario was
observed. When miR-CTRL was transfected in ORFPHB1 expressing cells, the proliferation index reached
its maximum in 99 h (Fig. 3b), while miR-195 mimics
transfection produced a much less dramatic impact
on the proliferation index, which reached the maximum of 80% in 100 h (Fig. 3b). These results indicate that the anti-proliferative effect of miR-195
observed in melanoma cells was in great part due to
PHB1 regulation.
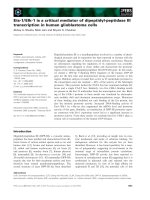
Fig. 3 PHB1 overcomes the anti-proliferative effect of miRNA-195. (a) Proliferation assay based on nuclear counting per mm2. UACC-62 melanoma
cells were transfected with either miR-control or miR-195 (25 nM) and observed for five days after transfection. (b) To conduct rescue experiments,
UACC-62 melanoma cells were stably expressing either ORF-PHB1 or pcDNA3.1-EV. Cells were then transfected with either miRNA-mimics control
or miR-195 mimics. After transfection, the proliferation rate was measured for six days and the results showed that cells transfected with transgenic
PHB1 overcome the suppressive effect of miR-195 (green line) compared to pcDNA3.1-EV cells (pink line). Representative examples of at least three
independent experiments are reported
Cirilo et al. BMC Cancer (2017) 17:750
Effect of miRNA-195 and drugs in melanoma cells
We tested if miRNA-195 mimics could potentially
sensitize melanoma cells to chemotherapy treatments.
First, we did a dose-response curve with increasing
doses of cisplatin (2.5, 5.0 and 10 μM) and temozolomide (50, 250 and 450 μM) in UACC-62 and SK-MEL-5
melanoma cells to determine the ideal drug dosage to be
used in the assays (data not shown). Then, we transfected both cell lines with either miR-control or miR195 mimics, expose them to cisplatin and temozolomide
and checked the impact on cell death. When cells were
treated with increasing doses of cisplatin or temozolomide, cell viability decreased in a dose-dependent manner for both cell lines and miR-195 seems to exert an
slightly additive effect combined with drugs on cell viability (Fig. 4a, b and Additional file 5: Figure S4A, B, respectively). Percentage of hypodiploid cells was used as
an indicator of cell-death (Sub-G1 population). Interestingly, hypodiploid cells were observed after miR-195
transfection in both UACC-62 (25%) and SK-MEL-5
(40%) cells; however, in the presence of either cisplatin
Page 8 of 12
and temozolomide, we did observe a significant increase
in cell death index in both cell lines transfected with
miR-195, suggesting an effect of miR-195 in melanoma
sensitivity to chemotherapy (Fig. 4c, d; Additional file 5:
Figure S4C, D, respectively). To check if miR-195 also
sensitizes melanoma cells to BRAF inhibitor (vemurafenib, PLX4032), we transfected UACC-62 melanoma cells
with miR-195 (25 nM) and treated with 1 μM and
10 μM PLX-4032 for 48 h. The results confirmed the
sensitizing role of miR-195 also to target therapy against
melanoma (Additional file 6: Figure S5). To confirm that
miR-195 induces cell death, we quantified caspase 3/7
activation. As observed in Fig. 4e, f and Additional file 5:
Figure S4E, F, miR-195 alone is sufficient to trigger
apoptosis and when cells were treated with cisplatin or
temozolomide, activation of apoptosis was induced.
Moreover, both cisplatin and temozolomide caused accumulation of UACC-62 and SK-MEL-5 cells in the G2/M
(Fig. 5b, d, Additional file 7: Figure S6B, D, respectively)
phase as already described in previous studies [29, 30].
We also observed an S-phase arrest when UACC-62 cells
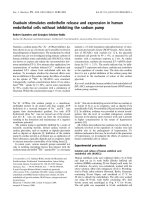
Fig. 4 MicroRNA-195 and drugs effect in UACC-62 melanoma cells. (a-b) Cell viability rate was calculated based on the proliferation index ratio
(%) of treated cells/not treated cells (control). Increasing doses of cisplatin (2.5, 5.0, and 10.0 μM) and temozolomide (50, 250, and 450 μM) were
tested. (c-d) FlowJo Cytometry Analysis software was used for hypodiploid cell quantification after propidium iodide staining. Cells were treated
with 2.5 and 5.0 μM cisplatin and 50 and 250 μM temozolomide drugs. (e-f) Apoptosis index based on caspase 3/7 activity was measured in a
luminometer. All results showed that miR-195 exerts a small effect in UACC-62 melanoma cells sensitization to cisplatin and temozolomide treatments.
All experimental data were obtained 24 h after miRNA-control/miR-195 (10 nM) transfection plus 48 h of drug exposure (total time 72 h). Statistical
analysis was carried out using ANOVA with multiple comparison test and are reported as means ± SD. Representative data of at least three
independent experiments are reported. NS: non-significant; **P ≤ 0.01;***P ≤ 0.001; **** P ≤ 0.0001
Cirilo et al. BMC Cancer (2017) 17:750
Fig. 5 Drug-induced cell death is accentuated by miR-195. This panel
shows the cell cycle profile of UACC-62 melanoma cells transfected
with either miRNA-control/miR-195 (10 nM) (24 h) and treated with
cisplatin (CIS-2.5 and 5 μM) or temozolomide (TMZ-50 and 250 μM) for
48 h (total time 72 h). The percentage of the cell population distributed
in each cell cycle phase is indicated: G0/G1 = blue, S = green, and G2/
M = pink. (a) MicroRNA-195 alone increased cell death (cells accumulated
at sub G0/G1). (b-e) Treatment with drugs induces mainly arrest of
UACC-62 cells in G2/M whereas the cytotoxic effects of cisplatin and
temozolomide were higher when combined with miR-195 transfection,
inducing cell death (sub G0/G1 cells population). Cell cycle distribution
of propidium iodide (PI)-labeled cells was analyzed using FlowJo
Cytometric software. Representative examples of at least three
independent experiments are reported
were treated with 5 μM cisplatin (Fig. 5c). Interestingly, in
the presence of miR-195, the cytotoxic effects of cisplatin
and temozolomide were even higher and, in this scenario,
cell death was not preceded by a cell cycle arrest at the
G2/M phase (Fig. 5, and Additional file 7: Figure S6).
Page 9 of 12
Discussion
We investigated the regulation of PHB1 by miR-195 and
its possible impact on chemoresistance of metastatic
melanoma cell lines harboring a BRAF-V600E mutation.
Prohibitin 1 is a molecule with multiple functions, most
of them involving the protection of cells from various
stresses [31]. These stresses are associated with mitochondrial dysfunction and can be involved in the etiology of cancers and/or their response to chemotherapy.
Fraser et al. (2003) described a hypothetical model of
chemoresistance in human ovarian cancer cells resistant
to cisplatin in which PHB1 accumulation in mitochondria impaired pro-caspase 9 activation and apoptosis
was suppressed [12]. Indeed, recent results from our laboratory have shown that PHB1 accumulates in mitochondria after stress induced by cisplatin in melanoma
cells [8]. Besides that, melanoma cells stably expressing
PHB1 were resistant to treatment with cisplatin and
temozolomide (Additional file 8: Figure S7). These results indicated that increased expression of PHB1 in this
context could be part of a protective response of cells,
which in turn could protect cells against cell death.
PHB1 is regulated by multiple post-translational modifications and its phosphorylation induces PI3K⁄Akt and
RAF⁄ERK pathways, as well as TGF-b cell signaling in
cancer cells (for review see [32]). In addition, pharmacological inhibition of PHB1/C-RAF by rocaglamides A
(RocA) inhibits RAS-ERK activation and blocks in vitro
and in vivo growth and metastasis of pancreatic and
melanoma cells [33]. However, the mechanisms of posttranscriptional regulation of PHB1 are not completely
understood.
Since the PHB1 transcript has an extremely long and
highly conserved 3’UTR, the case for regulation at the
post-transcriptional level is persuasive. Furthermore, the
presence of Single Nucleotide Polymorphisms (SNPs) in
the PHB1–3’UTR (SNP rs6917) region has been associated with an increased risk of breast cancer and melanoma, whereas the rare allele of this SNP was associated
with reduced PHB1 mRNA levels in gastric cancer
[34–36]. These SNPs could modulate the binding site
of regulatory elements such as microRNAs and regulate transcript decay [37].
MicroRNA-195 is down-regulated in melanoma cells
according to the TCGA database and shows a significant
negative expression correlation with PHB1. It is also
down-regulated in all melanoma cell lines we tested with
respect to melanocytes. miR-195 is located at 17p13.1
and belongs to the microRNA-15/16/195/424/497 family
[38]. miR-195 is described as a classical tumor suppressor in many tumors and down-regulation of the miR195/497 cluster could be explained by a hypermethylated
promoter region in hepatocellular carcinoma, breast cancer, gastric cancer, and glioblastoma [39–42]. Transfection
Cirilo et al. BMC Cancer (2017) 17:750
of miRNA-195 mimics down-regulates PHB1 mRNA and
protein levels in UACC-62 and SK-MEL-5. miR-195 has a
slightly sensitize effect in human melanoma cells to different doses of cisplatin and temozolomide. This was observed
with the occurrence of a decrease in cell viability and an
increase in hypodiploid cells and caspase 3/7 activation.
Previous studies have shown that ectopic expression of
miR-195 also sensitized glioblastoma, hepatocellular carcinoma, breast cancer, and colon tumor cells to temozolomide,
5-fluorouracil, adriamycin, and doxorubicin treatment by
targeting BCL2L-2, BCL-W, and RAF-1 genes, respectively
[23, 43–45]. Here, we determined that transgenic expression of PHB1 neutralizes the anti-proliferative effect of
miR-195, establishing PHB1 as relevant target gene. The
differences observed between the UACC-62 and SK-MEL-5
cell lines can be a result of genetic heterogeneity [25].
Conclusion
In summary, our results established miR-195-PHB1 as
important regulatory node. Lacking of miR-195 expression in melanoma patients seems to be one of the main
mechanisms of PHB1 accumulation in melanomas which
could decrease the efficacy of chemotherapy and even
target therapies like vemurafenib used in melanoma patients harboring BRAF V600E mutation. Evaluation of
miR-195 and PHB1 levels could help a better selection
and follow-up of patients for melanoma treatment.
Additional files
Additional file 1: Table S1. Sources of cell lines used at this study.
(DOCX 19 kb)
Additional file 2: Figure S1. MicroRNA-195 modulates PHB1 expression
in melanoma cells. SK-MEL-5 melanoma cells were transfected with either
miR-control/mir-195. miR-195 mimics transfection resulting in a reduction of
PHB1 (P ≤ 0.01) (a) mRNA and (b) protein levels compared to miR-control.
For RT-qPCR experiments, ACT-B mRNA was used as an endogenous control
and the data were analyzed using the 2 (−ΔΔCt) method; for immunoblotting
ACT-B was also used as loading control. Protein quantification (fold-change
based on the control) is indicated above the blots. In (c) and (d), miR-195
levels 48 and 72 h after transfection, respectively. RNU48 was used as an
endogenous control and the data were analyzed using the 2 (−ΔΔCt) method.
**P ≤ 0.01. (PNG 74 kb)
Additional file 3: Figure S2. miRNA-195 act as anti-proliferative microRNA
in melanoma cell. Proliferation assay based on nuclear counting per mm2. SKMEL-5 melanoma cells were transfected with either miR-control or miR-195
(10 nM) and observed for five days after transfection Representative examples
of at least three independent experiments are reported. (PNG 32 kb)
Additional file 4: Figure S3. UACC-62 stable cells expressing recombinant
ORF-PHB1. UACC-62 melanoma cells were stably selected by G418 antibiotic.
siRNA assays confirmed expression of recombinant PHB1. Endogenous PHB1
was used as positive control. Fold-change is indicated below the blots.
PHB1 = Prohibitin 1; TUB = beta-tubulin, nV5-Tag = N-terminal V5 epitope tag
for detection using Anti-V5 antibodies. (PNG 43 kb)
Additional file 5: Figure S4. MicroRNA-195 and drugs in SK-MEL-5
melanoma cells. (a-b) Cell viability rate was calculated based on the
proliferation index ratio (%) of treated cells/not treated cells (control).
Increasing doses of cisplatin (2.5, 5.0, and 10.0 μM) and temozolomide
(50, 250, and 450 μM) were tested. (c-d) FlowJo Cytometry Analysis
Page 10 of 12
software was used for hypodiploid cell quantification after propidium
iodide staining. Cells were treated with 2.5 and 5.0 μM cisplatin and 50
and 250 μM temozolomide drugs. (e-f) Apoptosis index based on caspase
3/7 activity was measured in a luminometer. All results showed that alone
miR-195 exerts a effect in SK-MEL-5 melanoma cells compared to cisplatin
and temozolomide treatments. All experimental data were obtained 24 h
after miRNA-control/miR-195 (10 nM) transfection plus 48 h of drug
exposure (total time 72 h). Statistical analysis were carried out using
ANOVA with multiple comparison test and are reported as means ± SD.
Representative data of at least three independent experiments are reported.
NS: non-significant; *P ≤ 0.05; **** P ≤ 0.0001. (PNG 514 kb)
Additional file 6: Figure S5. MicroRNA 195 and PLX-4032 effects in
UACC-62 melanoma cells. UACC-62 cells were transfected with either
miR-control/miR-195 (25 nM). After 24 h, cells were treated with 1 or
10 μM vemurafenib (PLX-4032) for 48 hs and cell death was determined
by flow cytometry after propidium iodide staining. Statistical analysis was
carried out using Two-Way ANOVA followed by Bonferroni post-test and
are reported by mean ± SD. Representative data of three independent
experiments are reported. ***P ≤ 0.001. (JPEG 222 kb)
Additional file 7: Figure S6. Drug-induced cell death is accentuated by
miR-195. This panel shows the cell cycle profile of SK-MEL-5 melanoma
cells transfected with either miRNA-control/miR-195 (10 nM) (24 h) and
treated with cisplatin (CIS-2.5 and 5 μM) or temozolomide (TMZ-50 and
250 μM) for 48 h (total time 72 h). The percentage of the cell population
distributed in each cell cycle phase is indicated: G0/G1 = blue, S = green,
and G2/M = pink. (a)-MicroRNA-195 alone increased cell death (cells
accumulated at sub G0/G1). (b-e) Treatment with drugs induces mainly
arrest of SK-MEL-5 cells in G2/M whereas the cytotoxic effects of cisplatin
and temozolomide were higher when combined with miR-195 transfection,
inducing cell death (sub G0/G1 cells population). Cell cycle distribution
of propidium iodide (PI)-labeled cells was analyzed using FlowJo Cytometric
software. Representative examples of at least three independent experiments
are reported. (JPEG 314 kb)
Additional file 8: Figure S7. PHB1 protects UACC-62 melanoma cells
of chemotherapy induced cell-death. UACC-62 melanoma cells stably
expressing either pcDNA3.1-EV or ORF-PHB1 were treated with cisplatin
(cis; 5 or 10 μM) or temozolomide (tmz; 50 or 250 μM) for 48 h. The
percentage of viable cells (a) and annexin V positive/PI negative cells (b)
were determined using Annexin V Conjugates for Apoptosis Detection kit
for flow cytometry (Life Technologies). Statistical analysis was carried out
using Two-Way ANOVA followed by Bonferroni post-test and are reported
by mean ± SD. Representative data of three independent experiments
are reported. ***P ≤ 0.001. (JPEG 62 kb)
Abbreviations
ACT-B: actin beta; CIS: cisplatin; FBS: Fetal bovine serum; HRP: Horseradish
peroxidase; IgG: immunoglobulin G; mimic: mimicking precursor of miR-195
that is double-stranded synthetic RNA oligonucleotide; miRNA: microRNA;
mRNA-Seq: RNA sequencing; NGM: human melanocytes; ORF: open reading
frame; PHB1: Prohibitin 1; PI: propidium iodide; RT-qPCR: quantitative real
time polymerase chain reaction; SDS-PAGE: stands for sodium dodecyl
sulfate - polyacrylamide gel electrophoresis; siRNA: small interfering RNA;
TBS: tris-buffered saline; TCGA: The Cancer Genome Atlas;
TMZ: temozolomide; TUB: tubulin
Acknowledgements
The results shown here are in part based upon data generated by the TCGA
Research Network: The authors thank Daniela B.
Zanatta for helping with pcDNA3.1-PHB-3’UTR cloning and vector mini-preparation
and Suzanne C. Burns for helping with cloning, mutagenesis assays and for critically
reading the manuscript. We thank Rita Ghosh for advice on the experimental
design and Lewis Joel Greene for critical reading of the manuscript.
Funding
This work was supported by FAPESP, Fundaỗóo de Amparo à Pesquisa do Estado
de São Paulo, Brazil under 2013/11721–0 and 2013/25483–4 fellowships (PDRC
and BRSC, respectively), and grants FAPESP 1998/14247–6 and CNPq-INCT
Redoxoma (RC). The funding bodies did not play any role in the design, analysis
and interpretation of data nor in the writing of the manuscript.
Cirilo et al. BMC Cancer (2017) 17:750
Availability of data and materials
The datasets analyzed during the current study are available in the GDC Data
Portal repository, There no
restrictions on the use of GDC data. All GDC data can be used in publications
or presentations ( />Authors’ contributions
Conception and design: PDRC, LNSA, RC, LOFP; Development of methodology:
PDRC, LNSA, BRSC, MQ; Acquisition of data: PDRC, LNSA, BRSC; Execution and
analysis of the RT-qPCR experiments data: PDRC and TKF; Writing, reviewing, and/
or revision of the manuscript: PDRC, LNSA, BRSC, RC, LOFP; Study supervision: RC,
LOFP. All authors read and approved the final manuscript.
Ethics approval and consent to participate
Not applicable.
Consent for publication
Not applicable.
Competing interests
The authors declare that they have no competing interests.
Publisher’s Note
Springer Nature remains neutral with regard to jurisdictional claims in published
maps and institutional affiliations.
Author details
1
Instituto do Câncer do Estado de Sóo Paulo, Centro de Investigaỗóo
Translacional em Oncologia, Laboratório de Oncologia Experimental, Av. Dr.
Arnaldo,251, São Paulo, SP CEP 01246-000, Brazil. 2The University of Texas
Health Science Center at San Antonio, Children’s Cancer Research Institute,
7703 Floyd Curl Drive, San Antonio, TX 78229-390, USA. 3Instituto Hermes
Pardini, Setor de Pesquisa e Desenvolvimento, Av das Naỗừes, 2448, Distrito
Industrial, Vespasiano, MG CEP 33200-000, Brazil. 4Instituto Sírio-Libanês de
Ensino e Pesquisa, Centro de Oncologia Molecular, Rua Prof. Daher Cutait, 69,
São Paulo, SP CEP 01308-060, Brazil.
Received: 28 December 2016 Accepted: 30 October 2017
References
1. Vennepureddy A, Thumallapally N, Motilal Nehru V, Atallah JP, Terjanian T.
Novel drugs and combination therapies for the treatment of metastatic
melanoma. J Clin Med Res. 2016;8:63–75.
2. Cancer Genome Atlas N. Genomic classification of cutaneous melanoma.
Cell. 2015;161:1681–96.
3. Chapman PB, Hauschild A, Robert C, Haanen JB, Ascierto P, Larkin J, Dummer
R, Garbe C, Testori A, Maio M, et al. Improved survival with vemurafenib in
melanoma with BRAF V600E mutation. N Engl J Med. 2011;364:2507–16.
4. Robert C, Long GV, Brady B, Dutriaux C, Maio M, Mortier L, Hassel JC,
Rutkowski P, McNeil C, Kalinka-Warzocha E, et al. Nivolumab in previously
untreated melanoma without BRAF mutation. N Engl J Med. 2015;372:320–30.
5. Lian B, Si L, Cui C, Chi Z, Sheng X, Mao L, Li S, Kong Y, Tang B, Guo J. Phase
II randomized trial comparing high-dose IFN-alpha2b with temozolomide
plus cisplatin as systemic adjuvant therapy for resected mucosal melanoma.
Clin Cancer Res. 2013;19:4488–98.
6. Tentori L, Lacal PM, Graziani G. Challenging resistance mechanisms to
therapies for metastatic melanoma. Trends Pharmacol Sci. 2013;34:656–66.
7. Lo JA, Fisher DE. The melanoma revolution: from UV carcinogenesis to a
new era in therapeutics. Science. 2014;346:945–9.
8. Tortelli Junior TC, de Godoy LMF, de Souza GA, Bonatto D, Otake AH, de
Freitas Saito R, Rosa JC, Greene LJ, Chammas R. Accumulation of prohibitin
is a common cellular response to different stressing stimuli and protects
melanoma cells from ER stress and chemotherapy-induced cell death.
Oncotarget. 2017;8:43114–129.
9. Peng YT, Chen P, Ouyang RY, Song L. Multifaceted role of prohibitin in cell
survival and apoptosis. Apoptosis. 2015;20:1135–49.
10. Patel N, Chatterjee SK, Vrbanac V, Chung I, CJ M, Olsen RR, Waghorne C,
Zetter BR. Rescue of paclitaxel sensitivity by repression of Prohibitin1 in
drug-resistant cancer cells. Proc Natl Acad Sci U S A. 2010;107:2503–8.
Page 11 of 12
11. Jiang L, Dong P, Zhang Z, Li C, Li Y, Liao Y, Li X, Wu Z, Guo S, Mai S,
et al. Akt phosphorylates Prohibitin 1 to mediate its mitochondrial
localization and promote proliferation of bladder cancer cells. Cell
Death Dis. 2015;6:e1660.
12. Fraser M, Leung B, Jahani-Asl A, Yan X, Thompson WE, Tsang BK.
Chemoresistance in human ovarian cancer: the role of apoptotic regulators.
Reprod Biol Endocrinol. 2003;1:66.
13. Rajalingam K, Rudel T. Ras-Raf signaling needs prohibitin. Cell Cycle. 2005;4:
1503–5.
14. Doudican NA, Orlow SJ. Inhibition of the CRAF/prohibitin interaction reverses
CRAF-dependent resistance to vemurafenib. Oncogene. 2017;36:423–8.
15. Wang S, Nath N, Adlam M, Chellappan S. Prohibitin, a potential tumor suppressor,
interacts with RB and regulates E2F function. Oncogene. 1999;18:3501–10.
16. DM S, Zhang Q, Wang X, He P, Zhu YJ, Zhao J, Rennert OM, YA S. Two
types of human malignant melanoma cell lines revealed by expression
patterns of mitochondrial and survival-apoptosis genes: implications for
malignant melanoma therapy. Mol Cancer Ther. 2009;8:1292–304.
17. Kuersten S, Radek A, Vogel C, Penalva LO. Translation regulation gets its
'omics' moment. Wiley Interdiscip Rev RNA. 2013;4:617–30.
18. Farazi TA, Spitzer JI, Morozov P, Tuschl T. miRNAs in human cancer. J Pathol.
2011;223:102–15.
19. Mirzaei H, Gholamin S, Shahidsales S, Sahebkar A, Jaafari MR, Mirzaei HR,
Hassanian SM, Avan A. MicroRNAs as potential diagnostic and prognostic
biomarkers in melanoma. Eur J Cancer. 2016;53:25–32.
20. Fattore L, Costantini S, Malpicci D, Ruggiero CF, Ascierto PA, Croce CM,
Mancini R, Ciliberto G. MicroRNAs in melanoma development and
resistance to target therapy. Oncotarget. 2017;8:22262–78.
21. Sun X, Li J, Sun Y, Zhang Y, Dong L, Shen C, Yang L, Yang M, Li Y, Shen G,
et al. miR-7 reverses the resistance to BRAFi in melanoma by targeting
EGFR/IGF-1R/CRAF and inhibiting the MAPK and PI3K/AKT signaling
pathways. Oncotarget. 2016;7:53558–70.
22. Li N, Ma Y, Ma L, Guan Y, Ma L, Yang D. MicroRNA-488-3p sensitizes malignant
melanoma cells to cisplatin by targeting PRKDC. Cell Biol Int. 2017;41:622–9.
23. Qu J, Zhao L, Zhang P, Wang J, Xu N, Mi W, Jiang X, Zhang C, Qu J.
MicroRNA-195 chemosensitizes colon cancer cells to the chemotherapeutic
drug doxorubicin by targeting the first binding site of BCL2L2 mRNA. J Cell
Physiol. 2015;230:535–45.
24. Robinson MD, McCarthy DJ, Smyth GK. edgeR: a bioconductor package for
differential expression analysis of digital gene expression data.
Bioinformatics. 2010;26:139–40.
25. Ikediobi ON, Davies H, Bignell G, Edkins S, Stevens C, O'Meara S, Santarius T,
Avis T, Barthorpe S, Brackenbury L, et al. Mutation analysis of 24 known
cancer genes in the NCI-60 cell line set. Mol Cancer Ther. 2006;5:2606–12.
26. Vo DT, Qiao M, Smith AD, Burns SC, Brenner AJ, Penalva LO. The oncogenic
RNA-binding protein Musashi1 is regulated by tumor suppressor miRNAs.
RNA Biol. 2011;8:817–28.
27. Vo DT, Abdelmohsen K, Martindale JL, Qiao M, Tominaga K, Burton TL,
Gelfond JA, Brenner AJ, Patel V, Trageser D, et al. The oncogenic RNAbinding protein Musashi1 is regulated by HuR via mRNA translation and
stability in glioblastoma cells. Mol Cancer Res. 2012;10:143–55.
28. He JF, Luo YM, Wan XH, Jiang D. Biogenesis of MiRNA-195 and its role in
biogenesis, the cell cycle, and apoptosis. J Biochem Mol Toxicol. 2011;25:404–8.
29. Siddik ZH. Cisplatin: mode of cytotoxic action and molecular basis of
resistance. Oncogene. 2003;22:7265–79.
30. Mhaidat NM, Zhang XD, Allen J, Avery-Kiejda KA, Scott RJ, Hersey P.
Temozolomide induces senescence but not apoptosis in human melanoma
cells. Br J Cancer. 2007;97:1225–33.
31. Jones DP. Radical-free biology of oxidative stress. Am J Physiol Cell Physiol.
2008;295:C849–68.
32. Mishra S, Ande SR, Nyomba BL. The role of prohibitin in cell signaling. FEBS
J. 2010;277:3937–46.
33. Luan Z, He Y, Alattar M, Chen Z, He F. Targeting the prohibitin scaffoldCRAF kinase interaction in RAS-ERK-driven pancreatic ductal
adenocarcinoma. Mol Cancer. 2014;13:38.
34. Jakubowska A, Rozkrut D, Antoniou A, Hamann U, Scott RJ, McGuffog L,
Healy S, Sinilnikova OM, Rennert G, Lejbkowicz F, et al. Association of PHB
1630 C>T and MTHFR 677 C>T polymorphisms with breast and ovarian
cancer risk in BRCA1/2 mutation carriers: results from a multicenter study. Br
J Cancer. 2012;106:2016–24.
35. Francisco G, Goncalves FT, Luiz OC, Saito RF, Toledo RA, Sekiya T, Tortelli TC
Jr, Violla ED, Furuya Mazzotti TK, Cirilo PD, et al. Polymorphisms in the
Cirilo et al. BMC Cancer (2017) 17:750
36.
37.
38.
39.
40.
41.
42.
43.
44.
45.
Page 12 of 12
p27kip-1 and prohibitin genes denote novel genes associated with
melanoma risk in Brazil, a high ultraviolet index region. Melanoma Res.
2013;23:231–6.
Leal MF, Cirilo PD, Mazzotti TK, Calcagno DQ, Wisnieski F, Demachki S,
Martinez MC, Assumpcao PP, Chammas R, Burbano RR, et al. Prohibitin
expression deregulation in gastric cancer is associated with the 3′
untranslated region 1630 C>T polymorphism and copy number variation.
PLoS One. 2014;9:e98583.
Haas U, Sczakiel G, Laufer SD. MicroRNA-mediated regulation of gene
expression is affected by disease-associated SNPs within the 3′-UTR via
altered RNA structure. RNA Biol. 2012;9:924–37.
Flavin RJ, Smyth PC, Laios A, O'Toole SA, Barrett C, Finn SP, Russell S, Ring M,
Denning KM, Li J, et al. Potentially important microRNA cluster on chromosome
17p13.1 in primary peritoneal carcinoma. Mod Pathol. 2009;22:197–205.
He XX, Kuang SZ, Liao JZ, CR X, Chang Y, YL W, Gong J, Tian DA, Guo AY,
Lin JS. The regulation of microRNA expression by DNA methylation in
hepatocellular carcinoma. Mol BioSyst. 2015;11:532–9.
Li D, Zhao Y, Liu C, Chen X, Qi Y, Jiang Y, Zou C, Zhang X, Liu S, Wang X, et
al. Analysis of MiR-195 and MiR-497 expression, regulation and role in breast
cancer. Clin Cancer Res. 2011;17:1722–30.
Deng H, Guo Y, Song H, Xiao B, Sun W, Liu Z, Yu X, Xia T, Cui L, Guo J.
MicroRNA-195 and microRNA-378 mediate tumor growth suppression by
epigenetical regulation in gastric cancer. Gene. 2013;518:351–9.
Lakomy R, Sana J, Hankeova S, Fadrus P, Kren L, Lzicarova E, Svoboda M,
Dolezelova H, Smrcka M, Vyzula R, et al. MiR-195, miR-196b, miR-181c, miR21 expression levels and O-6-methylguanine-DNA methyltransferase
methylation status are associated with clinical outcome in glioblastoma
patients. Cancer Sci. 2011;102:2186–90.
Ujifuku K, Mitsutake N, Takakura S, Matsuse M, Saenko V, Suzuki K, Hayashi K,
Matsuo T, Kamada K, Nagata I, et al. miR-195, miR-455-3p and miR-10a( *)
are implicated in acquired temozolomide resistance in glioblastoma
multiforme cells. Cancer Lett. 2010;296:241–8.
Yang X, Yin J, Yu J, Xiang Q, Liu Y, Tang S, Liao D, Zhu B, Zu X, Tang H, et al.
miRNA-195 sensitizes human hepatocellular carcinoma cells to 5-FU by
targeting BCL-w. Oncol Rep. 2012;27:250–7.
Yang G, Wu D, Zhu J, Jiang O, Shi Q, Tian J, Weng Y. Upregulation of miR195 increases the sensitivity of breast cancer cells to Adriamycin treatment
through inhibition of Raf-1. Oncol Rep. 2013;30:877–89.
Submit your next manuscript to BioMed Central
and we will help you at every step:
• We accept pre-submission inquiries
• Our selector tool helps you to find the most relevant journal
• We provide round the clock customer support
• Convenient online submission
• Thorough peer review
• Inclusion in PubMed and all major indexing services
• Maximum visibility for your research
Submit your manuscript at
www.biomedcentral.com/submit