Childhood cancer incidence by ethnic group in England, 2001–2007: A descriptive epidemiological study
Bạn đang xem bản rút gọn của tài liệu. Xem và tải ngay bản đầy đủ của tài liệu tại đây (1.69 MB, 11 trang )
Sayeed et al. BMC Cancer (2017) 17:570
DOI 10.1186/s12885-017-3551-7
RESEARCH ARTICLE
Open Access
Childhood cancer incidence by ethnic
group in England, 2001–2007: a descriptive
epidemiological study
Shameq Sayeed1, Isobel Barnes1 and Raghib Ali1,2*
Abstract
Background: After the first year of life, cancers are the commonest cause of death in children. Incidence rates vary
between ethnic groups, and recent advances in data linkage allow for a more accurate estimation of these
variations. Identifying such differences may help identify potential risk or protective factors for certain childhood
cancers. This study thus aims to ascertain whether such differences do indeed exist using nationwide data across
seven years, as have previously been described in adult cancers.
Methods: We obtained data for all cancer registrations for children (aged 0–14) in England from January 2001 to
December 2007. Ethnicity (self-assigned) was established through record linkage to the Hospital Episodes Statistics
database or cancer registry data. Cancers were classified morphologically according to the International
Classification of Childhood Cancer into four groups – leukaemias; lymphomas; central nervous system; and other
solid tumours. Age standardised incidence rates were estimated for each ethnic group, as well as incidence rate
ratios comparing each individual ethnic group (Indian, Pakistani, Bangladeshi, Black African, Black Carribean,
Chinese) to Whites, adjusting for sex, age and deprivation.
Results: The majority of children in the study are UK born. Black children (RR = 1.18, 99% CI: 1.01–1.39), and
amongst South Asians, Pakistani children (RR = 1.19, 99% CI: 1.02–1.39) appear to have an increased risk of all
cancers. There is an increased risk of leukaemia in South Asians (RR = 1.31, 99% CI: 1.08–1.58), and of lymphoma in
Black (RR = 1.72, 99% CI: 1.13–2.63) and South Asian children (RR = 1.51, 99% CI: 1.10–2.06). South Asians appear to
have a decreased risk of CNS cancers (RR = 0.71, 99% CI: 0.54–0.95).
Conclusions: In the tradition of past migrant studies, such descriptive studies within ethnic minority groups permit
a better understanding of disease incidence within the population, but also allow for the generation of hypotheses
to begin to understand why such differences might exist. Though a major cause of mortality in this age group,
childhood cancer remains a relatively rare disease; however, the methods used here have permitted the first
nationwide estimation of childhood cancer by individual ethnic group.
Keywords: Childhood cancer incidence, England, Ethnic minorities
* Correspondence:
1
Cancer Epidemiology Unit, University of Oxford, Richard Doll Building,
Oxford OX3 7LF, UK
2
Public Health Research Center, New York University Abu Dhabi , Abu Dhabi,
United Arab Emirates
© The Author(s). 2017 Open Access This article is distributed under the terms of the Creative Commons Attribution 4.0
International License ( which permits unrestricted use, distribution, and
reproduction in any medium, provided you give appropriate credit to the original author(s) and the source, provide a link to
the Creative Commons license, and indicate if changes were made. The Creative Commons Public Domain Dedication waiver
( applies to the data made available in this article, unless otherwise stated.
Sayeed et al. BMC Cancer (2017) 17:570
Background
In 2009, Cancer Research UK (CRUK) published Cancer
Incidence and Survival By Major Ethnic Group for
England 2002–2006 [1], linking incidence and mortality
data from cancer registries with (self-assigned) ethnicity
from the Hospital Episodes Statistics (HES) database.
This methodology allowed a much more accurate estimation of outcomes by ethnic group and confirmed differences in incidence and survival in many of the different
cancer types, with CRUK concluding that these differences
needed ‘investigating further and the analyses extended’.
We have since published a series of papers to do that
by looking more closely at individual ethnic groups and
their differences in cancer incidence. South Asians and
Blacks are not homogenous groups, with the subgroups
within these broad categorisations having differing religious, social and cultural practices. We thus analysed
cancer incidence in gastrointestinal [2], haematological
[3], thyroid [4], breast and gynaecological [5], urological
[6] and CNS [7] malignancies nationwide, looking
individually at the difference between British Indians,
Pakistanis, Bangladeshis (‘South Asians’), Black Africans,
Black Carribeans (‘Blacks’) and Whites. These consistently
show differences in incidence between the ethnic groups
in many cancers; interestingly, they also suggest that these
differences – between British Whites and ethnic minorities - can become less marked in some cancers over time
[2], in keeping with previous studies in migrant populations [8] and suggesting possible environmental risk and
protective factors where such patterns are observed over
the space of a few generations.
Whilst some of these differences can be accounted
for through known risk factors, there are many for
which we do not currently have any good explanation.
Thus, accurately confirming these ethnic differences
(and related outcomes) through linked data, and using
self-assigned ethnicity as the current most accurate
measure of ethnicity [9, 10], allows not only for targeted public health spending and interventions, but is
also a first step in attempting to identify potentially
modifiable risk factors.
Beyond the first year of life, cancer is the commonest cause of death in childhood (ages 0–14) in
England and Wales [11]. Whilst the CRUK report did
not study this, here we consider for the first time the
nationwide data for childhood cancer (2001–2007),
using self-assigned ethnicity data and widening the
analysis to include all of the above mentioned ethnic
subgroups.
Methods
The methods used in this study were broadly the same
as those described in our previous studies [2–7, 12].
Page 2 of 11
Data collection
The National Cancer Intelligence Network (NCIN)
provided data for all cancer registrations from January
2001 to December 2007 in residents of England aged 0
to 14 years old. For each registration, the following
information was given: cancer site coded to the
International Classification of Diseases, 10th Revision
(ICD-10) [13]; morphology coded to the International
Classification of Diseases of Oncology, 2nd and 3rd Revisions (ICD-O-2 and ICD-O-3) [14, 15]; deprivation
assessed from the income domain of the Index of Multiple
Deprivation 2007 (IMD 2007) [16]; age at diagnosis
of cancer; sex and ethnicity. We used the mid-year
population estimates produced by the Office of
National Statistics (ONS) from 2001 to 2007,
stratified by age, sex and ethnicity. Population data
stratified by national quintiles of the income domain
were provided by ONS based on the 2001 census
and the same distributions applied to population
data by age, sex and ethnicity for the 2001–2007
mid-year population estimates.
Classification of ethnicity
NCIN obtained the self-assigned ethnicity for each cancer registration by record linkage to the HES database. If
a cancer registration could not be linked or if ethnicity
was missing on the HES database, then ethnicity was
assigned using the cancer registry data. Prior to April
2001, ethnicity was classified by HES and the cancer
registries according to the codes used in the 1991 census. After April 2001, the codes were amended to those
used in the 2001 census, although 1991 ethnicity codes
were accepted until 2003. For the analyses presented in
this paper, ethnicity was classified as White (White from
the 1991 Census and White British from the 2001
Census), Indian, Pakistani, Bangladeshi (with the three
groups combined to form the category of ‘South Asian’),
Black African, Black Caribbean (again both combined to
form the category ‘Black’) and Chinese.
Classification of cancers
We used morphology to classify cancers according to
the International Classification of Childhood Cancer
(ICCC-3) [17]. To do this we converted ICD-O codes
from the second to third edition as necessary. As in previous studies [18], we classified cancers into four groups
corresponding to the diagnostic groups I, II, III and IVXII of the ICCC-3. These groups are respectively:
leukaemias and myloproliferative and myelodysplastic
diseases; lymphomas and reticuloendothelial neoplasms;
central nervous system and intracranial and intraspinal
neoplasms; and other solid tumours.
Sayeed et al. BMC Cancer (2017) 17:570
Page 3 of 11
Statistical analyses
We estimated age standardized rates (ASRs) of cancer
per 100,000 person-years for all ethnic groups using direct standardization to the 1960 Segi world population
[19], with age at diagnosis of cancer being classified into
three categories: 0–4, 5–9, and 10–14 years. We used
Poisson regression to estimate incidence rate ratios
(IRRs) comparing each ethnic group (and the two
combined groups, South Asians and Blacks) to Whites
adjusting for sex, age and deprivation.
When comparing South Asians and Blacks to Whites, we
present results as IRRs and 99% confidence intervals (CIs).
When comparing the individual ethnic groups, results are
presented as IRRs and 99% floating confidence intervals
(FCIs). FCIs were calculated using the method of floating
absolute risks [20, 21] and enable valid comparisons between
any two ethnic groups, even if neither one is the baseline.
We calculated 99% CIs because of multiple tests performed
across ethnic groups. Tests of heterogeneity of IRRs between
ethnicities, either overall or restricted to South Asians or
Blacks, were performed using likelihood χ2 ratio tests.
We performed pre-specified subgroup analyses by sex.
Tests of heterogeneity of IRRs between subgroups were
performed for South Asians, Blacks and Chinese using a
χ2 contrast test.
Because ethnicity information was not complete for all
registered cancers, we performed a sensitivity analysis
using multiple imputations of the missing ethnicity
values based on age, sex, income and site of cancer.
We performed all analyses using Stata V.12 and R
statistical software packages [22, 23].
Graphical presentation of results
Where results are presented in the form of plots, we
represent IRRs for each ethnic group by squares and
their corresponding 99% FCIs by straight lines. For the
combined South Asian and Black groups, we show IRRs
as open diamonds, whose horizontal extent indicates the
99% CI. We placed dashed vertical lines at the value of
the IRRs for South Asians and Blacks.
Results
Demographic information for children in England from
the 2001 Census is presented in Table 1. The total childhood population in England was 9,277,814 of which the
majority (84.2%) were White.
There is a greater proportion of older children
amongst Whites, Indians, Black Carribeans and Chinese,
with the reverse being seen in Pakistanis, Bangladeshis
and Black Africans. Levels of deprivation also differed
with the majority of Pakistanis, Bangladeshis, and Blacks
having low incomes and the remaining ethnic groups
being mostly middle or high income.
The majority of children were UK born, though the
proportion varies between different ethnic groups from
68% in Black Africans to 93% in Black Carribeans and
Indians.
Table 1 Comparison of demographics for children from major ethnic groups within the UK
Ethnic group
White
N
Indian
(%)
N
Pakistani
(%)
N
(%)
Bangladeshi
Black African
Black
Caribbean
Chinese
N
N
N
N
(%)
(%)
(%)
Other
Ethnicity
(%)
N
(%)
Census data for 2001
Total
population
7,812,159 (84.2) 218,508 (2.4)
232,507 (2.5)
99,713 (1.1)
136,170 (1.5)
106,616 (1.1)
36,523 (0.4)
635,618 (6.9)
Sex
Male
4,005,190 (51.3) 111,778 (51.2) 118,661 (51.0) 50,691 (50.8) 68,602
(50.4) 53,423
(50.1) 18,507 (50.7) 324,055 (51.0)
Female
3,806,969 (48.7) 106,730 (48.8) 113,846 (49.0) 49,022 (49.2) 67,568
(49.6) 53,193
(49.9) 18,016 (49.3) 311,563 (49.0)
0–4
2,416,850 (30.9) 67,805
(31.0) 83,949
(36.1) 36,154 (36.3) 50,484
(37.1) 32,135
(30.1) 10,356 (28.4) 228,505 (36.0)
5–9
2,638,626 (33.8) 71,642
(32.8) 76,931
(33.1) 32,206 (32.3) 46,081
(33.8) 35,661
(33.4) 11,345 (31.1) 210,037 (33.0)
10–14
2,756,683 (35.3) 79,061
(36.2) 71,627
(30.8) 31,353 (31.4) 39,605
(29.1) 38,820
(36.4) 14,822 (40.6) 197,076 (31.0)
Low
1,557,414 (19.9) 81,580
(37.3) 158,961 (68.4) 75,330 (75.5) 87,592
Middle
4,622,489 (59.2) 113,946 (52.1) 66,152
(28.5) 22,574 (22.6) 44,348
High
1,632,256 (20.9) 22,982
(3.2)
Age
Deprivation
(10.5) 7394
1809
(1.8)
4230
(64.3) 60,267
(56.5) 9023
(32.6) 43,320
(40.6) 20,051 (54.9) 314,577 (49.5)
(3.1)
3029
(2.8)
7449
(24.7) 221,578 (34.9)
(20.4) 99,463
(15.6)
Country of birth: *
UK
*
202,371 (92.6) 211,770 (91.1) 88,068 (88.3) 92,266
(67.8) 99,095
(92.9) 28,963 (79.3) .
.
Other
*
16,137
(32.2) 7521
(7.1)
.
*Data unavailable
*
(7.4)
20,737
(8.9)
11,645 (11.7) 43,904
7560
(20.7) .
Sayeed et al. BMC Cancer (2017) 17:570
Page 4 of 11
Table 2 Number of cases and distribution of cancers across ethnic groups
White
Indian
Pakistani
Bangladeshi
Black
African
Black
Caribbean
Chinese
All other
ethnicities
No ethnicity
recorded
Total
N
N
N
N
N
N
N
N
N
(%)
N
Leukaemias
2329
72
115
34
35
28
10
376
224
(7.0)
3223
Lymphomas & reticuloendothelial
neoplasms
761
34
33
13
37
4
2
138
137
(11.8)
1159
CNS & intracranial & intraspinal
neoplasms
1694
46
38
7
36
30
3
255
234
(10.0)
2343
Other solid tumors
2739
49
91
26
84
37
25
425
459
(11.7)
3935
All cancers
7523
201
277
80
192
99
40
1194
1054
(9.9)
10,660
Comparing cancer incidence between ethnic groups
The total number of cancers in each ethic group is presented in Table 2, and analyses comparing the relative
frequency (rates) of these cancers by ethnic group are
presented graphically (see Figures).
Leukaemias, then CNS cancers were the commonest
in most ethnic groups except in Black Africans who had
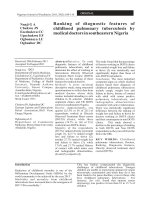
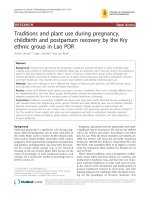
Fig. 1 All cancers by ethnicity and sex
a similar absolute number of leukaemias, lymphomas
and CNS cancers.
All analyses (Figures) are relative to Whites as the
baseline group.
For all cancers (Fig. 1), there was little difference in risk
between South Asians and Whites. However, there was
strong evidence of heterogeneity within the group with
Sayeed et al. BMC Cancer (2017) 17:570
Pakistanis at greater risk than Indians or Bangladeshis (RRs
of 1.19, 0.95 and 0.83 respectively, p = 0.005). Risks among
Blacks were higher than those of Whites, with no difference
observed between Black Africans and Black Caribbeans.
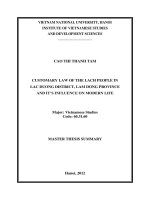
For leukaemias (Fig. 2), the risk among South Asians
was approximately 30% higher than that of Whites. Again,
there was evidence of heterogeneity within this group with
Pakistanis at greater risk than Indians or Bangladeshis
(RRs of 1.58, 1.20 and 1.13 respectively, p = 0.03).
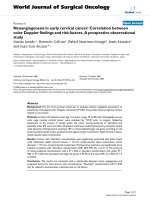
For lymphomas and reticulendothelial neoplasms
(Fig. 3), both South Asians and Blacks were at increased risk. The risk for South Asians was approximately 50% higher than Whites and there was little
evidence of heterogeneity within this group. The risk
for Blacks was approximately 75% higher than Whites;
there was insufficient information to examine heterogeneity within this group. Subgroup analysis revealed
evidence of heterogeneity by sex in South Asians; the
relative risk for males was higher than for females
(RRs of 1.79 and 0.94 respectively, p = 0.03).
Fig. 2 Leukaemias by ethnicity and sex
Page 5 of 11
For CNS neoplasms (Fig. 4), the risk for South
Asians was 25% lower than that of Whites. There was
strong evidence of heterogeneity within the group
with Pakistanis at lower risk than Indians (0.68 and
0.95 respectively; p = 0.005).
For other cancers (Fig. 5), while the risk for South
Asians was similar to Whites, there was evidence of heterogeneity within this group. Indians and Bangladeshis
were at lower risk than Pakistanis (RRs = 0.64, 0.76 and
1.09 respectively; p = 0.007). The risk for Blacks was
approximately 40% higher than Whites. There was some
evidence of heterogeneity within this group with Black
Africans at higher risk than Black Caribbeans (1.59 and
1.09 respectively; p = 0.05).
Missing data and sensitivity analysis
For childhood cancers registered in the period 2001–2007,
ethnicity from HES was 88% complete and from Cancer
Registries it was 53% complete. The percentage of missing
ethnicity data from HES that was supplemented by Cancer
Sayeed et al. BMC Cancer (2017) 17:570
Page 6 of 11
Fig. 3 Lymphomas by ethnicity and sex
Registry data was 3%. Our missing ethnicity data as a whole
ranged (for each cancer) from 7.0% – 11.8% (Table 2).
The incidence rate ratios for each (and all) cancer
(Additional file 1: Figure S1) were very similar after
sensitivity analyses (using multiple imputations of the
missing ethnicity values based on age, sex, income
and site of cancer).
Discussion
Analysing nationwide data for childhood cancer, we have
presented results in this paper that suggest an overall increased risk of childhood cancers in Pakistani and Black
African children relative to White children. We were
also able to further assess the major childhood cancers
and their incidence within self-reported ethnic groups.
Here, we confirmed the well described [24–28] increased
risk of leukaemia and lymphoma in South Asian children, but for leukaemia also show this being due to the
greater risk in Pakistani children in particular. In contrast to our findings in Indian children in Leicester,
South Asian children appeared to have a lesser risk of
CNS cancers. This has also been found in previous studies [24, 27, 29, 30], but these studies were underpowered
and did not reach statistical significance, nor provide
evidence for the lower risk of CNS cancers in Pakistani
children compared to Indian children. Finally, an
increased risk of ‘other solid tumours’ was observed in
Black African children, likely driven by the previously
described excess of renal tumours in this ethnic group
[31, 32], though in this study we did not have sufficient
numbers to estimate the relative risk.
We have previously discussed [12] how ethnicity is
likely a proxy for genetic and/or environmental factors
that might modify cancer risk, and how varying rates of
cancers between ethnic groups may therefore be explicable through exploring the (differing) prevalence of
putative risk/protective factors between ethnic groups.
Where data for different ethnic groups could be found,
some such factors are presented in Table 3, and discussed
further below.
Sayeed et al. BMC Cancer (2017) 17:570
Page 7 of 11
Fig. 4 CNS cancers by ethnicity and sex
High birthweight has been associated with an increased
risk of leukaemia (and possibly non-leukaemia cancers in
older - ≥3 years old – children) [33]. Similarly, advancing
maternal age has also been associated with a small
increased risk (<10%) [34] in all groups of childhood cancer – leukaemia, lymphoma, CNS - analysed in this study.
The above and other factors, such as maternal alcohol
consumption in pregnancy [35], and maternal [36, 37] and
paternal smoking [38, 39], all of which been shown to be
associated with an increased childhood cancer risk (albeit
inconsistently and to varying degrees for different cancers
and subtypes) are all generally of greater prevalence in
British Whites. Yet, our main findings are those of an
increased cancer risk overall, and in leukaemias and
lymphomas in particular, in some South Asian and the
Black African ethnic minority groups.
As seen in Table 1, whilst a greater proportion of these
groups in whom we observed a higher risk of leukaemias
(Pakistanis) and lymphomas (South Asians and Black
Africans) are from a lower income domain (and this
study has adjusted for deprivation), recent large representative population based studies have not observed an
association of deprivation with leukaemia or lymphoma
subtypes [40, 41].
The relatively greater prevalence of HIV in Black
Africans (in whom HIV exposure is mainly through sex
between men and women [42]) is likely driving the increased risk of childhood lymphoma observed here and
in other studies [43–45].
The one group of cancers in which a reduced risk relative to British Whites was observed (RR = 0.71) was in
CNS cancers in South Asian children (apparently driven
by a 32% lesser risk in Pakistani children). This finding
is in keeping with previous UK studies (referenced
above), many of which were in communities wherein
there are large Pakistani populations, and showed a similar (though non-significant) reduced risk in South Asians
relative to non-South Asians.
There are few well established risk factors for childhood CNS cancers [46–48]. Of these are a number of
Sayeed et al. BMC Cancer (2017) 17:570
Page 8 of 11
Fig. 5 Other solid tumours by ethnicity and sex
hereditary syndromes, which given the higher rate of
consanguineous marriage in Pakistani families [49], one
might expect a similarly increased risk of CNS cancers.
However, such syndromes are thought likely to contribute to relatively few cases [50]. Asthma, or atopy more
generally, is a more prevalent, proposed protective factor
in CNS cancers [51, 52]. However, its prevalence does
not appear to be markedly different across different
ethnic groups [53] (Table 3).
This study has many of the strengths of our previous
studies, namely the use of self-assigned ethnicity as a more
accurate measure of ethnicity, as well as the same method
being used for both numerator (Cancer Registry and HES)
and denominator (Census), and the ability to separate
large heterogeneous ethnic groupings (e.g. South Asian,
Black) into more ethnically similar subgroups.
A further additional strength of this study relative to
our analysis of childhood cancer in Indian and White
children in Leicester was the use of national data, with
this much greater sample size and number of outcomes
allowing for greater power and precision in our
estimates. We were able to adjust for age, sex and
deprivation (all potential confounders in studying the
association between ethnicity and cancers), and indeed
also present results by sex. Using national data, where
the method of ascertainment of cases is similar across
the country also allows for a more accurate comparison
between ethnic groups relative to those studies which
compare rates of disease in groups in different countries.
This is, to our knowledge, the first national study of
childhood cancer incidence rate ratios between ethnic
groups using self-assigned ethnicity. Additionally, there
was little missing ethnicity data (Table 2) in these cancers, markedly lower than in our previous studies and
other studies which have used HES data in combination
with other methods [30].
Limitations remain however, in this being a population
level study without information on individual exposures.
Further, despite our presenting results by smaller, more
homogenous ethnic subgroups, there remain within
Sayeed et al. BMC Cancer (2017) 17:570
Page 9 of 11
Table 3 Prevalence of some risk factors associated with childhood cancers, by ethnic group in the general population (most data
sources: 2001–2010)
Cancer Associated
with Risk Factora
British
White
British
Indian
British
Pakistani
British
Bangladeshi
British Black
African
British Black
Caribbean
British
Chinese
Maternal age at pregnancy
>35 years (%) [34, 56, 57]
Leukaemia; Lymphoma;
CNS; Bone; Wilm’s
20
12
10
7
20
26
—
Maternal alcohol intake in
pregnancy (%) [35, 56, 58]
Acute Myeloid Leukaemia
37
12
0
0
20
20
—
Maternal smoking in
pregnancy (%) [36, 37, 56, 58]
Acute Myeloid Leukaemia; CNS
37
6
4
4
22
22
—
Epstein-Barr virus prevalence
in pregnancy (%)b [59]
Hodgkin’s Disease
94
94
94
94
—
—
—
Breastfed for at least four
months (%) [58, 60, 61]
↓Acute Lymphoblastic Leukaemia
27
41
26
26
50
50
—
Paternal smoking (male
prevalence 2003/4)
[38, 39, 56, 62]
Acute Lymphoblastic Leukaemia
27
23
18
35
26
22
19
Household size (mean)
[63, 64]
Leukaemia
2.3
3.4
4.3
4.3
2.6
2.2
—
High birth weight
> 4000 g (%) [33, 56, 57]
All childhood cancers
13
3
5
3
9
6
—
HIV (%)b c [43, 65]
Non-Hodgkin’s lymphoma
53
1
1
1
35
3
—
Epstein-Barr virus
prevalence (%)b d [66]
Hodgkin’s disease
44
95
95
95
—
—
—
Asthma prevalence (%)
[52, 53]
↓CNS
32
24
29
26
23
33
—
Parental risk factors:
General Risk Factors:
Direction of effect increased unless indicated with ↓
Combined estimate (italicised) for some ethnic minority groups
Proportional breakdown across ethnicities of diagnosed HIV infected adults seen for care in England, Wales and NI (2003)
d
within a study of children with Hodgkin’s disease, diagnosed 1981–1999
— Data not available
a
b
c
these groups a degree of heterogeneity, e.g. with Black
Africans having a number of countries of origin, and
similarly with Indians and Pakistanis originating from a
number of provinces and states, with the cultural and
genetic diversity that results in different ethnic groups.
As we have previously noted [6], we considered the
‘White’ classification to be ‘British White’ - though there
would have been ‘Irish White’ and ‘Other White’ present
in the ‘White’ classification (until 2003). However, these
would have been very few (4% in the 2001 census), and
unlikely therefore to have affected the results for British
Whites. Finally, despite our use of self-assigned ethnicity
as the current best measure of ethnicity, there remains a
discordance – more so in ethnic minorities - between
HES ethnicity recording and self-assigned ethnicity and
there is an ongoing need to improve the accuracy of this
data [54].
Conclusions
Improvements in data collection and linkage of databases in recent years have permitted a more detailed and
accurate study of ethnicity as a possible risk or
protective factor in a number of different diseases. Initial
descriptive studies such as this highlight associations between ethnicity as an exposure and outcomes such as
childhood cancers; whilst it is not yet of course possible
to draw conclusions regarding correlation, the awareness
of these differences between ethnic groups based on
high quality data allows for better public health planning
and targeted initiatives, and the development of further
research to aim to understand why these differences
might exist, potentially giving rise to individual level,
translational research [55].
Additional file
Additional file 1: Figure S1. Sensitivity Analysis - Each cancer and all
cancers by ethnicity, using imputed data. Sensitivity analyses for each
cancer, and all cancers, by ethnicity (using multiple imputations of the
missing ethnicity values based on age, sex, income and site of cancer).
(PDF 3 kb)
Abbreviations
(F)CI: (floating) confidence intervals; (I)RR: (incidence) rate ratios; ASR: Agestandardised rates; CNS: Central nervous system; CRUK: Cancer Research UK;
Sayeed et al. BMC Cancer (2017) 17:570
HES: Hospital episodes statistics; HIV: Human immunodeficiency virus; ICCC3: International classification of childhood cancer, 3rd edition; ICD10: International classification of diseases, 10th revision; ICD-O-2/
3: International classification of diseases of oncology, 2nd/3rd revisions; IMD
2007: Index of multiple deprivation 2007; NCIN: National cancer intelligence
network; ONS: Office of National Statistics
Page 10 of 11
8.
9.
10.
11.
Acknowledgements
We would like to thank the National Cancer Intelligence Network and the
Office of National Statistics for providing the data, and Cancer Research UK
and the University of Oxford’s Cancer Epidemiology Unit for their support
and funding.
12.
13.
Funding
RA and IB are employees of, and SS an honorary research fellow at, the
University of Oxford’s Cancer Epidemiology Unit which is supported by
Cancer Research UK. The sponsor of the study had no role in design and
conduct of the study; collection, management, analysis and interpretation of
the data; and preparation, review or approval of the manuscript.
14.
Availability of data and materials
The data that support the findings of this study are available from NCIN but
restrictions apply to the availability of these data, which were used under
license for the current study, and so are not publicly available. Data are
however available from the authors upon reasonable request and with
permission of NCIN.
17.
Authors’ contributions
All authors (SS, IB and RA) participated in the design of the study, as well as
drafting and approval of the final manuscript. IB drafted the Methods section,
performed the statistical analyses, and created the Tables and Figures.
20.
Ethics approval and consent to participate
This study was approved by the Oxford Research Ethics Committee (this was a
requirement for the data to be released by NCIN). Consent was not obtained
because the data were analysed anonymously (de-identified and aggregated).
22.
23.
Consent for publication
Not applicable.
Competing interests
The authors declare that they have no competing interests
Publisher’s Note
15.
16.
18.
19.
21.
24.
25.
26.
Springer Nature remains neutral with regard to jurisdictional claims in
published maps and institutional affiliations.
27.
Received: 5 December 2016 Accepted: 14 August 2017
28.
References
1. National Cancer Intelligence Network and Cancer Research UK: Cancer
Incidence and Survival by Major Ethnic Group, England 2002–2006. 2009.
2. Ali R, Barnes I, Cairns BJ, Finlayson AE, Bhala N, Mallath M, Beral V. Incidence
of gastrointestinal cancers by ethnic group in England, 2001–2007. Gut.
2013;62(12):1692-703.
3. Shirley MH, Sayeed S, Barnes I, Finlayson A, Ali R. Incidence of
haematological malignancies by ethnic group in England, 2001–7. British
journal of haematology. 2013;163(4):465-77.
4. Finlayson A, Barnes I, Sayeed S, McIver B, Beral V, Ali R. Incidence of
thyroid cancer in England by ethnic group, 2001-2007. Br J Cancer.
2014;110(5):1322–7.
5. Shirley MH, Barnes I, Sayeed S, Finlayson A, Ali R. Incidence of breast and
gynaecological cancers by ethnic group in England, 2001-2007: a
descriptive study. BMC Cancer. 2014;14:979.
6. Maruthappu M, Barnes I, Sayeed S, Ali R. Incidence of prostate and
urological cancers in England by ethnic group, 2001-2007: a descriptive
study. BMC Cancer. 2015;15:753.
7. Maile EJ, Barnes I, Finlayson AE, Sayeed S, Ali R. Nervous system and
intracranial tumour incidence by ethnicity in England, 2001-2007: a
descriptive epidemiological study. PLoS One. 2016;11(5):e0154347.
29.
30.
31.
32.
33.
34.
35.
Parkin DM, Khlat M. Studies of cancer in migrants: rationale and
methodology. Eur J Cancer. 1996;32A(5):761–71.
Office for National Statistics: Ethnic group statistics : a guide for the
collection and classification of ethnicity data. 2003.
Mathur R, Grundy E, Smeeth L: Availability and use of UK based ethnicity
data for health research. 2013.
Office for National Statistics: Death registration summary tables - England
and Wales, 2011 (Final). 2012.
Sayeed S, Barnes I, Cairns BJ, Finlayson A, Ali R. Childhood cancer incidence in
British Indians & Whites in Leicester, 1996-2008. PLoS One. 2013;8(4):e61881.
World Health Organisation. International Statistical Classification of Diseases
and Related Health Outcomes, 10th Revision. Geneva: World Health
Organization; 1992.
World Health Organisation. International Classification of Diseases for
Oncology, 3rd Revision. Geneva: World Health Organization; 2000.
World Health Organisation. International Classification for Diseases of
Oncology, 2nd Revision. Geneva: World Health Organization; 1990.
Noble M, mcLennan D, Wilkinson K, Whitworth A, Barnes H, Dibben C. The
English Indices of Deprivation 2007. London: Communities and Local
Government; 2008.
Steliarova-Foucher E, Stiller C, Lacour B, Kaatsch P. International classification
of childhood cancer, third edition. Am Cancer Soc. 2005;103(7):1457–67.
van Laar M, McKinney PA, Parslow RC, Glaser A, Kinsey SE, et al. Cancer
incidence among the south Asian and non-south Asian population under
30 years of age in Yorkshire, UK. Br J Cancer. 2010;108:1448–52.
Segi M. Cancer Mortality for Selected Sites in 24 Countries (1950–57).
Sendai: Tohoku University School of Public Health; 1960.
Plummer M. Improved estimates of floating absolute risk. Stat Med. 2004;
23(1):93–104.
Easton DF, Peto J, Babiker AGAG. Floating absolute risk - an alternative to
relative risk in survival and case-control analysis avoiding an arbitrary
reference group. Stat Med. 1991;10(7):1025–35.
StataCorp. Stata statistical software: release 13. College Station: StataCorp LP; 2013.
R Core Team. R: a language and enviroment for statistical computing.
Vienna: R Foundation for Statistical Computing; 2014.
Stiller CA, McKinney PA, Bunch KJ, Bailey CC, Lewis IJ. Childhood cancer and
ethnic group in Britain: a United Kingdom children’s Cancer Study Group
(UKCCSG) study. Br J Cancer. 1991;64(3):543–8.
Muir KR, Parkes SE, Mann JR, Stevens MC, Cameron AH. Childhood cancer in
the West Midlands: incidence and survival, 1980-1984, in a multi-ethnic
population. Clin Oncol (R Coll Radiol). 1992;4(3):177–82.
Cummins C, Winter H, Maric R, Cheng KK, Silcocks P, Varghese C, Batlle G.
Childhood cancer in the south Asian population of England (1990-1992). Br
J Cancer. 2001;84(9):1215–8.
McKinney PA, Feltbower RG, Parslow RC, Lewis IJ, Glaser AW, Kinsey SE.
Patterns of childhood cancer by ethnic group in Bradford, UK 1974-1997.
Eur J Cancer. 2003;39(1):92–7.
Winter H, Cheng KK, Cummins C, Maric R, Silcocks P, Varghese C. Cancer
incidence in the south Asian population of England (1990-92). Br J Cancer.
1999;79(3–4):645–54.
Powell JE, Parkes SE, Cameron AH, Mann JR. Is the risk of cancer increased
in Asians living in the UK? Arch Dis Child. 1994;71(5):398–403.
van Laar M, McKinney PA, Parslow RC, Glaser A, Kinsey SE, Lewis IJ, Picton
SV, Richards M, Shenton G, Stark D, et al. Cancer incidence among the
south Asian and non-south Asian population under 30 years of age in
Yorkshire, UK. Br J Cancer. 2010;103(9):1448–52.
Breslow N, Olshan A, Beckwith JB, Moksness J, Feigl P, Green D. Ethnic
variation in the incidence, diagnosis, prognosis, and follow-up of children
with Wilms’ tumor. J Natl Cancer Inst. 1994;86(1):49–51.
Axt J, Murphy AJ, Seeley EH, Martin CA, Taylor C, Pierce J, Caprioli RM,
Whiteside M, Lovvorn HN 3rd. Race disparities in Wilms tumor incidence
and biology. J Surg Res. 2011;170(1):112–9.
Paltiel O, Tikellis G, Linet M, Golding J, Lemeshow S, Phillips G, Lamb K,
Stoltenberg C, Haberg SE, Strom M, et al. Birthweight and childhood cancer:
preliminary findings from the international childhood cancer cohort
consortium (I4C). Paediatr Perinat Epidemiol. 2015;29(4):335–45.
Johnson KJ, Carozza SE, Chow EJ, Fox EE, Horel S, McLaughlin CC, Mueller
BA, Puumala SE, Reynolds P, Von Behren J, et al. Parental age and risk of
childhood cancer: a pooled analysis. Epidemiology. 2009;20(4):475–83.
Latino-Martel P, Chan DS, Druesne-Pecollo N, Barrandon E, Hercberg S,
Norat T. Maternal alcohol consumption during pregnancy and risk of
Sayeed et al. BMC Cancer (2017) 17:570
36.
37.
38.
39.
40.
41.
42.
43.
44.
45.
46.
47.
48.
49.
50.
51.
52.
53.
54.
55.
56.
57.
58.
childhood leukemia: systematic review and meta-analysis. Cancer Epidemiol
Biomark Prev. 2010;19(5):1238–60.
Brooks DR, Mucci LA, Hatch EE, Cnattingius S. Maternal smoking during
pregnancy and risk of brain tumors in the offspring. A prospective study of
1.4 million Swedish births. Cancer Causes Control. 2004;15(10):997–1005.
Mucci LA, Granath F, Cnattingius S. Maternal smoking and childhood
leukemia and lymphoma risk among 1,440,542 Swedish children. Cancer
Epidemiol Biomark Prev. 2004;13(9):1528–33.
Milne E, Greenop KR, Scott RJ, Bailey HD, Attia J, Dalla-Pozza L, de Klerk NH,
Armstrong BK. Parental prenatal smoking and risk of childhood acute
lymphoblastic leukemia. American journal of epidemiology. 2011;175(1):4353.
Liu R, Zhang L, McHale CM, Hammond SK. Paternal smoking and risk of
childhood acute lymphoblastic leukemia: systematic review and metaanalysis. J Oncol. 2011;2011:854584.
Smith A, Howell D, Patmore R, Jack A, Roman E. Incidence of
haematological malignancy by sub-type: a report from the Haematological
Malignancy Research Network. Br J Cancer. 2011;105(11):1684–92.
Adam M, Kuehni CE, Spoerri A, Schmidlin K, Gumy-Pause F, Brazzola P,
Probst-Hensch N, Zwahlen M. Socioeconomic status and childhood
leukemia incidence in Switzerland. Front Oncol. 2015;5:139.
Public Health England. National HIV surveillance data tables - Table 18: Persons
seen for HIV care in the UK by ethnicity and route of exposure: 2014.
Biggar RJ, Frisch M, Goedert JJ. Risk of cancer in children with AIDS.
AIDS-Cancer Match Registry Study Group. JAMA. 2000;284(2):205–9.
Evans JA, Gibb DM, Holland FJ, Tookey PA, Pritchard J, Ades AE.
Malignancies in UK children with HIV infection acquired from mother to
child transmission. Arch Dis Child. 1997;76(4):330–3.
Beral V, Peterman T, Berkelman R, Jaffe H. AIDS-associated non-Hodgkin
lymphoma. Lancet. 1991;337(8745):805–9.
Schuz J, Kaletsch U, Kaatsch P, Meinert R, Michaelis J. Risk factors for
pediatric tumors of the central nervous system: results from a German
population-based case-control study. Med Pediatr Oncol. 2001;36(2):274–82.
Frei P, Poulsen AH, Johansen C, Olsen JH, Steding-Jessen M, Schuz J. Use of
mobile phones and risk of brain tumours: update of Danish cohort study.
BMJ. 2011;343:d6387.
Wrensch M, Minn Y, Chew T, Bondy M, Berger MS. Epidemiology of primary
brain tumors: current concepts and review of the literature. NeuroOncology. 2002;4(4):278–99.
Sheridan E, Wright J, Small N, Corry PC, Oddie S, Whibley C, Petherick ES,
Malik T, Pawson N, McKinney PA, et al. Risk factors for congenital anomaly
in a multiethnic birth cohort: an analysis of the Born in Bradford study.
Lancet. 2013;382(9901):1350–9.
Narod SA, Stiller C, Lenoir GM. An estimate of the heritable fraction of
childhood cancer. Br J Cancer. 1991;63(6):993–9.
Roncarolo F, Infante-Rivard C. Asthma and risk of brain cancer in children.
Cancer Causes Control. 2012;23(4):617–23.
Harding NJ, Birch JM, Hepworth SJ, McKinney PA. Atopic dysfunction
and risk of central nervous system tumours in children. Eur J Cancer.
2008;44(1):92–9.
Whitrow MJ, Harding S. Asthma in Black African, Black Caribbean and South
Asian adolescents in the MRC DASH study: a cross sectional analysis. BMC
pediatrics. 2010;10(1):18.
Saunders CL, Abel GA, El Turabi A, Ahmed F, Lyratzopoulos G. Accuracy of
routinely recorded ethnic group information compared with self-reported
ethnicity: evidence from the English Cancer Patient Experience survey. BMJ
Open. 2013;3(6).
Irving GR, Iwuji CO, Morgan B, Berry DP, Steward WP, Thomas A, Brown K,
Howells LM. Combining curcumin (C3-complex, Sabinsa) with standard care
FOLFOX chemotherapy in patients with inoperable colorectal cancer (CUFOX):
study protocol for a randomised control trial. Trials. 2015;16(1):1–10.
Linet MS, Wacholder S, Zahm SH. Interpreting epidemiologic research:
lessons from studies of childhood cancer. Pediatrics. 2003;112(Supplement
1):218-32.
Moser K, Stanfield KM, Leon DA. Birthweight and gestational age by ethnic
group, England and Wales 2005: introducing new data on births. Health
Stat Q. 2008(39):22-31, 34-55.
Hawkins SS, Lamb K, Cole TJ, Law C. Influence of moving to the UK on
maternal health behaviours: prospective cohort study. BMJ. 2008;
336(7652):1052–5.
Page 11 of 11
59. Pembrey L, Raynor P, Griffiths P, Chaytor S, Wright J, Hall AJ. Seroprevalence
of cytomegalovirus, Epstein Barr virus and varicella zoster virus among
pregnant women in Bradford: a cohort study. PLoS One. 2013;8(11):e81881.
60. Infante-Rivard C, Fortier I, Olson E. Markers of infection, breast-feeding and
childhood acute lymphoblastic leukaemia. Br J Cancer. 2000;83(11):1559–64.
61. Rudant J, Orsi L, Menegaux F, Petit A, Baruchel A, Bertrand Y, Lambilliotte A,
Robert A, Michel G, Margueritte G, et al. Childhood acute leukemia, early
common infections, and allergy: the ESCALE study. Am J Epidemiol. 2010;
172(9):1015–27.
62. Karlsen S, Millward D, Sandford A. Investigating ethnic differences in current
cigarette smoking over time using the health surveys for England. The
European Journal of Public Health. 2011;22(2):254-6.
63. Bevier M, Weires M, Thomsen H, Sundquist J, Hemminki K. Influence of
family size and birth order on risk of cancer: a population-based study. BMC
Cancer. 2011;11:163.
64. National Statistics: Average household size by ethnic group of household
reference person, Great Britain 2001 and 2002 combined. 2004.
65. Rice BD, Payne LJ, Sinka K, Patel B, Evans BG, Delpech V. The changing
epidemiology of prevalent diagnosed HIV infections in England, Wales, and
Northern Ireland, 1997 to 2003. Sex Transm Infect. 2005;81(3):223–9.
66. Flavell KJ, Biddulph JP, Powell JE, Parkes SE, Redfern D, Weinreb M, Nelson
P, Mann JR, Young LS, Murray PG. South Asian ethnicity and material
deprivation increase the risk of Epstein-Barr virus infection in childhood
Hodgkin’s disease. Br J Cancer. 2001;85(3):350–6.
Submit your next manuscript to BioMed Central
and we will help you at every step:
• We accept pre-submission inquiries
• Our selector tool helps you to find the most relevant journal
• We provide round the clock customer support
• Convenient online submission
• Thorough peer review
• Inclusion in PubMed and all major indexing services
• Maximum visibility for your research
Submit your manuscript at
www.biomedcentral.com/submit