Population-based colorectal cancer screening programmes using a faecal immunochemical test: Should faecal haemoglobin cut-offs differ by age and sex
Bạn đang xem bản rút gọn của tài liệu. Xem và tải ngay bản đầy đủ của tài liệu tại đây (1.52 MB, 13 trang )
Arana-Arri et al. BMC Cancer (2017) 17:577
DOI 10.1186/s12885-017-3555-3
RESEARCH ARTICLE
Open Access
Population-based colorectal cancer
screening programmes using a faecal
immunochemical test: should faecal
haemoglobin cut-offs differ by
age and sex?
Eunate Arana-Arri1*, Isabel Idigoras2, Begoña Uranga3, Raquel Pérez4, Ana Irurzun3, Iñaki Gutiérrez-Ibarluzea5,
Callum G. Fraser6, Isabel Portillo6 , EUSKOLON Group
Abstract
Background: The Basque Colorectal Cancer Screening Programme has both high participation rate and high
compliance rate of colonoscopy after a positive faecal occult blood test (FIT). Although, colorectal cancer (CRC)
screening with biannual (FIT) has shown to reduce CRC mortality, the ultimate effectiveness of the screening
programmes depends on the accuracy of FIT and post-FIT colonoscopy, and thus, harms related to false results
might not be underestimated. Current CRC screening programmes use a single faecal haemoglobin concentration
(f-Hb) cut-off for colonoscopy referral for both sexes and all ages. We aimed to determine optimum f-Hb cut-offs by
sex and age without compromising neoplasia detection and interval cancer proportion.
Methods: Prospective cohort study using a single-sample faecal immunochemical test (FIT) on 444,582 invited
average-risk subjects aged 50–69 years. A result was considered positive at ≥20 μg Hb/g faeces. Outcome measures
were analysed by sex and age for a wide range of f-Hb cut-offs.
Results: We analysed 17,387 positive participants in the programme who underwent colonoscopy. Participation
rate was 66.5%. Men had a positivity rate for f-Hb of 8.3% and women 4.8% (p < 0.0001). The detection rate for
advanced neoplasia (cancer plus advanced adenoma) was 44.0‰ for men and 15.9‰ for women (p < 0.0001). The
number of colonoscopies required decreased in both sexes and all age groups through increasing the f-Hb cut-off.
However, the loss in CRC detection increased by up to 28.1% in men and 22.9% in women. CRC missed were
generally at early stages (Stage I-II: from 70.2% in men to 66.3% in women).
Conclusions: This study provides detailed outcomes in men and women of different ages at a range of f-Hb
cut-offs. We found differences in positivity rates, neoplasia detection rate, number needed to screen, and interval
cancers in men and women and in younger and older groups. However, there are factors other than sex and age
to consider when consideration is given to setting the f-Hb cut-off.
Keywords: Adenoma, Colorectal cancer, Faecal immunochemical test, Faecal occult blood test, Interval
cancers, Screening
* Correspondence:
1
BioCruces Health Research Institute, Plaza Cruces 12, 48903 Barakaldo,
Bizkaia, Spain
Full list of author information is available at the end of the article
© The Author(s). 2017 Open Access This article is distributed under the terms of the Creative Commons Attribution 4.0
International License ( which permits unrestricted use, distribution, and
reproduction in any medium, provided you give appropriate credit to the original author(s) and the source, provide a link to
the Creative Commons license, and indicate if changes were made. The Creative Commons Public Domain Dedication waiver
( applies to the data made available in this article, unless otherwise stated.
Arana-Arri et al. BMC Cancer (2017) 17:577
Background
Colorectal cancer (CRC) screening using tests for the
presence of blood in faeces, commonly known as faecal
occult blood tests (FOBT), has been shown to be an effective intervention for reducing CRC-related mortality
in controlled studies conducted both in Europe [1–3]
and in the USA [4]. The mortality reduction varied between 14 and 18%, with colonoscopy being used as the
second stage investigation in those with a positive faecal
test result. Thus, screening reduces the burden of CRC,
which is the most common cancer in industrialized
countries and has a high mortality rate of approximately
25.4 expected deaths per 100,000 in the overall population. The standardized incidence-based mortality ratio is
0.47 (95% confidence interval [CI]: 0.26–0.80) with colonoscopic polypectomy, suggesting a 53% reduction in
mortality [5, 6].
FOBT has been widely implemented for CRC screening
and, in 2003, the European Union (EU) published an official recommendation for its members to carry out FOBT
screening for the average-risk population aged between 50
and 74 years [7]. In this regard, faecal testing has improved markedly since the aforementioned studies were
carried out, with the original guaiac test (gFOBT) being
superseded by faecal immunochemical tests for haemoglobin (FIT), which are potentially much better at detecting
advanced adenomas (AA) and CRC and are also much
better accepted by potential participants because of ease
of use and the lack of a need for special dietary requirements [8, 9]. The EU guidelines recommend use of FIT in
population-based programmes [10, 11] and, indeed, an
impact on cancer incidence has been found in recent
studies [12, 13], although further investigation is needed
to assess the longer-term impact. A recent meta-analysis
shows an average sensitivity of 79% and a specificity of
94% of FIT for CRC in asymptomatic subjects [14].
Current main concerns are centered on qualityassurance practices and the possible negative consequences
of such programmes. Quality assurance throughout the
screening process is based on criteria and indicators recommended by the European guidelines [10], whereas the
negative effects concern the main side effects of CRC programmes, in particular, colonoscopy-related complications
and false-negative and false-positive results. In the case of
false positive results, three studies found differences between the sexes [15, 16] and noted that this situation was
unsatisfactory, especially for women [17].
Some models have been designed to include faecal
haemoglobin concentration (f-Hb) as a predictor for
colorectal neoplasia and have suggested that adjustments
must be made to take into account sex, family history or
morbidities when implementing programmes [18], In
this regard, the Scottish Bowel Screening Programme
evaluation using FIT showed important differences in
Page 2 of 13
the results for men and women, with a greater participation with FIT than with gFOBT, a higher positivity rate
in men than women in all groups, and a higher detection
rate in men for AN and CRC. In contrast, the number of
false-positive results was lower in men (49.1% versus
58.9% in women) for colonoscopies performed [19]. A
similar pattern was reported by the Basque Country for
lesions detected in the period 2009–2011 [20].
Adjusted incidence rates for CRC in the Basque Country
have increased significantly, by 2.3% per year in men (from
60.3 per 100,000 in 2000 to 87.6 in 2011) and by 6.5% per
year in women (from 56.6 in 2007 to 71.8 in 2011). The
age-standardized incidence rates for 2007 (prior to implementation of the Basque Country Colorectal Cancer
Screening Programme) showed a high men-to-women
ratio for different locations [21].
A recent review [22] concluded that the influence of
sex on the comparative performance of tests for detecting advanced colorectal neoplasia (AN) has not been investigated with sufficient power in any of the diagnostic
cohort studies conducted to date. In a prospective crosssectional study, van Turenhout et al. [23] concluded that
FIT has a higher sensitivity and lower specificity for CRC in
men and that different f-Hb cut-offs should be used in
screening programmes. These data are consistent with
those published by Fraser et al. [24], who concluded that fHb distributions vary by sex and age, this supporting the
view that setting and using a single f-Hb cut-off in any
CRC screening programme is far from ideal. Alvarez-Urturi
et al. [25] have recently conclude in the ColonPrev randomized controlled trial study that FIT cut-offs could be individualized by sex and age to improve the performance of FIT
in CRC screening programmes. On the other hand
Kapidzic et al. [26], in a prospective cohort of invited
people from the Dutch population-based screening
programme, do not recommend different f-Hb cut-offs in
men and women based on the consideration that positive
predictive values for the sexes should be the same. Establishing different f-Hb cut-offs between men and women
and between age groups could influence the effectiveness of
screening. Looking ahead to achieve consistent detection
rates among regions, the cut-offs could differ. However any
increase in the f-Hb cut-off selected to define positivity,
while increasing sensitivity for AN, can increase the rate of
false positives [27].
Colonoscopy demand increases with the use of FIT
when used with the widely applied low f-Hb cut-offs since
the expected number of positive test results is more than
three times higher than that with gFOBT, posing an economic challenge for many regions as regards the implementation of population-based screening programmes,
since additional investment and resources are needed to
implement them, at least in the early screening rounds. As
such, an exercise to estimate the clinical outcomes
Arana-Arri et al. BMC Cancer (2017) 17:577
including the number needed to screen (NNS) to detect
one case, and the f-Hb cut-offs to be used are a difficult
dilemma for epidemiologists and decision-makers. Using
quantitative FIT, the f-Hb cut-off (s) to be used becomes a
crucial decision since the positivity rate determines the
number of colonoscopies required. In this regard,
some f-Hb cut-offs have been suggested and simulated
outcomes created to answer these questions [28–30].
The main question, however, is how to determine the
best f-Hb cut-off (s) for a specific target population in
order to detect the true positive results without increasing the number of interval cancers (ICs), a serious consideration in any screening programme [31, 32]. In this
study, we aimed to answer these questions on the basis
of a high participation rate population-based screening
programme and determine whether strategies using f-Hb
cut-offs stratified by sex and age group may be useful.
Methods
Study population and interventions
The Basque Country CRC Screening Programme is
population-based and started in 2009 as a pilot and was
extended in 2010 after evaluation and optimisation of
the processes involved. The main strategy was based on:
A) a Coordinating Office, including clinical epidemiologists and statisticians, to plan, organize and manage the
programme; B) all residents from 50 to 69 years were invited, taking into account the Health Centers and referral Hospitals, in order to adjust the positivity expected
and colonoscopy capacity; C) prior to the invitation, the
Coordinating Office selected the target population and
linked the database to the Basque Population Cancer
and Medical Procedures Registries to exclude people
with a previously diagnosed CRC, terminal illness and
colonoscopy reported in the last 5 years; D) training and
involvement of Basque Health Service Primary Care
staff; E) individualized posted invitations providing information about the programme. After 4–6 weeks from the
initial invitation, the kit was sent along with instructions
and an individualized bar code. This code allows the
sample and person to be identified when processing the
result. Samples were collected at Primary Health Centers
of the Basque Public Health Service and processed in
centralized public laboratories under strict total quality
management systems; F) automatically the software system introduces the result in the “ad hoc” CRC database
and primary care physicians review all results of their
patients (reader has to bear in mind that electronic clinical records are implemented in community care in the
Basque Country). Letters were posted with the results: a)
if negative, the invitation will be repeated in 2 years’
time if the person is younger than 70 years, or b) if
positive, participants are recommended to visit their
General Practitioner, who will indicate the need for a
Page 3 of 13
colonoscopy and c) in case of error, another kit and instructions were sent; G) colonoscopies are performed in
referral public hospitals under sedation by expert specialists; H) all cases are followed-up with close coordination
between Primary Care and Specialized Units; J) every case
is coded by the Coordinating Office staff following
standard EU guidelines and Spanish Network consensus recommendations [10, 33]. This study was approved by the Basque Country’s Ethics Committee
(Reference: PI2014059). All participants provide written informed consent.
Detection of ICs: prior to a subsequent invitation, all
negative cases from a previous round are linked to the
register of hospital discharges with ICD-9 1530–1548,
in primary and secondary diagnosis, ICDO-10 C18-C21
of hospital registers and population-based Cancer registries
as well as codes of Pathology. In all coinciding cases, the
qualified staff from the Programme’s Coordinating
Centre checked the clinical history, including the
cases as ICs which complied with the criteria of
having a negative FIT result in the previous invitation
(0–24 mo or more in case of a delay in the invitation
to the screening programme). To ensure against any
possible losses, this process was repeated on an
annual basis.
Definitions
The FIT used from early 2009 and in early 2010 (during
the pilot study) were OC-Sensor Micro (Eiken Chemical
Co, Tokyo, Japan) and FOB-Gold (Sentinel CH. SpA,
Milan, Italy), in both with a f-Hb cut-off of 20 μg Hb/g
faeces. After comparison of the results obtained with
both devices [34], OC-Sensor was selected and has been
used since. OC-Sensor is a quantitative FIT, with chemistry based on human haemoglobin antibody mediated
latex agglutination. Bar coded specimen collection devices were analysed for f-Hb. In the current analysis, the
data are only related to this FIT. The result was considered positive when f-Hb was ≥20 μg Hb/g faeces.
The histology of all lesions detected was evaluated by
expert pathologists specializing in gastrointestinal
oncology according to the quality standards of the
European guidelines [10]. The maximum reach of the
endoscope, adequacy of bowel preparation, as well as
the characteristics and location of any polyps were
recorded. Adenomas ≥10 mm, adenoma with a villous
component (i.e., tubulovillous or villous adenoma) or
adenomas with severe/high-grade dysplasia were classified as AA [10].
AN was defined as CRC plus AA. Tumour staging was
established according to the TNM classification system
in agreement with the AJCC Cancer Staging Manual
[35]. Finally, participants were classified and then
assigned according to the most advanced lesion found.
Arana-Arri et al. BMC Cancer (2017) 17:577
Statistical analysis
CRC screening performance measures were assessed following the European guidelines [10]. Variables were calculated
and described as percentages with 95% confidence intervals.
The number needed to screen (NNS) was calculated as
the number of completed screening tests required to
find one AN. All test characteristics were calculated separately for f-Hb cut-offs of 20, 25, 30, 35, 40, 50 and
60 μg Hb/g faeces, respectively.
Differences in the test characteristics between men
and women and different age ranges were assessed using
the chi-squared and/or Fisher’s tests. Since the data on
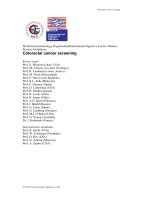
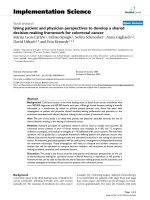
Fig. 1 Study flow diagram
Page 4 of 13
f-Hb did not follow a normal distribution, the MannWhitney U test was used to compare continuous variables between the groups. The normality of the distribution of continuous variables was assessed using a normal
Q-Q plot. A p-value of less than 0.05 was considered to
be statistically significant using a two-sided test.
A logistic regression was performed to analyze the
risk of loss in the detection of AN by sex and age
stratified group.
The statistical analysis was conducted using SPSS version 23.0 (IBM Corp. Released 2013. IBM SPSS Statistics
for Windows, Version 23.0. Armonk, NY: IBM Corp.).
Arana-Arri et al. BMC Cancer (2017) 17:577
Page 5 of 13
Results
Between 2009 and 2012, 444,582 subjects were invited
to the Basque Country CRC Screening Programme. The
flow diagram is summarized in Fig. 1. The study population comprised 17,387 participants with a positive test
result who underwent complete colonoscopy.
The overall participation was high (66.5%; 95% CI:
66.4–66.7), as was the colonoscopy compliance (95.1%;
95% CI: 94.8–95.5). The characteristics of the participants in the study population are summarized by sex
and age group in Tables 1 and 2, respectively.
The proportion of false negative results was 7.6% (95%
CI: 6.5–8.8). We identified 136 interval cancers (IC) and,
in Table 3, the difference in characteristics of IC and
screen-detected cancers (SD-C) are summarized divided
into two groups, those cancers detected in participants
attending for the first time (prevalent screening cancers)
and those attending in subsequent rounds (incidence
screening cancers).
Table 1 Characteristics of participants studied
Men
Women
63.7
69.3
Colonoscopy compliance; %
95.0
94.2
Total number of participantsa
10,982
7291
Colorectal cancer (CRC)
693
339
Age (years); mean (SD)
61.4 (5.1)
60.2 (5.6)
Participation; %
μg Hb/g faeces; median (IQR)
219.0 (74.2–694.5))
175.3 (63.8–440.8)
Location Location (proximal
side/distal side/rectum)b; %
18.2/70.1/11.7
21.8/64.2/14.0
Stage (I-II/III-IV/missing); %
68.0/27.6/4.4
63.7/30.8/5.5
Size (cm); mean (SD)
2.7 (1.5)
2.8 (1.6)
Advanced adenomas (AA)c
5188
2028
Age (years); mean (SD)
60.1 (5.4)
59.8 (5.6)
μg Hb/g faeces; median (IQR)
79.2 (35.2–229.6)
71.6 (33.2–188.6)
Location Location (proximal
side/distal side/rectum)b; %
20.1/67.4/12.5
20.1/63.7/16.2
Number polyps; median (IQR)
3.0 (2.0–5.0)
2.0 (1.0–4.0)
Higher size polyps (mm);
median (IQR)
12.0 (9.0)
12.0 (8.0)
Size of AA >9 mm; %
65.1
65.1
Size of AA >19 mm; %
13.6
12.8
AA with villous component; %
36.2
36.3
AA with severe/high-grade
dysplasia; %
8.6
8.7
SD Standard deviation, IQR Interquartile range
a
Positives
b
Right side includes regions up to and including the splenic flexure; left side
includes descending colon and up to rectum
c
Advanced adenomas: adenomas ≥10 mm, adenoma with a villous component
(i.e., tubulovillous or villous adenoma) or adenomas with
severe/high-grade dysplasia
Programme performance indicators and test
characteristics
The positive predictive values (PPV) for AN, both for the
study group and in each sex and age stratified groups of
participants, are shown in Tables 4 and 5. Significant differences were observed at a f-Hb cut-off of 20 μg Hb/g
faeces, and this patternwas maintained throughout the different f-Hb cut-offs analysed by sex. The PPV was significantly higher in men at all f-Hb cut-offs. There were also
significant differences between age-specific groups in men
and women, with the PPV being higher in the older population for both sexes.
The positivity rate for the range of f-Hb cut-offs
assessed was also higher in men and the difference with
women was also significant, with the positivity decreasing with increasing f-Hb cut-off. The positivity was
lower for all age groups in both sexes as the f-Hb cut-off
increased, being higher in older men and women, and
with significant differences by sex (Tables 4 and 5).
The CRC detection rate (CDR) was higher in men than
in women and in older subjects, with significant differences
for all f-Hb cut-offs (Tables 4 and 5). In men, the CDR decreased from 5.2‰ (95% CI: 4.8–5.6) to 4.1‰ (95% CI:
3.8–4.4) and in women from 2.2‰ (95% CI: 2.0–2.4) to
1.7‰ (95% CI: 1.5–1.9). The advanced neoplasia detection
rate (ANDR) was also higher in men at a f-Hb cut-off of
20 μg Hb/g faeces (44.0‰ [95% CI: 42.9–45.1]), with a significant difference with respect to women, for whom the
ANDR was lower (15.9‰ [95% CI: 15.2–16.5]). This significant difference was also maintained at different f-Hb
cut-offs. The ANDR was higher in older groups in both
sexes, with significant differences by sex for all f-Hb cutoffs (Tables 4 and 5). In any case, the ANDR in men over
60 years remained higher than that of women.
Colonoscopy savings and the risk of losses in the
detection of advanced colorectal Neoplasia
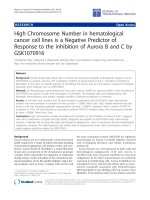
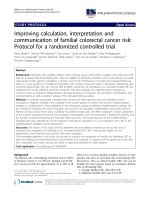
A lower NNS to detect one AN (59; 95% CI: 56–63) was
seen in men at a f-Hb cut-off 20 μg Hb/g faeces compared to 92 (95% CI: 83–100) for women. On increasing
the f-Hb cut-off, NNS increased to 230 for women at a
f-Hb cut-off of 60 μg Hb/g faeces. The differences between men and women were significant at f-Hb cut-offs
of 20 and 25 μg Hb/g faeces but not at higher cut-offs
(30 and 35 μg Hb/g faeces), as shown in Fig. 2a.
A logistic regression analysis was performed to determine the risk of loss in the detection of AN by increasing the f-Hb cut-off (Fig. 2b). The risk is higher in men
than in women and this risk increases significantly upon
increasing the f-Hb cut-off from 1.49 (95% CI: 1.30–1.71)
to 1.69 (95% CI: 1.56–1.83).
The colonoscopy saved by increasing the f-Hb cut-off
in the case of women increases to 55.5% (N = 4273). As
such, the savings made in terms of colonoscopies are
10.4
36.2
13.4 (7.5)
62.4
9.8
35.4
8.0
Higher size polyps (mm); median (IQR)
Size of AA >9 mm; %
Size of AA >19 mm; %
AA with villous component; %
AA with severe/high-grade dysplasia; %
8.5
35.4
12.3
65.3
14.2 (8.5)
3.0 (2.0–5.0)
17.3/69.4/13.3
84.4 (35.4–248.4)
1614
2.7 ± 1.4
63.7/34.0/2.3
17.4/79.5/3.1
9.0
37.0
13.9
66.4
13.8 (10.4)
3.0 (2.0–5.0)
19.3/68.9/11.8
75.8 (35.6–221.8)
1348
2.9 ± 1.5
70.0/27.0/3.0
17.3/66.4/16.3
7.4
34.2
10.4
63.4
12.0 (9.7)
2.0 (1.0–3.0)
23.5/57.8/18.7
71.8 (33.4–183.4)
461
2.9 ± 1.5
69.0/22.7/8.3
20.8/65.4/13.8
72
1775
94.2
7.8
36.3
11.9
64.2
13.4 (8.6)
2.0 (1.0–3.0)
18.4/66.5/15.1
70.2 (34.2–190.2)
498
3.0 ± 1.6
54.9/41.5/3.6
22.6/66.7/10.7
172.8 (67.6–405.3)
82
1707
94.8
70.6
8.2
35.2
12.7
65.2
13.4 (8.4)
2.0 (1.0–4.0)
19.1/69.2/11.7
71.2 (30.0–186.2)
553
2.6 ± 1.8
60.5/33.7/5.8
20.9/64.3/15.1
158 (63.2–490.4)
87
2009
94.1
72.1
a
SD Standard deviation, IQR Interquartile range
Positives
b
Proximal side includes regions from cecum up to and including the transverse colon; distal side includes splenic flexure, descending colon and sigmoid colon
c
Advanced adenomas: adenomas ≥10 mm, adenoma with a villous component (i.e., tubulovillous or villous adenoma) or adenomas with severe/high-grade dysplasia
7.8
65.2
13.7 (7.9)
24.3/65.1/10.6
3.0 (2.0–5.0)
78.8 (34.8–221.9)
3.0 (1–0-4.0)
μg Hb/g faeces; median (IQR)
1250
Number polyps; median (IQR)
78.8 (34.8–223.0)
Advanced adenomas (AA)c
Location (proximal side/distal side/rectum) ; % 19.4/66.2/14.4
2.5 ± 1.6
976
Size (cm); Mean (SD)
b
66.9/27.3/5.8
75.0/20.2/4.8
Stage (I-II/III-IV/missing); %
2.5 ± 1.6
18.3/64.7/17.0
238
2658
97.4
8.9
36.8
14.1
66.1
12.9 (7.2)
2.0 (1.0–4.0)
19.5/61.2/19.3
75.6 (35.7–193.3)
516
2.9 ± 1.7
71.4/22.4/6.2
23.2/60.6/16.2
172.8 (54.38–443.7)
98
1800
93.8
69.0
Women < 55 years Women 55–60 years Women 60–65 years Women > 65 years
65.5
179.4 (56.8–536.2) 230.8 (69.6–770.4) 209.8 (70.2–682.5) 231.2 (82.4–698.7) 191.8 (77.9–542.9)
216
3238
94.8
Men > 65 years
66.8
μg Hb/g faeces; median (IQR)
Location (proximal side/distal side/rectum)b; % 19.8/69.7/10.5
155
2671
94.0
Men 60–65 years
67.9
84
2415
Men 55–60 years
63.7
Colorectal cancer (CRC)
Total number of participants
93.7
Colonoscopy compliance; %
a
59.0
Participation; %
Men < 55 years
Table 2 Characteristics of participants stratified by sex and age
Arana-Arri et al. BMC Cancer (2017) 17:577
Page 6 of 13
Arana-Arri et al. BMC Cancer (2017) 17:577
Page 7 of 13
Table 3 Characteristics of interval cancers and screen-detected colorectal cancer
Interval cancersa
Total
p-value
Screen-detected
First round
Second round
136 (83.3%; 1st round/
16.2%; 2nd round)
889
143
-
Men; n (%)
89 (65.4)
594 (66.8)
99 (69.2)
0.79
Women; n (%)
47 (34.6)
295 (33.2)
44 (30.8)
50–54; n (%)
26 (19.1)
137 (15.4)
19 (13.3)
55–59; n (%)
32 (23.5)
195 (21.9)
42 (29.4)
60–64; n (%)
45 (33.1)
260 (29.2)
43 (30.1)
65–69; n (%)
33 (24.3)
297 (33.4)
Sex
Age (years)
μg Hb/g faeces; median (IQR)
b
c
Location (proximal side/distal side/rectum) ; %
0.06
39 (27.3)
c
2.9 (0.4–11.6)
201.8 (74.4–589.8)
638.3 (56.8–617.2)c
-
34.3 / 33.6 / 32.1
18.1 / 67.0 / 14.9
21.6 / 66.3 / 12.1
<0.001
Stage (I-II/III-IV); %
44.8 / 55.2
66.7 / 28.4
65.7 / 24.6
<0.001
Size (cm); median (IQR)
8 (6.0–12.0)
2.5 (1.5–4.0)
2.5 (1.5–3.5)
<0.001
Time to diagnosis
Within 1 year; n (%)
64 (47.1)
1–2 years; n (%)
72 (52.9)
-
a
Interval cancers after a negative test result in the previous round
b
Median μg Hb/g faeces at time of negative screening test result. **Median μ Hb/g faeces at time of positive screening test result
c
Proximal side includes regions from cecum up to and including the transverse colon; distal side includes splenic flexure, descending colon and sigmoid colon
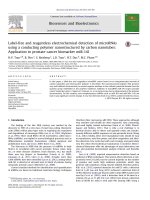
offset by the loss in detection of CRC and AA (Fig. 3).
The loss of AA in women can be as high as 43.3%
(N = 962), and 22.9% for CRC (N = 81). Around 19.1%
of the colonoscopies saved upon increasing the f-Hb
cut-off to 25 μg Hb/g faeces will have an AN, and this
percentage rises to 24.4% on increasing the f-Hb cut-off
to 60 μg Hb/g faeces It can also be seen that the CRC
missed were diagnosed mostly at an early stage (Stage III: from 70.2% in men to 66.3% in women).
Colonoscopy savings increased in all age groups on increasing the f-Hb cut-off in both sexes. However, as can
be seen from Fig. 4, there is no substantial difference in
this saving by age group (from 48.6 to 51.9% in men and
54.3 to 57.0% in women). However, an analysis of the decrease in CRDR and ANDR showed a considerable difference between age groups in both sexes. Thus, in men,
the AADR decreased by 24.1 and 10.9‰, in the oldest
group and in the youngest groups respectively, whereas
in women it decreased by 9.0‰ in the oldest group and
by 4.9‰ in the youngest. A similar pattern was observed
in CDR and, depending on the age group analysed, the
diagnoses of early-stage CRC not detected could be as
high as 86.4% in men and 80.0% in women.
Discussion
We have compared CRC screening with FIT at different
f-Hb cut-offs in a large population aged between 50 and
69 years. To our knowledge, there have been few
previous studies of sex and age related differences in
population-based FIT screening programs.
In our study, a total of 444,582 persons were invited to
participate in the Basque Country CRC Screening
Programme. This large number of participants facilitated
the performance of a reliable and robust statistical analysis to determine whether a simple, single f-Hb cut-off
should be used for different populations without increasing the interval cancer rate, thus allowing the provision
of insight for others running similar programmes.
CRC screening programmers in a number of countries
have encountered higher than expected positivity [36],
thus leading to overwhelming demand for scarce colonoscopy resources and a need to increase the f-Hb cut-off
to lower the number of referrals. In consequence, data
on the performance of FIT in men and women are of
key importance due to the current widespread and
growing use of FIT in population-based CRC screening
programmes.
We observed a higher PPV for AN and higher detection rates for CRC and AN than other programmes,
these results could be due to the high rate of compliance
to colonoscopy assessment, that allowed a minimal loss
of neoplasm detection As reported in recently published
studies [26, 37], higher positivity was found in men at
the full range of f-Hb cut-offs. This pattern is also
59.8 (58.7–61.0)
61.5 (60.3–62.6)
62.7 (61.5–64.0)
40
50
60
43.3 (41.7–45.0)
42.2 (40.6–43.7)
40.6 (39.1–42.0)
39.2 (37.8–40.5)
38.3 (37.0–39.6)
36.5 (35.2–37.7)
32.9 (31.9–34.0)
Women
< 0.0001
< 0.0001
< 0.0001
< 0.0001
< 0.0001
< 0.0001
< 0.0001
p value
8.3 (8.1–8.4)
4.2 (4.1–4.3)
4.6 (4.5–4.7)
5.3 (5.2–5.4)
5.7 (5.6–5.8)
6.2 (6.1–6.4)
6.9 (6.8–7.1)
2.1 (2.0–2.2)
2.4 (2.3–2.5)
2.7 (2.6–2.8)
3.0 (2.9–3.1)
3.3 (3.2–3.4)
3.8 (3.7–3.9)
4.8 (4.7–4.9)
Women
Positivity rate (%)
Men
< 0.0001
< 0.0001
< 0.0001
< 0.0001
< 0.0001
< 0.0001
< 0.0001
p value
5.2 (4.8–5.6)
4.1 (3.8–4.4)
4.3 (3.9–4.6)
4.5 (4.1–4.8)
4.6 (4.3–5.0)
4.7 (4.3–5.1)
4.9 (4.5–5.3)
1.7 (1.5–1.9)
1.7 (1.5–2.0)
1.9 (1.6–2.1)
1.9 (1.7–2.2)
2.0 (1.8–2.2)
2.1 (1.9–2.3)
2.2 (2.0–2.4)
Women
< 0.0001
< 0.0001
< 0.0001
< 0.0001
< 0.0001
< 0.0001
< 0.0001
p value
Colorectal cancer detection rate (‰)
Men
44.0 (42.9–45.1)
26.5 (25.7–27.4)
28.7 (27.8–29.6)
31.9 (31.0–32.8)
33.8 (32.8–34.7)
36.0 (35.0–37.0)
39.0 (38.0–40.1)
9.3 (8.8–9.8)
10.2 (9.7–10.7)
11.2 (10.7–11.7)
11.9 (11.3–12.4)
12.8 (12.3–13.4)
13.9 (13.3–14.5)
15.9 (15.2–16.5)
Women
< 0.0001
< 0.0001
< 0.0001
< 0.0001
< 0.0001
< 0.0001
< 0.0001
p value
Advanced neoplasia detection rate (‰)
Men
a
PPV applies for AN: defined as advanced adenoma (AA) plus colorectal cancer (CRC). Advanced adenomas: adenomas ≥10 mm, ≥3 adenoma, adenoma with a villous component (i.e., tubulovillous or villous adenoma)
or adenomas with severe/high-grade dysplasia
57.4 (56.3–58.4)
58.6 (57.5–59.7)
30
35
52.8 (51.9–53.7)
56.0 (55.0–57.0)
20
25
Men
Cut-off μg
Hb/g faeces
Positive predictive valuea (%)
Table 4 Test characteristics at different faecal haemoglobin concentration cut-offs by sex
Arana-Arri et al. BMC Cancer (2017) 17:577
Page 8 of 13
34.5 (32.1–36.9)
35.7 (33.1–38.3)
36.4 (33.7–39.1)
38.0 (35.1–40.9)
39.9 (36.8–43.0)
40.8 (37.5–44.2)
25
30
35
40
50
60
1.8 (1.6–1.9)
60
2.9 (2.8–3.1)
3.3 (3.1–3.4)
3.7 (3.6–3.9)
4.1 (3.9–4.3)
4.5 (4.3–4.7)
5.0 (4.8–5.2)
6.1 (5.9–6.3)
1.3 (1.0–1.6)
60
1.6 (1.2–1.9)
1.7 (1.3–2.1)
1.8 (1.5–2.3)
1.9 (1.5–2.3)
1.9 (1.5–2.3)
2.0 (1.6–2.4)
2.2 (1.7–2.6)
0.328
0.241
0.150
0.127
0.127
0.107
0.053
7.2 (6.5–8.0)
60
2.0 (1.6–2.4)
16.0 (14.8–17.2) < 0.0001 8.9 (8.0–9.8)
17.2 (15.9–18.4) < 0.0001 9.7 (8.8–10.7)
19.1 (17.8–20.4) < 0.0001 10.7 (9.7–11.7)
20.3 (19.0–21.7) < 0.0001 11.4 (10.4–12.4)
21.9 (20.5–23.3) < 0.0001 12.3 (11.2–13.3)
23.9 (22.5–25.4) < 0.0001 13.1 (12.0–14.2)
26.9 (15.3–28.5) < 0.0001 15.0 (13.8–16.2)
1.7 (1.3–2.0)
1.7 (1.3–2.1)
1.8 (1.4–2.2)
1.9 (1.5–2.3)
2.0 (1.5–2.4)
24.5 (22.9–26.1)
26.7 (25.1–28.4)
30.0 (28.2–31.8)
31.5 (29.6–33.3)
33.6 (31.7–35.4)
36.5 (34.6–38.5)
41.3 (39.2–43.4)
3.6 (3.0–4.2)
3.7 (3.1–4.4)
3.9 (3.3–4.6)
4.0 (3.3–4.7)
4.1 (3.4–4.8)
4.3 (3.6–5.0)
4.5 (3.8–5.2)
3.9 (3.7–4.1)
4.4 (4.2–4.6)
5.0 (4.8–5.3)
5.4 (5.2–5.7)
6.0 (5.7–6.2)
6.6 (6.4–6.9)
7.9 (7.7–8.2)
62.3 (59.8–64.9)
60.9 (58.5–63.4)
58.0 (55.8–60.2)
56.4 (54.3–58.5)
55.2 (53.1–57.2)
55.2 (50.1–53.8)
< 0.0001 9.7 (8.7–10.7)
< 0.0001 10.7 (9.7–11.7)
< 0.0001 11.4 (10.4–12.4)
< 0.0001 12.1 (11.1–13.2)
< 0.0001 13.0 (11.9–14.1)
< 0.0001 14.4 (13.2–15.5)
< 0.0001 16.9 (15.6–18.2)
< 0.0001 1.7 (1.3–2.1)
< 0.0001 1.8 (1.4–2.2)
< 0.0001 2.0 (1.5–2.4)
< 0.0001 2.0 (1.6–2.5)
< 0.0001 2.1 (1.6–2.5)
< 0.0001 2.1 (1.7–2.6)
< 0.0001 2.3 (1.8–2.7)
< 0.0001 2.3 (2.1–2.4)
< 0.0001 2.5 (2.4–2.7)
< 0.0001 2.9 (2.8–3.1)
< 0.0001 3.2 (3.0–3.4)
< 0.0001 3.6 (3.0–3.4)
< 0.0001 4.1 (4.0–4.3)
< 0.0001 5.3 (5.1–5.5)
< 0.0001 42.3 (39.1–45.5)
< 0.0001 42.0 (39.0–45.0)
< 0.0001 38.8 (36.1–41.6)
< 0.0001 37.8 (35.1–40.4)
< 0.0001 36.3 (33.8–38.8)
< 0.0001 34.6 (32.3–36.9)
< 0.0001 32.0 (30.0–34.0)
32.8 (30.9–34.7)
35.2 (33.3–37.1)
39.0 (37.0–47.1)
35.6 (33.7–37.5)
44.0 (41.9–46.1)
47.9 (45.7–50.2)
53.6 (51.2–55.9)
5.0 (4.3–5.8)
5.3 (4.5–6.0)
5.5 (4.8–6.3)
5.8 (5.0–6.6)
5.9 (5.1–6.7)
6.1 (5.3–6.9)
6.4 (5.6–7.3)
5.0 (4.8–5.2)
5.5 (5.2–5.7)
6.2 (6.0–6.5)
6.7 (6.5–7.0)
7.3 (7.0–7.5)
8.1 (7.8–8.3)
9.5 (9.2–9.8)
65.6 (63.4–67.8)
64.2 (62.1–66.3)
62.7 (60.7–64.7)
52.8 (50.8–54.8)
60.4 (58.5–62.3)
59.5 (57.7–61.3)
56.4 (54.7–58.0)
< 0.0001 12.9 (11.7–14.2)
< 0.0001 14.5 (13.1–15.8)
< 0.0001 16.0 (14.6–17.5)
< 0.0001 16.8 (15.4–18.2)
< 0.0001 18.0 (16.5–19.5)
< 0.0001 19.6 (18.0–21.2)
< 0.0001 21.9 (20.3–23.6)
< 0.0001 2.5 (2.0–3.1)
< 0.0001 2.6 (2.0–3.2)
< 0.0001 2.8 (2.2–3.4)
< 0.0001 2.9 (2.3–3.5)
< 0.0001 3.0 (2.4–3.6)
< 0.0001 3.2 (2.6–3.9)
< 0.0001 3.5 (2.8–4.1)
< 0.0001 2.8 (2.7–3.0)
< 0.0001 3.3 (3.1–3.5)
< 0.0001 3.7 (3.5–4.0)
< 0.0001 4.1 (3.8–4.3)
< 0.0001 4.5 (4.3–4.7)
< 0.0001 5.0 (4.8–5.3)
< 0.0001 6.2 (6.0–6.5)
< 0.0001 45.4 (42.1–48.7)
< 0.0001
< 0.0001
< 0.0001
< 0.0001
< 0.0001
< 0.0001
< 0.0001
< 0.0001
< 0.0001
< 0.0001
< 0.0001
< 0.0001
< 0.0001
37.1 (34.9–39.4) < 0.0001
40.4 (38.1–42.8) < 0.0001
44.6 (42.1–47.1) < 0.0001
47.6 (45.0–50.1) < 0.0001
50.1 (47.5–52.8) < 0.0001
54.2 (51.5–56.9) < 0.0001
61.2 (58.3–64.1) < 0.0001
7.6 (6.5–8.6)
7.8 (6.8–8.9)
8.0 (7.0–9.1)
8.3 (7.2–9.4)
8.4 (7.3–9.5)
8.7 (7.6–9.8)
9.3 (8.1–10.4)
5.5 (5.2–5.8)
6.1 (5.8–6.4)
6.9 (6.6–7.2)
7.5 (7.2–7.8)
8.1 (7.8–8.5)
9.0 (8.7–9.4)
10.7 (10.3–11.0) < 0.0001
67.3 (64.9–69.7) < 0.0001
66.0 (63.7–68.3) < 0.0001
64.3 (62.1–66.5) < 0.0001
< 0.0001 42.8 (40.0–45.7)
< 0.0001 44.4 (41.3–47.5)
63.3 (61.2–65.4) < 0.0001
61.7 (59.6–63.7) < 0.0001
60.2 (58.2–62.1) < 0.0001
< 0.0001 41.3 (38.5–44.0)
< 0.0001 40.2 (37.6–42.8)
< 0.0001 38.9 (36.5–41.4)
p value
57.4 (55.6–59.2) < 0.0001
Women >65 years Men >65 years
< 0.0001 35.2 (33.0–37.3)
Women 60–65 years Men 60–65 years p value
a
PPV applies for AN: defined as advanced adenoma (AA) plus colorectal cancer (CRC). Advanced adenomas: adenomas ≥10 mm, ≥3 adenoma, adenoma with a villous component (i.e., tubulovillous or
villous adenoma) or adenomas with severe/high-grade dysplasia
8.6 (7.8–9.4)
9.1 (8.2–9.9)
35
7.9 (7.1–8.7)
9.9 (9.0–10.7)
30
40
10.8 (9.9–11.8)
25
50
12.1 (11.1–13.0)
20
Advanced Neoplasia (AN) Detection Rate [‰ (95% CI)]
1.4 (1.1–1.8)
1.4 (1.0–1.7)
40
1.5 (1.1–1.8)
35
50
1.5 (1.2–1.9)
1.5 (1.1–1.8)
25
30
1.6 (1.2–2.0)
20
2.1 (1.7–2.6)
< 0.0001 2.0 (1.8–2.1)
< 0.0001 2.2 (2.1–2.4)
< 0.0001 2.5 (2.3–2.6)
< 0.0001 2.7 (2.6–2.9)
< 0.0001 3.0 (2.8–3.2)
< 0.0001 3.4 (3.3–3.6)
< 0.0001 4.4 (4.2–4.6)
54.2 (51.4–57.0) < 0.0001 45.1 (41.7–48.6)
52.5 (49.9–55.2) < 0.0001 43.6 (40.4–46.8)
50.9 (48.4–53.4) < 0.0001 42.9 (39.8–45.9)
49.9 (47.5–52.2) < 0.0001 41.6 (38.8–44.5)
49.1 (46.8–51.4) < 0.0001 40.8 (38.1–43.6)
47.7 (45.5–49.9) < 0.0001 38.2 (35.6–40.7)
51.9 (50.1–53.8)
Women 55–60 years Men 55–60 years p value
44.0 (42.0–45.9) < 0.0001 34.2 (32.0–36.4)
p value
Colorectal Cancer (CRC) Detection Rate [‰ (95% CI)]
2.3 (2.1–2.4)
2.0 (1.9–2.1)
40
2.5 (2.4–2.6)
35
50
3.1 (3.0–3.3)
2.8 (2.6–2.9)
25
30
3.9 (3.8–4.1)
20
Positivity rate [%(95% CI)]
30.6 (28.5–32.7)
20
Cut-off μg
Women <55 years Men <55 years
Hb/g faeces
Positive predictive valuea [%(95% CI)]
Table 5 Test characteristics at different faecal haemoglobin concentration by sex and age group
Arana-Arri et al. BMC Cancer (2017) 17:577
Page 9 of 13
Arana-Arri et al. BMC Cancer (2017) 17:577
a
Page 10 of 13
b
Fig. 2 Number Needed to Screen to detect Advanced Neoplasia (AN) (a) and the Odds Ratio for the loss in detection of AN (b) Men versus
women through increasing the faecal haemoglobin cut-off. (*p < 0.001; †p < 0.05; ‡no significance). (¥Cut-off 50 μg Hb/g faeces in men = 509
[95% CI: 333–1000])
consistent when comparing older men and women
against younger ones, with these variables being higher
in older groups. A decision on whether to adjust the age
at which screening begins also requires taking into consideration whether the recommended age for men
should be younger or the recommended age for women
older. In this regard, Sung et al. [38], in the Asia Pacific
consensus recommendations for CRC screening, suggested that women may start screening at later ages due
to the relatively low incidence of CRC at 50–55 years.
Similarly, Brenner suggested that the optimal age for
screening initiation should be five years younger for men
than for women. Despite this, European guidelines recommend that screening programs for CRC should start
at age 50 years for both men and women of average risk
[10]. However, the question of using different f-Hb cutoffs for men and women and/or younger and older participants remains unsolved. Differences in the epidemiological pattern of CRC among sexes have been identified
during the last years [39]. Hence, it is a matter of discussion if the screening must be implemented on the basis
of same sex, age and f-Hb cut-off.
Recent studies [22, 27] have concluded that FIT has a
higher sensitivity and a lower specificity for CRC in men
than in women and therefore that equal test characteristics can be achieved by allowing different f-Hb cut-offs
for the sexes. However, Kapidzic et al. [26], observed
that there were no significant differences between men
Fig. 3 Relation between saving colonoscopies (SC) and lesion loss upon increasing the faecal haemoglobin concentration cut-off by sex. Dotted
lines represent lesion detection rates (for colorectal cancer (CRC) and advanced adenoma (AA)) and solid lines saved colonoscopies. The left Y axis
represents lesion detection rate and the right Y axis the percentage of colonoscopies saved. Saving Colonoscopies: the percentage of colonoscopies
that will not be performed in the programme by increasing the f-Hb cut-off, due to the reduction of positivity rate
Arana-Arri et al. BMC Cancer (2017) 17:577
Page 11 of 13
Fig. 4 Relation between saving colonoscopies (SC) and lesion losses upon increasing the cut-off level of the FIT by sex and age group. Dotted
lines express lesion detection rates (colorectal cancer (CRC) and advanced adenoma (AA)) and solid lines saved colonoscopies. The left Y-axis
represents lesion detection rate and the right axis the percentage of colonoscopies saved. Saving Colonoscopies: the percentage of colonoscopies
that will not be performed in the programme by increasing the f-Hb cut-off, due to the reduction of positive rate
and women in PPV at a f-Hb cut-off of 10 μg Hb/g faeces, thus meaning that the chance that a colonoscopy is
unnecessary after a positive test result is the same. It
was suggested that, if the same differences were to persist between men and women in a larger sample, the differences in PPV would become significant, and this is
exactly what we have observed in our study, in which
the differences between men and women have remained
statistically significant. However, can we therefore argue
that it would be better to increase the f-Hb cut-off for
women? According to the results of Kapidzic et al. [26],
the PPV could be improved using a higher f-Hb cut-off in
women; however, this would be at the expense of increasing the NNS as this increases at higher f-Hb cut-offs.
It may take approximately 10 years from the appearance of the first lesion with abnormal histopathology to
develop a possible malignant lesion. In 2007, Brenner et
al. [39] showed that the risk of transition from AA to
CRC was similar for men and women, but increased
with age. Some studies [40, 41] have reported significantly higher detection rates for AN and CRC with colonoscopy for men than for women in all age groups,
thus suggesting that male sex constitutes an independent
risk factor for colorectal neoplasia. Such studies recommended sex-specific ages for screening. These differences are similar to those observed in our study.
Colonoscopy resource can be key to defining the strategies and characteristics adopted in screening programmes.
Indeed, the additional number of colonoscopies that need
to be performed may become an important factor when
deciding whether to establish any such programme. We
observed that the saving in colonoscopies increased consistently in both sexes and in all age groups as the f-Hb cutoff was increased. It might seem appropriate to increase the
f-Hb cut-off since this would a lower the number of
colonoscopies required. However, when increasing the f-Hb
cut-off, the risk of lowering the ANDR increases significantly in both sexes and in all age groups. The proportion
of IC could be higher in men than in women and in older
groups. Thus, an increase in the f-Hb cut-off could increase
the loss from 7.9 to 28.1% in men and from 5.1 to 22.9%
CRC in women. This loss in the detection of CRC is consistent over all age groups. Moreover, taking into account
that most of those with CRC would be diagnosed in their
early stages, this would go against the principles of preventive screening programmes. These results are consistent
with those published recently by Digby et al. [42], who concluded that CRC screening programmes would benefit from
using low f-Hb cut-off to gain lower IC proportions as well
as higher sensitivity and detection of earlier stage disease,
but at the cost of increased demand for colonoscopy.
Recent studies suggested the potential benefits of
using a risk prediction model including f-Hb in CRC
screening [18, 29, 31, 43] to improve the effectiveness of
screening strategies. Future studies performed should
therefore be designed to evaluate the benefits of implementing models according to the different risks of different groups according to sex and age. Some studies have
suggested that other factors could be used to determine
the optimal cut-off values for men and women, and that
the combination of these data with microsimulation
models could improve the implementation of screening
programmes [28, 44].
One of the main strengths of the current study was
the large number of participants evaluated, all of whom
were recruited in an organized, population-based
screening programme, coordinated and systematically
evaluated at a single centre. The lack of studies published to date with real data from such a FIT-based
programme and with a participation rate of more than
Arana-Arri et al. BMC Cancer (2017) 17:577
65% (the level recommended in the European guidelines
[10]) is also worth noting.
However, several limitations have to be acknowledged.
The study included assessment of the effects of sex and
age but no other possible confounding factors, such as
socio-economic status which has been shown to affect
f-Hb [36, 45], though they could be retrospectively
explored on the basis of a case/control nested analysis. Furthermore, Brenner [38] suggested that appropriate differentiation of age at initiation of CRC
screening by sex might be equally or more relevant
from a public health point of view than the widely
used differentiation by family history.
Conclusions
In conclusion, this population-based study provides relevant information on the performance of a realistic FITbased colorectal screening programme in men and
women at different f-Hb cut-offs. Men have higher PPV,
CDR and ANDR, which results in a lower NNS when
compared to women, and this pattern is consistent when
comparing younger and older groups. However, given
the assessed loss in detection of AN and CRC, most of
them in their early stages, it may be that the f-Hb cutoff that is going to be implemented should not be
change only by sex or age, at least initially, in accordance
with the recommendations of the European guidelines,
in order not to increase the ratio of interval cancers,
which is another important variable to examine.
Abbreviations
AA: Advanced adenoma; AN: Advanced colorectal neoplasia;
ANDR: Advanced neoplasia detection rate; CDR: Cancer detection rate;
CRC: Colorectal cancer; f-Hb: Faecal haemoglobin concentration; FIT: Faecal
immunochemical test; FOBT: Faecal occult blood test; Hb: Haemoglobin;
IC: Interval cancers; NNS: Number needed to screen to detect one case;
PPV: Positive predictive value; SD-C: Screen-detected cancers
Acknowledgements
Euskolon Group: José Luis Hurtado, Carmen de No, Carlos Enciso, Maite
Escalante, Begoña Atarés, José Javier Aguirre, Esther Pereda, Edurne Marañón,
Pedro Otazua, María Fernández, José Francisco Egido, Eva Zapata, Leire Zubiaurre,
Juana Mari Rodríguez, Pedro Esteban Sampedro, Marisa Goyeneche, José María
Arrinda, Mari Luz Jauregui, Marta Gómez, Marta Saiz, Luis Bujanda, Inés Gil, Isabel
Montalvo, José Miguel Larzabal, Maddi Garmendia, Fernando Izquierdo, Francisco
Javier Fernández, Iago Rodríguez, Alain Huerta, Eduardo de Miguel, Inmaculada
Barredo, Fidencio Bao, Anaiansi Hernández, Isabel Rodriguez, María José
Fernández-Landa, María Imaz, Angel Calderón, Francisco Polo, Nagore Arbide,
Gaspar Lantarón, Cristina Quesada, Itziar Marzana, Enrique Ojembarrena, Haritz
Cortés, Iñaki Casado, Manuel Zaballa, Mar Ramírez, Amaia Aperribay, Cristian
Amezaga, Lorea Martínez-Indart, Iraide Indart, Ariane Imaz-Ayo, Natale Imaz-Ayo,
María José Fernández-Landa, Marta de la Cruz, Joseba Bidaurrazaga, Nerea
Muniozguren, Nerea Larrañaga, Covadonga Audicana, Isabel Bilbao, José Luis
Bilbao, Eduardo Millán, Saloa Unanue, Nere Mendizábal, Carlos Saiz,
Santiago Rodríguez.
Availability for data and materials
The datasets used and/or analyzed during the current study are available
from the corresponding author on reasonable request.
Funding
No specific funding was received for this study.
Page 12 of 13
Authors’ contributions
EAA, BU, RP, II, IPV and IIR conceived the idea for this analysis. The data used
for this analysis stem from a study that was designed and conducted by EAA
and IGI collaborated on the data analysis. EAA, IGI and IPV drafted the
manuscript. CGF critically reviewed the manuscript and gave important
intellectual input. All authors approved the final version of the manuscript.
Ethics approval and consent to participate
This study was approved by the Basque Country’s Ethics Committee.
Consent for publication
Not applicable.
Competing interests
CGF has undertaken paid consultancy with Immunostics Inc. and Kyowa-Medex
Co., Ltd., and received funding for attendance at meetings from Alpha Labs Ltd.
Other authors have none to declare.
Publisher’s Note
Springer Nature remains neutral with regard to jurisdictional claims in
published maps and institutional affiliations.
Author details
1
BioCruces Health Research Institute, Plaza Cruces 12, 48903 Barakaldo,
Bizkaia, Spain. 2Colorectal Cancer Screening Programme Coordination Center,
Bilbao, Spain. 3Clinical Biochemistry Service, Donostia University Hospital,
Basque Health Service, Donostia, Gipuzkoa, Spain. 4Clinical Biochemistry
Service, Cruces University Hospital, Basque Health Service, Barakaldo, Bizkaia,
Spain. 5Osteba, Basque Office for Health Technology Assessment, Ministry for
Health, Vitoria-Gasteiz, Spain. 6Centre for Research into Cancer Prevention &
Screening, University of Dundee, Dundee, Scotland.
Received: 27 March 2017 Accepted: 14 August 2017
References
1. Hardcastle JD, Chamberlain JO, Robinson MH, et al. Randomised controlled
trial of faecal-occult-blood screening for colorectal cancer. Lancet.
1996;348:1472–7.
2. Kronborg O, Fenger C, Olsen J, et al. Randomised study of screening for
colorectal cancer with faecal-occult-blood test. Lancet. 1996;348:1467–71.
3. Faivre J, Dancourt V, Lejeune C, et al. Reduction in colorectal cancer
mortality by fecal occult blood screening in a French controlled study.
Gastroenterology. 2004;126:1674–80.
4. Mandel JS, Bond JH, Church TR, et al. Reducing mortality from colorectal
cancer by screening for fecal occult blood. Minnesota colon cancer control
study. N Engl J Med. 1993;328:1365–71.
5. Zauber AG, Winawer SJ, O’Brien MJ, et al. Colonoscopic polypectomy and
long-term prevention of colorectal-cancer deaths. N Engl J Med.
2012;366:687–96.
6. International Agency for Research on Cancer (World Health Organization).
EUCAN. 2015. (Accessed
25 July 2015).
7. Council Recommendation of 2 December 2003 on Cancer Screening
(2003/878/EC). Official Journal of the European Union 16.02.2003. L327/34.
/>screening.pdf. (Accessed 25 July 2015).
8. Guittet L, Bouvier V, Mariotte N, et al. Comparison of a guaiac based and
immunochemical faecal occult blood test in screening for colorectal cancer
in a general average risk population. Gut. 2007;56:210–4.
9. Van Rossum LG, van Rijn AF, Laheij RJ, et al. Random comparison of guaiac
and immunochemical fecal occult blood test for colorectal cancer in a
screening population. Gastroenterology. 2008;135:82–90.
10. Segnan N, Patnick J, von Karsa L. European Commission. European
guidelines for quality assurance in colorectal cancer screening and
diagnosis. Brussels: European Commission; 2011. p. 277.
11. Halloran SP, Launoy G, Zappa M. European guidelines for quality assurance
in colorectal cancer screening and diagnosis. First edition. Faecal occult
blood testing. Endoscopy. 2012;44:SE65–87.
Arana-Arri et al. BMC Cancer (2017) 17:577
12. Ventura L, Mantellini P, Grazzini G, et al. The impact of immunochemical
faecal occult blood testing on colorectal cancer incidence. Dig Liver Dis.
2014;46:82–6.
13. Giorgi Rossi P, Vicentini M, Sacchettini C, et al. Impact of screening program
on incidence of colorectal cancer: a cohort study in Italy. Am J
Gastroenterol. 2015;110(9):1359–66.
14. Lee JK, Liles EG, Bent S, et al. Accuracy of fecal immunochemical test for
colorectal cancer. Systematic review and meta-analysis. Ann Intern Med.
2014;160:171–81.
15. García M, Milà N, Binefa G, et al. False-positive results from colorectal cancer
screening in Catalonia (Spain), 2000-2010. J Med Screen. 2012;19:77–82.
16. Stegeman I, Wijkerslooth TR, Stoop EM, et al. Risk factors for false positive
and for false negative test results in screening with fecal occult blood
testing. Int J Cancer. 2013;133:2408–14.
17. Denters MJ, Deutekom M, Essink-Bot ML, et al. FIT false-positives in colorectal
cancer screening experience psychological distress up to 6 weeks after
colonoscopy. Support Care Cancer. 2013;21:2809–15.
18. Ming-Fang A, Li-Sheng S, Yueh-Hsia S, et al. A new insight into fecal
haemoglobin concentration-dependent predictor for colon neoplasia.
Int J Cancer. 2014;135:1203–12.
19. Steele RJC, McDonald P, Digby J, et al. Clinical outcomes using a faecal
immunochemical test for haemoglobin as first-line test in a national
programme constrained by colonoscopy capacity. UEG J. 2013;1:198–205.
20. Portillo I, Idigoras I, Ojembarrena E, et al. Lesiones detectadas en el
programa de cribado de cáncer colorrectal en el País Vasco: primera ronda
2009-2011. Gastroenterol Hepatol. 2013;36:301–8.
21. Izarzugaza MI, Martínez R, Audícana C, Larrañaga N, Hernández E, Tobalina MC,
et al. (2010). Cancer in the Basque Country. Incidence, mortality, survival and
their trends. Vitoria-Gasteiz: Department of Health of the Basque Government,
Servicio Central de Publicaciones del Gobierno Vasco, 126. Available at:
/>5463/adjuntos/cancer_en.pdf. (Accessed 20 Feb 2016).
22. Massat NJ, Moss SM, Halloran SP, Duffy SW. Screening and primary
prevention of colorectal cancer: a review of sex-specific and site-specific
differences. J Med Screen. 2013;20:125–48.
23. van Turenhout OFA, van der Hulst RWM, et al. Prospective cross-sectional
study on faecal immunochemical tests: sex specific cut-off values to obtain
equal sensitivity for colorectal cancer? BMC Gastroenterol. 2014;14:1–10.
24. Fraser CG, Rubeca T, Rapi S, Chen LS, Chen HH. Faecal haemoglobin
concentrations vary with sex and age, but data are not transferable across
geography for colorectal cancer screening. Clin Chem Lab Med.
2014;52:1211–6.
25. Alvarez-Urturi C, Andreu M, Hernandez C, Perez-Riquelme F, Carballo F,
Ono A, Cruzado J, Cubiella J, Hernandez V, Mao CG, Perez E, Salas D,
Andrés M, Bujanda L, Portillo I, Sarasqueta C, Quintero E, Morillas JD,
Lanas A, Sostres C, Augé JM, Castells A, Bessa X; COLONPREV study
investigatorsImpact of age- and gender-specific cut-off values for the fecal
immunochemical test for hemoglobin in colorectal cancer screening.
Dig Liver Dis 2016;pii: S1590-8658(15)30040-30042.
26. Kapidzic A, van de Meulen P, Hol L, et al. Gender differences in fecal
immunochemical test performance for early detection of colorectal
neoplasia. Clin Gastroenterol Hepatol. 2015;13:1464–71.
27. Symonds EL, Osborne J, Cole SR, Bampton P, Fraser R, Young GP. Gender
differences in faecal haemoglobin concentration. J Med Screen. 2016;23(1):54.
28. Wilschut JA, Habbema JDF, van Leerdam E, et al. Fecal occult blood testing
when colonoscopy capacity is limited. J Natl Cancer Inst. 2011;103:1741–51.
29. Auge JM, Pellise M, Escudero JM, et al. Risk stratification for advanced
colorectal neoplasia according to fecal haemoglobin concentration in
colorectal cancer screening program. Gastroenterology. 2014;147:628–36.
30. Stegeman I, Wijkerslooth TR, Stoop EM, et al. Combining risk factors with
faecal immunochemical test outcome for selecting CRC screenees for
colonoscopy. Gut. 2014;63:466–71.
31. Steele RJ, McClements P, Watling C, et al. Interval cancers in a FOBT-based
colorectal cancer population screening programme: implications for stage,
gender and tumour site. Gut. 2012;61:576–81.
32. Kaminski MF, Regula J, Kraszewska E, et al. Quality indicators for colonoscopy
and the risk of interval cáncer. N Engl J Med. 2010;362:1795–803.
33. Ministerio de Sanidad y Consumo. The National Health System Cancer
Strategy. Madrid, update 2009. Madrid, Spain: Ministerio de Sanidad y
Consumo. p. 2009. />SNS/pdf/ActualizacionEstrategiaCancer.pdf. (Accessed 25 July 2015).
Page 13 of 13
34. Zubero MB, Arana-Arri E, Pijoán JI, et al. Population-based colorectal cancer
screening: comparison of two fecal occult blood test. Front Pharmacol.
2014;4(175):1–8.
35. Edge SB, Compton CC. The American Joint Committee on Cancer: the 7th
editiion of the AJCC cancer staging manual and the future of TNM. Ann
Surg Oncol. 2010;17(6):1471–1474.
36. Symonds EL, Osborne JM, Cole SR, et al. Factors affecting faecal immunochemical
test positive rates: demographic, pathological, behavioural and environmental
variables. J Med Screen. 2015;22:187–93.
37. Fraser CG. Assessment of faecal haemoglobin concentration distributions in
vital for faecal immunochemical test (FIT)-based colorectal cancer screening
programmes. J Med Screen. 2016;23:52–3.
38. Sung JJ, Lau JY, Young GP, et al. Asia Pacific consensus recommendations
for colorectal cancer screening. Gut. 2008;57:1166–76.
39. Brenner H, Hoffmeister M, Stegmaler C, et al. Risk of progression of
advanced adenomas to colorectal cancer by age and sex: estimates based
on 840,149 screening colonoscopies. Gut. 2007;56:1585–9.
40. Flerlitsch M, Reinhart K, Pramhas S, et al. Sex-specific prevalence of
adenomas, advanced adenomas, and colorectal cancer in individuals
undergoing screening colonoscopy. JAMA. 2011;306:1352–8.
41. Regula J, Rupinski M, Kraszewska E, et al. Colonoscopy in colorectal-cancer
screening for detection of advanced adenomas. N Engl J Med.
2006;355:1863–72.
42. Digby J, Fraser CG, Carey FA, et al. Interval cancers using a quantitative
faecal immunochemical test (FIT) for haemoglobin when colonoscopy
capacity is limited. J Med Screen 2016;23(3):130–134.
43. Kim NH, Kwon MJ, Kim HY, et al. Fecal haemoglobin concentration is useful
for risk stratification of advanced colorectal neoplasia. Dig Liver Dis.
2016;48(6):667–672.
44. Lansdorp-Vogelaar I, Kuntz KM, Knudsen AB, et al. Contribution of screening
and survival differences to racial disparities in colorectal cancer rates. Cancer
Epidemiol Biomark Prev. 2012;21:728–36.
45. Digby J, McDonald PJ, Strachan JA, Libby G, Steele RJ, Fraser CG.
Deprivation and faecal haemoglobin: implications for bowel cancer
screening. J Med Screen. 2014;21(2):95–7.
Submit your next manuscript to BioMed Central
and we will help you at every step:
• We accept pre-submission inquiries
• Our selector tool helps you to find the most relevant journal
• We provide round the clock customer support
• Convenient online submission
• Thorough peer review
• Inclusion in PubMed and all major indexing services
• Maximum visibility for your research
Submit your manuscript at
www.biomedcentral.com/submit