Cancer-related risk factors and incidence of major cancers by race, gender and region; analysis of the NIH-AARP diet and health study
Bạn đang xem bản rút gọn của tài liệu. Xem và tải ngay bản đầy đủ của tài liệu tại đây (708.7 KB, 11 trang )
Akinyemiju et al. BMC Cancer (2017) 17:597
DOI 10.1186/s12885-017-3557-1
RESEARCH ARTICLE
Open Access
Cancer-related risk factors and incidence of
major cancers by race, gender and region;
analysis of the NIH-AARP diet and health
study
Tomi Akinyemiju1,2,3*, Howard Wiener1 and Maria Pisu2,4
Abstract
Background: Racial disparities in the incidence of major cancers may be attributed to differences in the prevalence
of established, modifiable risk factors such as obesity, smoking, physical activity and diet.
Methods: Data from a prospective cohort of 566,398 adults aged 50–71 years, 19,677 African-American and 450,623
Whites, was analyzed. Baseline data on cancer-related risk factors such as smoking, alcohol, physical activity and
dietary patterns were used to create an individual adherence score. Differences in adherence by race, gender
and geographic region were assessed using descriptive statistics, and Cox proportional hazards models were
used to determine the association between adherence and cancer incidence.
Results: Only 1.5% of study participants were adherent to all five cancer-related risk factor guidelines, with marked race-,
gender- and regional differences in adherence overall. Compared with participants who were fully adherent to all
five cancer risk factor criteria, those adherent to one or less had a 76% increased risk of any cancer incidence
(HR: 1.76, 95% CI: 1.70 – 1.82), 38% increased risk of breast cancer (HR: 1.38, 95% CI: 1.25 – 1.52), and
doubled the risk of colorectal cancer (HR: 2.06, 95% CI: 1.84 – 2.29). However, risk of prostate cancer was
lower among participants adherent to one or less compared with those who were fully adherent (HR: 0.79,
95% CI: 0.75 – 0.85). The proportion of cancer incident cases attributable to low adherence was higher among
African-Americans compared with Whites for all cancers (21% vs. 19%), and highest for colorectal cancer (25%) regardless
of race.
Conclusion: Racial differences in the proportion of cancer incidence attributable to low adherence suggests unique
opportunities for targeted cancer prevention strategies that may help eliminate racial disparities in cancer burden among
older US adults.
Keywords: Cancer-related risk factors, Cancer incidence, Obesity, Diet, Physical activity
Background
Colorectal, prostate and breast cancer are three of the
four most common cancers among adults in the U.S.
Combined, they are estimated to account for over
560,000 new cases and 115,000 deaths due to cancer in
2016 [1]. Advances in our understanding of risk factors,
* Correspondence:
1
Department of Epidemiology, University of Alabama at Birmingham,
Birmingham, AL, USA
2
Comprehensive Cancer Center, University of Alabama at Birmingham,
Birmingham, AL, USA
Full list of author information is available at the end of the article
screening techniques and cancer treatment have led to
significant declines in incidence and mortality over the
past several decades. However, African-Americans remain at disproportionately higher risk of developing
prostate [2] and colorectal [3] cancers, and when diagnosed tend to have highly aggressive cancer phenotypes
compared with whites [4, 5]. The fundamental cause of
disparities in cancer incidence has been the subject of
vigorous investigations for many years, however these
racial differences have persisted. Differences in racially,
socio-economically and geographically patterned etiologic
© The Author(s). 2017 Open Access This article is distributed under the terms of the Creative Commons Attribution 4.0
International License ( which permits unrestricted use, distribution, and
reproduction in any medium, provided you give appropriate credit to the original author(s) and the source, provide a link to
the Creative Commons license, and indicate if changes were made. The Creative Commons Public Domain Dedication waiver
( applies to the data made available in this article, unless otherwise stated.
Akinyemiju et al. BMC Cancer (2017) 17:597
risk factors [6–8] such as obesity (48% in AfricanAmerican versus 33% in Whites) [9] and physical inactivity (61% in African-American versus 45% in Whites) [10],
have emerged as potentially modifiable risk factors that
may contribute the observed disparities in cancer outcomes in US adults. Importantly, recent studies estimate
that up to 50% of all new breast cancer cases could be
prevented through healthy behaviors, specifically body
weight, physical activity, alcohol intake and smoking [11].
These are also critical risk factors for colorectal [12, 13]
and prostate [14, 15] cancers.
In this prospective cohort of African-American and
White older adults, we examined adherence to body
weight, physical activity, alcohol, smoking and nutrition
guidelines by race, gender and region, and estimated the
proportion of overall, breast, prostate and colorectal
cancer incidence attributable to poor adherence. Understanding the contribution of these modifiable risk factors
to cancer incidence may be useful for public health interventions focused on cancer prevention and inform
strategies to eliminate racial and/or geographic disparities in cancer risk.
Methods
Study participants
Data for this study was obtained from the prospective
National Institutes of Health-American Association of
Retired Persons (NIH-AARP) Diet and Health Study.
The cohort consists of 566,398 adults AARP members
aged 50–71 years recruited in 1995–1996 (Additional file
1: Figure S1). At enrollment, participants completed a
baseline questionnaire assessing lifestyle and behavioral
risk factors such as smoking, alcohol, physical activity
and dietary patterns. Participants with self-reported
cancer at baseline (n = 49,318), proxy respondents
(n = 15,760), death record data only (n = 4255) or who
had missing data on behavioral risk factors (40,676) and
race (9566) were excluded from analysis. The final analysis included a total of 470,000 adults; 19,677 AfricanAmerican and 450,623 Whites with no prior history of
any cancer. With a sample size of 19,677 for AfricanAmericans, we were well powered with Type 1 error of
0.05 and Type II error of 80% to detect effect sizes as
low as 1.1 and adherence levels as low as 20%.
Page 2 of 11
Cancer-related risk factors
The American Cancer Society (ACS) [17] and the World
Cancer Research Fund/American Institute for Cancer
Research (WCRF/AICR) [18] developed specific guidelines
regarding body weight, physical activity, diet, smoking and
alcohol consumption to guide cancer prevention efforts.
Here, we assessed adherence to the WCRF/AICR guidelines on five cancer-related risk factors; physical activity,
body weight, alcohol use, smoking and nutrition (fruit and
vegetable intake). We used self-reported measures obtained during enrollment based on the 12-month period
prior to enrollment. Each participant was assigned a score
of 1 if fully adherent, 0.5 if partially adherent, and 0 if not
adherent (Table 1). Each risk factor was weighted equally
and adherence scores were summed up to create a total
adherence score ranging from 0 to 5.
Statistical analysis
We assessed adherence to each cancer prevention guideline overall (by summing the total adherence score) and
for each risk factor separately. We compared baseline
characteristics and adherence by race and gender using
chi-square tests and ANOVA as appropriate. We also
examined differences in adherence by geographic region,
categorized as: Northeast, Mid-West, South, and West.
We conducted Cox proportional hazards models to determine the association between adherence and cancer
incidence, and reported the results from Cox models as
hazard ratios (HR) and 95% confidence intervals. We
examined Kaplan-Meier survival cures and found no evidence of violations of the proportional hazards assumption. All statistical models were stratified by race, and
adjusted for baseline characteristics such as age, marital
status, education, health status, and gender (for colorectal cancer). Trend tests were performed by assessing the
Table 1 Cancer related risk factors adherence criteria
Risk Factor
Adherence Guideline
Adherence
Score
Physical Activity
(# of 20 min activities)
≥5 per week
1
Obesity (BMI)
≥1 per month - < 5 per week
0.5
<1 per month
0
≥18.5 - ≤ 25 kg/m2
1
>25 - ≤ 30 kg/m2
0.5
2
Ascertainment of cancer incidence
Incident cancer cases were identified through a linkage
to state cancer registries through December 31, 2012.
Detailed information for each cancer diagnosis was obtained on diagnosis date, stage, grade, and first course of
treatment within the first year of diagnosis. Incident cancer ascertainment has been estimated to be about 90%
complete [16].
Alcohol Use
(# drinks per week)
Nutrition (Fruit and
Vegetable Servings
per day)
<18.5 or >30 kg/m
0
Women ≤7, Men ≤14
1
Women >7 - ≤ 14,
Men >14 ≤ 28
0.5
Women >14, Men >28
0
≥5
1
≥3 - < 5
0.5
<3
0
Akinyemiju et al. BMC Cancer (2017) 17:597
linear relationship between adherence and cancer incidence. Censoring occurred at the time of first primary
cancer diagnosis, loss to follow up or the end of incidence follow-up period, whichever occurred first. The
attributable risk (AR) due to adherence was calculated
from models based on individual’s region, race, background covariates, and adherence value using the appropriate model, and the counter-factual estimate for that
individual assuming the highest rate of adherence. The
proportions of individuals categorized as affected (i.e. for
which the random number did not exceed the risk
estimate) for both situations (i.e. factual and counter
factual) were divided to form a risk ratio (RR), and AR
calculated using the formula (RR-1)/RR. Confidence intervals for the AR were generated from bootstrapped
resamples of 1000 draws of random numbers from a uniform distribution and compared to the estimates, and this
was repeated for the counterfactual estimates to provide a
measure of the precision of AR estimates. All analyses were
conducted using SAS 9.4 and R statistical package.
Page 3 of 11
Table 2 Baseline Characteristics of NIH-AARP Study Participants,
1995-1996
Overall
White
AA
Age Category
< 55 years
64,491 (13.71%)
61,318 (13.61%)
3173 (16.13%)
55-59 years
106,893 (22.73%)
101,588 (22.54%)
5305 (26.96%)
60-64 years
132,005 (28.07%)
126,108 (27.99%)
5897 (29.97%)
65-69 years
150,255 (31.95%)
145,423 (32.27%)
4832 (24.56%)
> =70 years
16,656 (3.54%)
16,186 (3.59%)
470 (2.39%)
Male
280,558 (59.66%)
272,444 (60.46%)
8114 (41.24%)
Female
189,742 (40.34%)
178,179 (39.54%)
11,563 (58.76%)
Gender
Marital Status
Married
323,303 (69.11%) 314,122 (70.05%) 9181 (47.27%)
Widowed
51,660 (11.04%)
48,293 (10.77%)
3367 (17.34%)
Divorced
64,882 (13.87%)
60,310 (13.45%)
4572 (23.54%)
Separated
5483 (1.17%)
4445 (0.99%)
1038 (5.34%)
Never Married
22,508 (4.81%)
21,244 (4.74%)
1264 (6.51%)
27,821 (6.07%)
25,646 (5.83%)
2175 (11.66%)
Education
Results
< 8 years
Characteristics of study population
8-11 years
93,358 (20.37%)
89,446 (20.35%)
3912 (20.98%)
12 years/High School
46,651 (10.18%)
44,926 (10.22%)
1725 (9.25%)
Post-High School/
Some College
109,302 (23.85%) 104,369 (23.74%) 4933 (26.46%)
The majority of NIH-AARP participants were between
ages 65 to 69 years (32%), and most participants were
male (60%), married (69%) and 39% had at least a college
degree (Table 2). About 69% of participants rated their
health status as good or very good. The median followup time was 15.5 person-years (Std. Dev: 4.8) for both
African-Americans and Whites.
College or post-grad 181,132 (39.53%) 175,231 (39.86%) 5901 (31.65%)
Health Status
Excellent
81,207 (17.50%)
Very good
166,103 (35.80%) 160,658 (36.13%) 5445 (28.31%)
79,438 (17.86%)
1769 (9.20%)
Adherence to cancer-related risk factors
Good
160,182 (34.53%) 152,225 (34.23%) 7957 (41.37%)
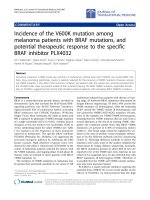
Only 1.5% of study participants were adherent to all five
cancer-related risk factor guidelines, with marked race-,
gender- and regional differences in adherence overall
(Fig. 1). Adherence to each risk factor guideline also varied significantly by gender and region (Table 3). Obesity:
Only 35% of participants met the adherence criteria for
obesity or body weight (defined as BMI between 18.5 and
25), 22% did not meet the criteria at all, and 43% were
overweight. Alcohol Use: Adherence to guidelines regarding alcohol was high, with over 98% of participants meeting the criteria i.e. consuming 7 or less alcoholic drinks
per week for females and 14 or less alcoholic drinks per
week for males. Smoking: Less than 40% of participants
were adherent to guidelines regarding smoking i.e. never
smokers, while 52% were partially adherent meaning that
they were former but not current smokers. Nutrition:
Only 26% of study participants were adherent to nutrition
guidelines, and 36.5% were totally non-adherent i.e. did
not consume at least 5 servings of fruits and vegetables
per day. Physical Activity: Only 23% of study participants
were adherent to physical activity guidelines i.e. at least
210 min of moderate physical activity per week.
Fair
48,823 (10.52%)
45,256 (10.18%)
3567 (18.55%)
Poor
7641 (1.65%)
7145 (1.61%)
496 (2.58%)
State of Residence
CA
139,633 (29.69%) 135,081 (29.98%) 4552 (23.13%)
FL
100,509 (21.37%) 98,147 (21.78%)
2362 (12.00%)
GA
13,663 (2.91%)
12,468 (2.77%)
1195 (6.07%)
LA
18,225 (3.88%)
16,901 (3.75%)
1324 (6.73%)
MI
24,420 (5.19%)
22,254 (4.94%)
2166 (11.01%)
NC
39,889 (8.48%)
37,678 (8.36%)
2211 (11.24%)
NJ
60,484 (12.86%)
57,755 (12.82%)
2729 (13.87%)
PA
73,477 (15.62%)
70,339 (15.61%)
3138 (15.95%)
Cancer Type
Any Cancer
114,392 (24.33%) 109,971 (23.99%) 4421 (22.47%)
Breast Cancer
12,698 (6.70%)
12,020 (6.75%)
678 (5,87%)
Prostate Cancer
30,664 (10.93%)
29,222 (10.73%)
1442 (17.77%)
Colorectal Cancer
10,300 (2.19%)
9845 (2.19%)
455 (2.31%)
For breast and prostate cancer, the percentages in the above table are
based on females only and males only, respectively
Akinyemiju et al. BMC Cancer (2017) 17:597
Page 4 of 11
Fig. 1 Distribution of adherence components by race and gender, stratified by region, NIH-AARP Diet and Health Study
Table 3 Adherence to Specific Cancer Risk Factors by Race, Gender and Region, NIH-AARP Diet and Health Study (%a)
Obesity
Alcohol
Smoking
Nutrition
Physical Activity
0
0.5
1
0
0.5
1
0
0.5
1
0
0.5
1
0
0.5
1
21.71
42.96
35.33
0.29
0.85
98.85
11.89
51.82
36.29
36.54
37.75
25.71
20.57
56.81
22.61
Male
20.47
49.87
29.66
0.40
1.15
98.45
10.37
59.29
30.34
35.40
38.17
26.43
16.91
58.25
24.84
Female
23.59
32.49
43.92
0.13
0.40
99.47
14.20
40.49
45.31
38.26
37.13
24.61
26.13
54.63
19.24
White
21.21
42.96
35.83
0.29
0.85
98.86
11.74
52.10
36.15
36.73
38.07
25.20
20.27
56.95
22.78
AA
34.27
42.99
22.74
0.34
0.92
98.74
15.58
44.74
39.68
31.85
29.87
38.28
28.10
53.37
18.53
Midwest
26.46
42.98
30.55
0.35
0.79
98.87
13.19
50.95
35.86
36.91
37.37
25.72
24.21
56.97
18.81
North East
23.58
44.34
32.09
0.26
0.76
98.97
11.69
50.45
37.86
33.38
38.61
28.01
23.70
56.48
19.83
Overall
Gender
Race
Region
South
20.95
43.20
35.85
0.33
0.96
98.71
12.92
52.97
34.11
38.96
36.90
24.15
19.58
57.01
23.41
West
20.11
41.38
38.51
0.29
0.89
98.83
10.60
51.83
37.56
36.46
38.07
25.47
18.27
56.86
24.87
20.27
49.87
29.85
0.40
1.14
98.46
10.23
59.41
30.36
35.44
38.38
26.18
16.73
58.31
24.96
Race-Gender
White Males
White Females
22.66
32.16
45.18
0.12
0.40
99.48
14.12
40.68
45.21
38.74
37.59
23.67
25.81
54.82
19.37
AA Males
27.55
49.68
22.76
0.45
1.52
98.03
15.50
54.89
29.61
34.01
30.66
35.33
23.46
56.04
20.50
AA Females
39.22
38.06
22.72
0.25
0.48
99.27
15.63
37.26
47.10
30.27
29.29
40.44
31.52
51.39
17.09
Risk factors defined based on WCRF/AICR criteria for adherence; 0 if not met, 0.5 if partially met and 1.0 if fully met
a
Proportion of study participants at each level of adherence
Akinyemiju et al. BMC Cancer (2017) 17:597
Adherence to guidelines and cancer incidence
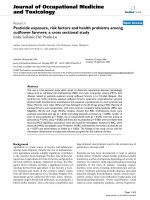
Increasing adherence to cancer prevention guidelines
was associated with progressively reduced risk of any
cancer incidence (Table 4, Fig. 2). Compared with participants who were fully adherent to all five cancer risk factor criteria, those adherent to one or less had a 76%
increased risk of cancer incidence (HR: 1.76, 95% CI:
1.70 – 1.82), those adherent to two criteria had a 53% increased risk (HR: 1.53, 95% CI: 1.49 – 1.56), and those
adherent to four had a 15% increased risk (HR: 1.15,
95% CI: 1.14 – 1.16, p-trend <0.001). Similar associations
were observed for Whites as well as African-Americans.
Breast cancer incidence increased significantly with reduced overall adherence, with a 38% increased risk of
breast cancer among participants adherent to one or no
criteria (HR: 1.38, 95% CI: 1.25 – 1.52, p-trend <0.001).
Similar magnitude of association was observed among
Whites as well as African-Americans, although the results
for African-Americans were not statistically significant.
Prostate cancer incidence appeared to be inversely associated with adherence, with a 21% reduced risk among participants adherent to only one or no criteria (HR: 0.79,
95% CI: 0.75 – 0.85, p-trend <0.001) and a 6% reduced
risk among those adherent to four criteria compared with
five (HR: 0.94, 95% CI: 0.93 – 0.96, p-trend 0.001),
although the association among African-Americans was
not statistically significant. The risk of colorectal cancer
increased by over 100% among participants adherent to
one or no criteria (HR: 2.06, 95% CI: 1.84 – 2.29, p-trend
<0.001) compared with those adherent to all five, and the
association was non-significant among AfricanAmericans. Adherence to one or none of criteria compared with all five was associated with over 100% increased risk of any cancer in the South (HR: 2.09, 95%
CI: 1.83-2.38) and North-East (HR: 2.01, 95% CI:
1.86-2.17), and a 79% and 83% increased risk in the
Mid-West and West respectively (Table 5).
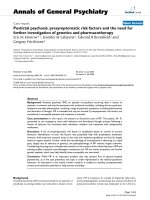
The proportion of cancer incidence attributable to low
adherence was higher among African-Americans compared with Whites for all cancers (21% vs. 19%), and
highest for colorectal cancer (25%) regardless of race.
Racial difference in the attributable fraction was observed for breast and prostate cancer: 16% of breast
cancer incidence was attributable to low adherence for
African-American and less than 8% for Whites. Notably,
18% of prostate cancer incidence was prevented due to
low adherence overall; 12% for African-American and
18% for Whites (Fig. 3).
Discussion
In one of the largest prospective cohort studies of older
adults in the US, we observed racial, gender and regional
differences in the level of adherence to AICR/WCRF
cancer-related risk factor guidelines. At baseline, adherence
Page 5 of 11
was overwhelmingly low, with less than 2% of older adults
adherent to all five criteria; less than 1% of AfricanAmerican and 1.5% of Whites met all five criteria for body
weight, physical activity, smoking, alcohol and diet. Adherence was highest in the West for obesity and physical activity, and in the North East for alcohol use, smoking and
nutrition. Cancer risk overall increased significantly with reduced adherence to the cancer-related risk factor guidelines; adherence to one or fewer criteria (relative to five)
increased the risk of all cancers by 76%, breast cancer by
38%, and colorectal cancer by 100%, however lower adherence was associated with a 21% reduced risk of prostate
cancer. Although the magnitude of the associations was
similar between African-American and Whites, the only
statistically significant association for African-Americans
was for the risk of any cancer and not for specific cancers.
Overall, lower adherence was associated with increased
cancer risk consistently across regions, except for colorectal
cancer where there was a higher but non-significant association in the Mid-West. About 20% of all cancers, 10% of
breast and 24% of colorectal cancers are attributable to low
adherence, however among White women, only 8% of
breast cancer incidence was attributable to low adherence,
compared with 18% for African-American women, and
close to 20% of prostate cancer cases were actually prevented by low adherence.
Several studies have examined the influence of cancerrelated risk factors in general, and adherence to cancer
prevention guidelines, on the risk of developing cancer
and have observed similar results to ours [19–22]. However, no other study has examined race-gender-region differences in the level of adherence among older adults, and
assessed whether the association with cancer incidence
was similar across racial groups. This gap has been a
major limitation in the previous literature for many reasons. First, given the progressively ageing population of
the US [23], the influence of modifiable lifestyle risk factors on cancer risk deserves more attention that it has received. For the most common cancers, especially breast,
prostate and colorectal, there is no single etiologic risk
factor that explains the risk of cancer development beyond
age and lifestyle related modifiable factors such as obesity,
diet, physical activity, smoking and alcohol [24]. We find
that the attributable risk due to these lifestyle risk factors
is close to 20%, i.e. about 20% of new cancer cases could
have been prevented due to complete adherence. Second,
the highly aggressive and fast growing nature of tumors
prevalent among African-Americans suggests that there
may be certain uniquely-patterned risk factors in this
population group that may only be identified with
population-specific studies [25]. Third, if cancer prevention strategies are developed focusing on specific risk
factors and targeted to race-gender-region population
sub-groups where they are most needed [26], with
0.5
0.5
0.5
1.05 (1.04 -1.06)
0.5
0.5
1.15 (1.14 -1.16) 1.15 (1.14 -1.16) 1.14 (1.09 - 1.19) 1.08 (1.06 - 1.11) 1.08 (1.06 -1.11) 1.1 (0.98 - 1.23)
<0.001
<0.001
<0.001
0.101
1.33 (1.31 -1.35) 1.31 (1.19 - 1.42) 1.18 (1.12 - 1.23) 1.18 (1.12 -1.23) 1.2 (0.96 - 1.5)
<0.001
<0.001
0.91 (0.89 -0.93)
0.82 (0.79 - .86)
0.65
0.79 (0.75-0.85)
0.001
0.97 (0.95-0.99)
0.94 (0.90-0.97)
0.254
0.70 (0.74 -0.84)
<0.001
0.96 (0.94 -0.98)
0.92 (0.88 -0.95)
0.174
1.01 (0.99 -1.03) 1.01 (0.99 -1.03)
1.02 (0.99 -1.05) 1.02 (0.99 -1.05)
<0.001
0.91 (0.89-0.93)
0.83 (0.79 -0.86
0.359
1.04 (0.96 -1.13) 1.02 (0.94 - 1.1)
All
<0.001
<0.001
<0.001
<0.001
<0.001
0.98 (0.73 - 1.33) 2.06 (1.84 -2.29)
0.68
1.02 (0.93 - 1.11) 1.15 (1.11 -1.19)
1.04 (0.87 - 1.24) 1.33 (1.24 -1.42)
0.2847
0.96 (0.91 - 1.03) 1.06 (1.03 -1.09)
0.93 (0.82 - 1.06) 1.13 (1.07 -1.19)
0.1589
0.94 (0.86 - 1.02) 1.19 (1.15 -1.23)
0.88 (0.75 - 1.05) 1.41 (1.32 -1.51)
0.89
1.02 (0.75 - 1.4) 1.42 (1.26 -1.61)
1.05 (0.56 - 1.95) 2.02 (1.59 -2.58)
0.1258
0.94 (0.87 - 1.02) 1.14 (1.11 -1.17)
2.07 (1.86 -2.32)
<0.001
1.16 (1.12 - 1.2)
1.35 (1.26 -1.44)
<0.001
1.07 (1.04 -1.09)
1.13 (1.08 - 1.2)
<0.001
1.19 (1.15 -1.23)
1.42 (1.33 -1.51)
<0.001
1.41 (1.26 -1.57)
1.99 (1.59 -2.47)
<0.001
1.14 (1.11 -1.17)
1.29 (1.2-1.37)
White
Colorectal Cancer HR (95% CI)
0.89 (0.76 - 1.03) 1.3 (1.22 - 1.38)
AA
1.64 (0.96 - 2.79)
0.3624
1.07 (0.92 - 1.25)
1.15 (0.85 -1.56)
0.2305
1.07 (0.95 - 1.2)
1.15 (0.92 - 1.44)
0.07298
1.14 (0.99 -1.31)
1.3 (0.97 - 1.73)
0.0036
1.91 (1.27 - 2.88)
3.64 (1.6 - 8.27)
0.53
1.04 (0.91 - 1.2)
1.09 (0.83 - 1.43)
AA
<0.001
<0.001
0.9207
<0.001
0.94 (0.93-0.96) 0.94 (0.93 -0.96) 0.99 (0.92 - 1.07) 1.2 (1.17 - 1.23)
<0.001
1.2 (1.17 - 1.23)
0.06741
1.13 (0.99 - 1.29)
0.89 (0.86-0.92) 0.89 (0.86 -0.92) 0.99 (0.85 - 1.15) 1.43 (1.36 -1.51) 1.44 (1.36 -1.52) 1.28 (0.98 - 1.67)
All models estimated using Cox Proportional Hazards regression and adjusted for age, gender (for colorectal cancer), marital status, and education
Abbreviations: CI confidence interval, AA African-Americans
P-trend <0.001
4
<0.001
0.93 (0.92 -0.95)
0.87 (0.84 -.89)
White
1.08 (0.92 -1.27) 1.04 (0.89 - 1.2)
<0.001
0.93 (0.91-0.95)
0.87 (0.84-0.89)
All
Prostate Cancer HR (95% CI)
1.28 (1.19 - 1.37) 1.27 (1.19 -1.37) 1.32 (0.95 - 1.84) 0.84 (0.80-0.88) 0.84 (0.79 -0.88) 0.98 (0.79 - 1.24) 1.72 (1.58 -1.86) 1.73 (1.59 -1.88) 1.45 (0.97- 2.16)
1.33 (1.3 -1.35)
1.45 (0.93 - 2.25)
0.063
1.13 (0.99 - 1.29)
1.28 (0.99 - 1.67)
0.199
1.06 (0.97 - 1.17)
1.13 (0.94 - 1.37)
0.033
1.13 (1.01 - 1.27)
1.28 (1.02 - 1.6)
0.037
1.64 (1.03 - 2.63)
2.71 (1.06 - 6.9)
0.3713
1.05 (0.94 - 1.17)
1.1 (0.89 - 1.37)
AA
3
1.38 (1.25 -1.52)
<0.001
1.05 (1.02 -1.09)
1.11 (1.05 -1.18)
0.004
1.04 (1.01 -1.06)
1.07 (1.02 -1.12)
<0.001
1.06 (1.03 -1.09)
1.12 (1.06 -1.18)
0.01763
1.22 (1.04 -1.45)
1.5 (1.07 - 2.09)
<0.001
1.07 (1.04 -1.09)
1.14 (1.09 - 1.2)
White
1.53 (1.49 -1.56) 1.53 (1.49 -1.57) 1.48 (1.3 - 1.68)
1.38 (1.26 - 1.52)
<0.001
1.06 (1.03 - 1.09)
1.12 (1.05 - 1.19)
0.01495
1.03 (1.01 - 1.06)
1.07 (1.01 - 1.12)
<0.001
1.06 (1.03 - 1.09)
1.11 (1.05 - 1.18)
<0.001
1.33 (1.12 - 1.59)
1.78 (1.26 - 2.51)
<0.001
1.08 (1.05 - 1.1)
1.16 (1.1 - 1.22)
All
Breast Cancer HR (95% CI)
1.76 (1.7 -1.82)
1.69 (1.42 - 2)
<0.001
1.09 (1.03 - 1.14)
1.18 (1.07 - 1.3)
0.025
1.04 (1.01 - 1.08)
1.09 (1.01 - 1.17)
<0.001
1.28 (1.22 - 1.34)
1.63 (1.49 - 1.79)
<0.001
1.28 (1.08 - 1.52)
1.64 (1.16 - 2.31)
0.031
0.95 (0.91 - 0.99)
0.91 (0.83 - 0.99)
AA
2
1.76 (1.7 - 1.82)
<0.001
1.07 (1.06 -1.08)
1.15 (1.13 -1.17)
<0.001
1.05 (1.05 -1.06)
1.11 (1.1 - 1.13)
0
1.31 (1.29 -1.32)
1.7 (1.67 - 1.74)
<0.001
1.24 (1.2 -1.29)
1.54 (1.44 -1.66)
<0.001
1.04 (1.03 -1.05)
1.08 (1.06 - 1.1)
White
1
Overall Adherence
P-trend <0.001
1.15 (1.13 -1.18)
1.07 (1.06 -1.09)
0
Physical Activity
P-trend <0.001
1.11 (1.09 -1.13)
0
Nutrition
P-trend 0
1.68 (1.65 -1.72)
1.3 (1.28 -1.31)
0
Smoking
P-trend <0.001
1.55 (1.43 -1.68)
1.24 (1.19 -1.29)
0
Alcohol
P-trend <0.001
1.08 (1.06 -1.1)
1.04 (1.03 -1.05)
0
Obesity
All
Any Cancer HR (95% CI)
Table 4 Association between Adherence and Any, Breast, Colorectal and Prostate Cancer Incidence by Race, NIH-AARP Diet and Health Study
Akinyemiju et al. BMC Cancer (2017) 17:597
Page 6 of 11
Akinyemiju et al. BMC Cancer (2017) 17:597
Page 7 of 11
Fig. 2 Multivariable adjusted hazard ratios (HR, 95% CI) for adherence and cancer incidence, stratified by race, NIH-AARP Diet and Health Study
considerations of unique facilitators and barriers to adherence in those sub-groups, they may be more likely to succeed compared with one-size fits all approaches to cancer
prevention [27].
The biological mechanisms linking modifiable lifestyle
factors and cancer development have been well established, including in a comprehensive review by [28].
Excess calorie intake and low physical activity are associated with increased accumulation of adipose tissue, leading to overweight and obesity [29]. These in turn lead to
hyperglycemia, hypertriglyceridemia, inflammation and
insulin resistance [30], which have been shown to increase the risk of breast and colorectal cancer incidence,
as well as the development of the more aggressive
hormone-receptor negative sub-types of breast cancer
[31, 32]. Other pathways include the alteration of circulating adipokines, altered secretion of sex hormones
such as estrogen and androgen, as well as multiple inflammatory markers such as cytokines [33]. While moderate alcohol intake has been associated with reduced
risk for some types of cardiovascular diseases [34], the
association in cancer has been most studied in relation
to breast cancer, with results suggesting a modest increase in incidence associated with higher alcohol consumption [35]. We observed that higher alcohol use was
associated with significantly increased risk of cancers in
both racial groups, however stronger associations were
observed among African-Americans compared with
Whites. African-Americans with excess alcohol use were
at more than a 100% increased risk of breast cancer, and
almost 300% increased risk of colorectal cancer compared with a 50% increased risk of breast cancer and
100% increased risk of colorectal cancer. The biological
mechanism linking this association may involve racespecific differences in alcohol metabolism, alterations in
inflammatory response and/or interactions with underlying comorbid conditions. Non-biological mechanisms
such as differences in the type of alcohol consumed (e.g.
wine, beer, spirits) or drinking patterns (e.g. binge drinking) may also play a role.
Genetic and epigenetic alterations in cancer-related
genes, influenced by lifestyle factors, have also been
shown to influence cancer tumorigenesis [36]. Nevertheless, our observation of racial differences in the proportion of breast and prostate cancer cases attributable to
adherence suggests that the same risk factor may exert
more severe biological effects on certain racial groups
compared with others, and research studies focused on
identifying the mechanisms underlying these differences,
for example due to biological interactions or synergy between cancer-related risk factors and underlying comorbidities, may provide information on the causal components
for these major cancer types.
Despite convincing evidence regarding the negative influence of obesity, smoking, and low physical activity on
health outcomes in general, and cancer risk specifically,
we observed that in 1995–1996 only about a third of
older US adults met each of the modifiable lifestyle risk
Akinyemiju et al. BMC Cancer (2017) 17:597
Page 8 of 11
Table 5 Association (HR, 95% CI) between Adherence and Any, Breast, Colorectal and Prostate Cancer Incidence by Region, NIHAARP Diet and Health Study
Adherence
All
Mid-West
North East
South
West
1
1.88 (1.82 - 1.95)
1.84 (1.59 - 2.14)
2.03 (1.91 - 2.17)
1.98 (1.87 - 2.10)
1.64 (1.54 - 1.75)
2
1.61 (1.57 - 1.65)
1.58 (1.41 - 1.77)
1.70 (1.63 - 1.79)
1.67 (1.60 - 1.75)
1.45 (1.38 - 1.52)
3
1.37 (1.35 - 1.4)
1.36 (1.26 - 1.46)
1.43 (1.38 - 1.47)
1.41 (1.37 - 1.45)
1.28 (1.24 - 1.32)
4
1.17 (1.16 - 1.18)
1.17 (1.12 - 1.21)
1.19 (1.18 - 1.21)
1.19 (1.17 - 1.20)
1.13 (1.11 - 1.15)
5
Ref
Ref
Ref
Ref
Ref
1
1.44 (1.30 - 1.59)
2.03 (1.32 - 3.12)
1.53 (1.26 - 1.85)
1.36 (1.15 - 1.61)
1.38 (1.16 - 1.64)
2
1.31 (1.22 - 1.42)
1.70 (1.23 - 2.35)
1.37 (1.19 - 1.59)
1.26 (1.11 - 1.43)
1.27 (1.12 - 1.45)
3
1.20 (1.14 - 1.26)
1.42 (1.15 - 1.77)
1.24 (1.12 - 1.36)
1.17 (1.07 - 1.27)
1.17 (1.08 - 1.28)
4
1.10 (1.07 - 1.12)
1.19 (1.07 - 1.33)
1.11 (1.06 - 1.17)
1.08 (1.04 - 1.13)
1.08 (1.04 - 1.13)
5
Ref
Ref
Ref
Ref
Ref
1
0.77 (0.72 - 0.83)
0.82 (0.62 - 1.08)
0.77 (0.68 - 0.87)
0.79 (0.71 - 0.89)
0.75 (0.66 - 0.85)
2
0.82 (0.78 - 0.87)
0.86 (0.70 - 1.06)
0.83 (0.75 - 0.90)
0.84 (0.77 - 0.91)
0.80 (0.73 - 0.88)
3
0.88 (0.85 - 0.91)
0.91 (0.79 - 1.04)
0.88 (0.83 - 0.94)
0.89 (0.84 - 0.94)
0.86 (0.81 - 0.92)
4
0.94 (0.92 - 0.95)
0.95 (0.89 - 1.02)
0.94 (0.91 - 0.97)
0.94 (0.92 - 0.97)
0.93 (0.90 - 0.96)
5
Ref
Ref
Ref
Ref
Ref
1
2.24 (2.00 - 2.52)
3.43 (2.00 - 5.88)
2.64 (2.16 - 3.24)
2.27 (1.87 - 2.75)
1.72 (1.39 - 2.14)
2
1.83 (1.68 – 2.00)
2.52 (1.68 - 3.78)
2.07 (1.78 - 2.41)
1.85 (1.60 - 2.13)
1.50 (1.28 - 1.77)
3
1.50 (1.41 - 1.59)
1.85 (1.42 - 2.42)
1.63 (1.47 - 1.80)
1.51 (1.37 - 1.66)
1.31 (1.18 - 1.46)
4
1.22 (1.19 - 1.26)
1.36 (1.19 - 1.56)
1.27 (1.21 - 1.34)
1.23 (1.17 - 1.29)
1.15 (1.09 - 1.21)
5
Ref
Ref
Ref
Ref
Ref
Any Cancer
Breast Cancer
Prostate Cancer
Colorectal Cancer
All models estimated using Cox Proportional Hazards regression and adjusted for age, race, gender (for any and colorectal cancer), marriage (ever, current), education
(high school, college degree), and state (for all regions, and multi-state regions)
Fig. 3 Attributable fraction (%, 95% CI) for adherence by race and cancer type
Akinyemiju et al. BMC Cancer (2017) 17:597
factors (except for alcohol use) [37]. These estimates
have remained consistent based on recent 2014 BRFSS
data showing that 65% of US adults were overweight/
obese, 77% consumed less than five servings of fruits
and vegetables per day, 49% did not engage in adequate
physical activity, and 18% were current smokers. The
lower levels of adherence to the risk factors observed
among African-Americans compared with Whites suggests that socio-economic differences may play a major
role [20, 38–40]. Multiple studies have observed significant associations between socio-economic status and
increased risk of cancer [38]. Our results suggest that a
possible conceptual pathway for racial disparities in cancer risk would involve race influencing socio-economic
status, which in turn influences cancer risk through adherence to cancer related risk factors [40–43]. Thus, a
realistic strategy to preventing cancer risk and reducing
racial disparities in cancer could involve population specific public health strategies to improve adherence to
these common risk factors. For instance, improving
access to low-cost fresh fruits and vegetables in lowincome communities of the US in general, and the South
in particular given that only 24% of Southern adults in
this study consumed recommended servings of fruits
and vegetables; improving public safety and neighborhood walkability to encourage recreational physical activity especially in the Mid-West given that only 18% of
Mid-Western adults in this study met recommended
physical activity levels; better understanding of culturespecific tobacco cessation programs that are most likely
to be effective, especially in the South where only 34% of
adults in this study were non-smokers.
We observed an inverse association between adherence and prostate cancer risk. This is similar to findings
from other studies [15, 44, 45], as well as an updated
WCRF report [46] showing null or inverse associations
between lifestyle risk factors except a probable association between body weight and prostate cancer. The association between smoking and prostate cancer may be
due to potential detection bias, since smokers may be
less health conscious and less likely to be diagnosed with
cancer, or a yet unidentified genetic or molecular risk
factor. The observed inverse association may also be due
to competing risks; since prostate cancer is a slow, indolent cancer type, individuals at lower levels of adherence
may die earlier due to other lifestyle associated factors
e.g. cardiovascular diseases prior to prostate cancer diagnosis. Nevertheless, prostate cancer remains one of the
most common cancers among men in the US, with
markedly higher risk and aggressiveness among AfricanAmerican men compared with Whites. Further research
studies will be needed to identify etiological factors that
may be modifiable to inform prostate cancer prevention
efforts. The current analysis is strengthened by the
Page 9 of 11
availability of large sample sizes for both AfricanAmericans and Whites, a long duration of follow-up and
lower likelihood of recall bias, and comprehensive set of
study covariates for confounder adjustment. There were
also a few limitations to this study. First, since NIHAARP was a large cohort study of health status of older
adults in general, there was less detailed information on
some cancer-specific risk factors such as frequency of
cancer screening such as mammography or PSA screening. Second, self-reported dietary patterns may be vulnerable to measurement error and may have led to an
underestimation of the association with cancer risk, and
examination of fruit and vegetable intake alone may have
obscured race-specific dietary patterns that may be important for cancer risk. Finally, risk factors were assessed
at baseline, however there is considerable interest in
identifying the etiologic window over the entire lifecourse at which adherence is most important, i.e.
early life, early adulthood or in older ages, which may
further inform efforts to better target cancer prevention messages.
Conclusion
In conclusion, for the major cancer types observed
among US adults, lack of adherence to lifestyle related
cancer risk factor guidelines significantly increased cancer risk, with up to 25% of new cancer cases attributable
to low adherence. A larger proportion of breast cancer
incidence in African-American women compared with
Whites was attributable to examined lifestyle related risk
factors, suggesting that there may be unique opportunities for targeted clinical and public health strategies to
reduce the burden of breast cancer among older
African-American adults.
Additional file
Additional file 1: Participant flowchart for NIH_AARP Diet and Health
Study. The flow chart shows how many participants were in the cohort
from start to finish. (PPTX 63 kb)
Abbreviations
ACS: American Cancer Society; AICR: American Institute for Cancer Research;
AR: Attributable risk; HR: Hazard ratio; NIH-AARP: National Institutes of HealthAmerican Association of Retired Persons; PSA: Prostate specific antigen;
RR: Risk ratio; WCRF: World Cancer Research Fund
Acknowledgements
NA.
Funding
This work was supported by the Deep South Resource Center for Minority
Aging Research (RCMAR) Award Number 2P30AG031054 from the National
Institute on Aging and the University of Alabama at Birmingham Faculty
Development Grant Program. The content is solely the responsibility of the
authors and does not necessarily represent the official views of the National
Institute on Aging or the National Institutes of Health.
Akinyemiju et al. BMC Cancer (2017) 17:597
Availability of data and materials
The dataset and questionnaire utilized for this study are publicly available
online at: />Authors’ contributions
TA designed research (project conception, development of overall research
plan, and study oversight); TA and MP provided essential reagents or provided
essential materials; HW, TA analyzed data or performed statistical analysis; TA,
HW, MP wrote paper; TA, HW and MP had primary responsibility for final content;
All authors have read and approved the final version of this manuscript.
Authors’ information
NA.
Ethics approval and consent to participate
Informed consent was obtained from all study participants for the NIH-AARP
study and this study was approved by the University of Alabama at Birmingham Institutional Review Board (Protocol #: E150623007).
Consent for publication
NA.
Competing interests
The authors declare that they have no competing interests.
Publisher’s Note
Springer Nature remains neutral with regard to jurisdictional claims in
published maps and institutional affiliations.
Author details
1
Department of Epidemiology, University of Alabama at Birmingham,
Birmingham, AL, USA. 2Comprehensive Cancer Center, University of Alabama
at Birmingham, Birmingham, AL, USA. 3Department of Epidemiology,
University of Kentucky, Lexington, KY 40504, USA. 4Division of Preventive
Medicine, University of Alabama at Birmingham, Birmingham, AL, USA.
Received: 5 January 2017 Accepted: 16 August 2017
References
1. ACS. Cancer facts & figures: American Cancer Society; 2016.
2. Rebbeck TR, Haas GP. Temporal trends and racial disparities in global prostate
cancer prevalence. Can J Urol. 2014;21(5):7496–506.
3. Laiyemo AO. Reducing racial disparity in colorectal cancer burden. Dig Dis
Sci. 2014;59(9):2025–7. doi:10.1007/s10620-014-3238-8.
4. Palmer JR, Viscidi E, Troester MA, Hong CC, Schedin P, Bethea TN, Bandera
EV, Borges V, McKinnon C, Haiman CA, et al. Parity, lactation, and breast
cancer subtypes in African American women: results from the AMBER
consortium. J Natl Cancer Inst. 2014;106(10) doi:10.1093/jnci/dju237.
5. Carey LA, Perou CM, Livasy CA, Dressler LG, Cowan D, Conway K, Karaca G,
Troester MA, Tse CK, Edmiston S, et al. Race, breast cancer subtypes, and
survival in the Carolina breast cancer study. JAMA. 2006;295(21):2492–502.
doi:10.1001/jama.295.21.2492.
6. Gebreab SY, Davis SK, Symanzik J, Mensah GA, Gibbons GH, Diez-Roux AV.
Geographic variations in cardiovascular health in the United States: contributions
of state- and individual-level factors. J Am Heart Assoc. 2015;4(6):e001673.
doi:10.1161/JAHA.114.001673.
7. Ferdinand KC, Rodriguez F, Nasser SA, Caballero AE, Puckrein GA, Zangeneh F,
Mansour M, Foody JM, Pemu PE, Ofili EO. Cardiorenal metabolic syndrome and
cardiometabolic risks in minority populations. Cardiorenal Med. 2014;4(1):1–11.
doi:10.1159/000357236.
8. Ford ES, Mokdad AH, Giles WH, Galuska DA, Serdula MK. Geographic variation
in the prevalence of obesity, diabetes, and obesity-related behaviors. Obes Res.
2005;13(1):118–22. doi:10.1038/oby.2005.15.
9. Ogden CL, Carroll MD, Kit BK, Flegal KM. Prevalence of childhood and adult
obesity in the United States, 2011–2012. JAMA. 2014;311(8):806–14. doi:10.
1001/jama.2014.732.
10. Vasquez E, Shaw BA, Gensburg L, Okorodudu D, Corsino L. Racial and ethnic
differences in physical activity and bone density: National Health and
nutrition examination survey, 2007–2008. Prev Chronic Dis. 2013;10:E216.
doi:10.5888/pcd10.130183.
Page 10 of 11
11. Colditz GA, Bohlke K. Priorities for the primary prevention of breast cancer.
CA Cancer J Clin. 2014;64(3):186–94. doi:10.3322/caac.21225.
12. Aune D, Chan DS, Vieira AR, Navarro Rosenblatt DA, Vieira R, Greenwood DC,
Kampman E, Norat T. Red and processed meat intake and risk of colorectal
adenomas: a systematic review and meta-analysis of epidemiological studies.
Cancer Causes Control. 2013;24(4):611–27. doi:10.1007/s10552-012-0139-z.
13. Renehan AG, Flood A, Adams KF, Olden M, Hollenbeck AR, Cross AJ, Leitzmann
MF. Body mass index at different adult ages, weight change, and colorectal
cancer risk in the National Institutes of Health-AARP cohort. Am J Epidemiol.
2012;176(12):1130–40. doi:10.1093/aje/kws192.
14. Di Sebastiano KM, Mourtzakis M. The role of dietary fat throughout the prostate
cancer trajectory. Nutrients. 2014;6(12):6095–109. doi:10.3390/nu6126095.
15. Lund Nilsen TI, Johnsen R, Vatten LJ. Socio-economic and lifestyle factors
associated with the risk of prostate cancer. Br J Cancer. 2000;82(7):1358–63.
doi:10.1054/bjoc.1999.1105.
16. Ferrucci LM, Sinha R, Ward MH, Graubard BI, Hollenbeck AR, Kilfoy BA,
Schatzkin A, Michaud DS, Cross AJ. Meat and components of meat and the
risk of bladder cancer in the NIH-AARP Diet and Health Study. Cancer.
2010;116(18):4345–53. PMID:20681011.
17. Kushi LH, Doyle C, McCullough M, Rock CL, Demark-Wahnefried W,
Bandera EV, Gapstur S, Patel AV, Andrews K, Gansler T, et al. American
Cancer Society guidelines on nutrition and physical activity for cancer
prevention: reducing the risk of cancer with healthy food choices and
physical activity. CA Cancer J Clin. 2012;62(1):30–67. doi:10.3322/caac.
20140.
18. World Cancer Research Fund. Food, nutrition, physical activity, and the
prevention of cancer: a global perspective. Washington, DC: World
Cancer Research Fund/American Institute of Cancer Research; 2007.
19. Hastert TA, Beresford SA, Patterson RE, Kristal AR, White E. Adherence to
WCRF/AICR cancer prevention recommendations and risk of postmenopausal
breast cancer. Cancer Epidemiol Biomark Prev. 2013;22(9):1498–508.
doi:10.1158/1055-9965.epi-13-0210.
20. Warren Andersen S, Blot WJ, Shu XO, Sonderman JS, Steinwandel MD,
Hargreaves MK, Zheng W. Adherence to cancer prevention guidelines and
cancer risk in low-income and African American populations. Cancer Epidemiol
Biomark Prev. 2016; doi:10.1158/1055-9965.epi-15-1186.
21. Kabat GC, Matthews CE, Kamensky V, Hollenbeck AR, Rohan TE. Adherence
to cancer prevention guidelines and cancer incidence, cancer mortality, and
total mortality: a prospective cohort study. Am J Clin Nutr. 2015;101(3):558–69.
doi:10.3945/ajcn.114.094854.
22. Thomson CA, McCullough ML, Wertheim BC, Chlebowski RT, Martinez ME,
Stefanick ML, Rohan TE, Manson JE, Tindle HA, Ockene J, et al. Nutrition and
physical activity cancer prevention guidelines, cancer risk, and mortality in
the women's health initiative. Cancer Prev Res (Phila). 2014;7(1):42–53.
doi:10.1158/1940-6207.capr-13-0258.
23. Brody JA. Changing health needs of the ageing population. CIBA Found
Symp. 1988;134:208–20.
24. Martin FL. Epigenetic influences in the aetiology of cancers arising from
breast and prostate: a hypothesised transgenerational evolution in chromatin
accessibility. ISRN Oncol. 2013;2013:624794. doi:10.1155/2013/624794.
25. Keenan T, Moy B, Mroz EA, Ross K, Niemierko A, Rocco JW, Isakoff S, Ellisen LW,
Bardia A. Comparison of the genomic landscape between primary breast
cancer in African American versus white women and the Association of Racial
Differences with Tumor Recurrence. J Clin Oncol. 2015;33(31):3621–7.
doi:10.1200/jco.2015.62.2126.
26. Reeder-Hayes KE, Wheeler SB, Mayer DK. Health disparities across the breast
cancer continuum. Semin Oncol Nurs. 2015;31(2):170–7. doi:10.1016/j.soncn.
2015.02.005.
27. Li CI, Malone KE, Daling JR. Differences in breast cancer stage, treatment,
and survival by race and ethnicity. Arch Intern Med. 2003;163(1):49–56.
28. Brenner DR, Brockton NT, Kotsopoulos J, Cotterchio M, Boucher BA,
Courneya KS, et al. Breast cancer survival among young women: a review of
the role of modifiable lifestyle factors. Cancer Causes Control. 2016;27(4):
459-72. doi:10.1007/s10552-016-0726-5.
29. Cohen DA, Sturm R, Scott M, Farley TA, Bluthenthal R. Not enough fruit and
vegetables or too many cookies, candies, salty snacks, and soft drinks?
Public Health Rep. 2010;125(1):88–95.
30. Hauner H. Managing type 2 diabetes mellitus in patients with obesity. Treat
Endocrinol. 2004;3(4):223–32.
31. Toro AL, Costantino NS, Shriver CD, Ellsworth DL, Ellsworth RE. Effect of
obesity on molecular characteristics of invasive breast tumors: gene expression
Akinyemiju et al. BMC Cancer (2017) 17:597
32.
33.
34.
35.
36.
37.
38.
39.
40.
41.
42.
43.
44.
45.
46.
Page 11 of 11
analysis in a large cohort of female patients. BMC Obesity. 2016;3:22.
doi:10.1186/s40608-016-0103-7.
Nimptsch K, Pischon T. Body fatness, related biomarkers and cancer risk: an
epidemiological perspective. Hormone Mol Biol Clin Inv. 2015;22(2):39–51.
doi:10.1515/hmbci-2014-0043.
Gunter MJ, Wang T, Cushman M, Xue X, Wassertheil-Smoller S, Strickler HD,
Rohan TE, Manson JE, McTiernan A, Kaplan RC, et al. Circulating Adipokines
and Inflammatory Markers and Postmenopausal Breast Cancer Risk. J Natl
Cancer Inst. 2015;107:9. doi:10.1093/jnci/djv169.
Rodriguez A, Chawla K, Umoh NA, Cousins VM, Ketegou A, Reddy MG,
AlRubaiee M, Haddad GE, Burke MW. Alcohol and apoptosis: friends or foes?
Biomol Ther. 2015;5(4):3193–203. doi:10.3390/biom5043193.
Key TJ, Reeves GK. Alcohol, diet, and risk of breast cancer. BMJ. 2016;353:
i2503. doi:10.1136/bmj.i2503.
Baylin SB, Jones PA. Epigenetic determinants of cancer. Cold Spring Harb
Perspect Biol. 2016; doi:10.1101/cshperspect.a019505.
Song M, Giovannucci E. Preventable incidence and mortality of carcinoma
associated with lifestyle factors among white adults in the United States.
JAMA Oncol. 2016; doi:10.1001/jamaoncol.2016.0843.
Akinyemiju TF, McDonald JA, Tsui J, Greenlee H. Adherence to cancer
prevention guidelines in 18 African countries. PLoS One. 2014;9(8):e105209.
doi:10.1371/journal.pone.0105209.
Warren Andersen S, Zheng W, Sonderman J, Shu XO, Matthews CE, Yu D,
Steinwandel M, McLaughlin JK, Hargreaves MK, Blot WJ. Combined impact
of health behaviors on mortality in low-income Americans. Am J Prev Med.
2016; doi:10.1016/j.amepre.2016.03.018.
Williams DR, Mohammed SA, Shields AE. Understanding and effectively
addressing breast cancer in African American women: unpacking the
social context. Cancer. 2016; doi:10.1002/cncr.29935.
Akinyemiju TF, Pisu M, Waterbor JW, Altekruse SF. Socioeconomic status
and incidence of breast cancer by hormone receptor subtype. SpringerPlus.
2015;4:508. doi:10.1186/s40064-015-1282-2.
Brewer KC, Peterson CE, Davis FG, Hoskins K, Pauls H, Joslin CE. The influence
of neighborhood socioeconomic status and race on survival from ovarian
cancer: a population-based analysis of Cook County, Illinois. Ann Epidemiol.
2015;25(8):556–63. doi:10.1016/j.annepidem.2015.03.021.
Roseland ME, Pressler ME, Lamerato LE, Krajenta R, Ruterbusch JJ, Booza JC,
Schwartz K, Simon MS. Racial differences in breast cancer survival in a large
urban integrated health system. Cancer. 2015;121(20):3668–75. doi:10.1002/
cncr.29523.
Alvarez-Cubero MJ, Pascual-Geler M, Rivas A, Martinez-Gonzalez LJ, Saiz M,
Lorente JA, Cozar JM. Lifestyle and dietary factors in relation to prostate
cancer risk. Int J Food Sci Nutr. 2015;66(7):805–10. doi:10.3109/09637486.
2015.1077786.
Park SY, Haiman CA, Cheng I, Park SL, Wilkens LR, Kolonel LN, Le Marchand
L, Henderson BE. Racial/ethnic differences in lifestyle-related factors and
prostate cancer risk: the multiethnic cohort study. Cancer Causes Control.
2015;26(10):1507–15. doi:10.1007/s10552-015-0644-y.
World Cancer Research Fund. Continuous update project findings and reportsprostate cancer. London: World Cancer Research Fund International; 2014.
Submit your next manuscript to BioMed Central
and we will help you at every step:
• We accept pre-submission inquiries
• Our selector tool helps you to find the most relevant journal
• We provide round the clock customer support
• Convenient online submission
• Thorough peer review
• Inclusion in PubMed and all major indexing services
• Maximum visibility for your research
Submit your manuscript at
www.biomedcentral.com/submit