Integration of genomics, metagenomics, and metabolomics to identify interplay between susceptibility alleles and microbiota in adenoma initiation
Bạn đang xem bản rút gọn của tài liệu. Xem và tải ngay bản đầy đủ của tài liệu tại đây (2.09 MB, 16 trang )
Moskowitz et al. BMC Cancer
(2020) 20:600
/>
RESEARCH ARTICLE
Open Access
Integration of genomics, metagenomics,
and metabolomics to identify interplay
between susceptibility alleles and
microbiota in adenoma initiation
Jacob E. Moskowitz1,2, Anthony G. Doran3,4, Zhentian Lei5, Susheel B. Busi1, Marcia L. Hart6, Craig L. Franklin1,6,
Lloyd W. Sumner5, Thomas M. Keane3,4 and James M. Amos-Landgraf1,6*
Abstract
Background: Colorectal cancer (CRC) is a multifactorial disease resulting from both genetic predisposition and
environmental factors including the gut microbiota (GM), but deciphering the influence of genetic variants,
environmental variables, and interactions with the GM is exceedingly difficult. We previously observed significant
differences in intestinal adenoma multiplicity between C57BL/6 J-ApcMin (B6-Min/J) from The Jackson Laboratory
(JAX), and original founder strain C57BL/6JD-ApcMin (B6-Min/D) from the University of Wisconsin.
Methods: To resolve genetic and environmental interactions and determine their contributions we utilized two
genetically inbred, independently isolated ApcMin mouse colonies that have been separated for over 20 generations.
Whole genome sequencing was used to identify genetic variants unique to the two substrains. To determine the
influence of genetic variants and the impact of differences in the GM on phenotypic variability, we used complex
microbiota targeted rederivation to generate two Apc mutant mouse colonies harboring complex GMs from two
different sources (GMJAX originally from JAX or GMHSD originally from Envigo), creating four ApcMin groups.
Untargeted metabolomics were used to characterize shifts in the fecal metabolite profile based on genetic variation
and differences in the GM.
(Continued on next page)
* Correspondence:
1
Department of Veterinary Pathobiology, University of Missouri, Columbia,
MO 65201, USA
6
Mutant Mouse Resource and Research Center, University of Missouri, 4011
Discovery Drive, Columbia, MO 65201, USA
Full list of author information is available at the end of the article
© The Author(s). 2020 Open Access This article is licensed under a Creative Commons Attribution 4.0 International License,
which permits use, sharing, adaptation, distribution and reproduction in any medium or format, as long as you give
appropriate credit to the original author(s) and the source, provide a link to the Creative Commons licence, and indicate if
changes were made. The images or other third party material in this article are included in the article's Creative Commons
licence, unless indicated otherwise in a credit line to the material. If material is not included in the article's Creative Commons
licence and your intended use is not permitted by statutory regulation or exceeds the permitted use, you will need to obtain
permission directly from the copyright holder. To view a copy of this licence, visit />The Creative Commons Public Domain Dedication waiver ( applies to the
data made available in this article, unless otherwise stated in a credit line to the data.
Moskowitz et al. BMC Cancer
(2020) 20:600
Page 2 of 16
(Continued from previous page)
Results: WGS revealed several thousand high quality variants unique to the two substrains. No homozygous variants
were present in coding regions, with the vast majority of variants residing in noncoding regions. Host genetic
divergence between Min/J and Min/D and the complex GM additively determined differential adenoma susceptibility.
Untargeted metabolomics revealed that both genetic lineage and the GM collectively determined the fecal metabolite
profile, and that each differentially regulates bile acid (BA) metabolism. Metabolomics pathway analysis facilitated
identification of a functionally relevant private noncoding variant associated with the bile acid transporter Fatty acid
binding protein 6 (Fabp6). Expression studies demonstrated differential expression of Fabp6 between Min/J and Min/D,
and the variant correlates with adenoma multiplicity in backcrossed mice.
Conclusions: We found that both genetic variation and differences in microbiota influences the quantitiative adenoma
phenotype in ApcMin mice. These findings demonstrate how the use of metabolomics datasets can aid as a functional
genomic tool, and furthermore illustrate the power of a multi-omics approach to dissect complex disease susceptibility
of noncoding variants.
Keywords: Genetics, Gut microbiota, Colorectal cancer, Metabolomics, Apc, Min
Background
Colorectal cancer (CRC) is a complex disease trait
resulting from a variety of factors including genetic predisposition, diet, age, inflammation, and lifestyle [1–3].
Malignant disease is preceded by the initiation of adenomas in the epithelial lining of the intestinal mucosa,
and often persist up to 10 years before acquiring malignant transformations, making the adenoma a critical target for early intervention [4]. Recently, CRC has been
associated with perturbations in the gut microbiota
(GM) through postulated mechanisms including modulation of inflammation, genotoxin production, and metabolic homeostasis [5–8], but it is often unclear whether
these shifts in bacterial composition directly impact disease risk, or merely result from physiological changes associated with disease. Initiation and progression of
adenomas is likely determined by a combination of genetic factors and changes in microbial populations that
mutually impact relevant pathways [9]. However, the
ability to successfully integrate these complex factors
and to dissect the independent and additive effects of
each remains elusive in human populations.
The intestinal environment is collectively comprised of
dynamic interactions between diet, modified host compounds, and microbial metabolites [10]. As such,
changes in host functional genomic output via germline
or acquired mutations, or shifts in the functional GM,
may substantially influence the metabolite profile. Using
metabolomics provides an avenue to interrogate the
metabolic output of complex biological systems in a
non-targeted discovery-based approach [11]. In controlled experiments, metabolites represent a highly sensitive means of detecting functional changes associated
with genomic variation, differences in complex microbial
communities, and even more importantly the combination of these factors in the context of complex disease
traits. Several studies have demonstrated the utility of
characterizing metabolite profiles in colorectal cancer,
identifying microbial metabolites including short-chain
fatty acids (SCFAs) such as butyrate that can influence
gene expression, cell proliferation, and ultimately adenoma formation [12]. Furthermore, altered levels of
microbial-influenced metabolites including bile acids
(BA) and hydrogen sulfide (H2S) are associated with
both inflammatory bowel disease and CRC through the
production of genotoxic reactive oxygen species [8, 13–
15]. As an approach, non-targeted metabolomics data
correlate to 16S rRNA microbiome composition more
strongly than targeted metabolomics, and have identified
novel metabolites in CRC patients [16].
Due to the challenges of controlling environmental
conditions and performing longitudinal monitoring of
disease progression from pre-disease stages in human
populations, adequate models need to be refined to
study early initiating events. The ApcMin (Min) mouse
model of CRC, which harbors an autosomal dominant
mutation in the Apc tumor suppressor gene causing the
development of intestinal adenomas, provides an extensively studied platform to interrogate genomic and GM
contributions to disease initiation in a quantitative manner [17]. Investigators using this model have observed
complex genetic modification of the adenoma phenotype
from multiple modifier genes, including modifiers between mouse strains and newly arising variants within
the C57BL/6 J strain [18–20]. It is now clear that in
addition to both known and unknown genetic factors,
the GM can also impact adenoma initiation and progression, as germ-free Min mice develop significantly lower
adenoma burdens than their colonized counterparts
[21]. Still, it is unclear how functional genomic changes
and distinct GM communities independently and additively influence adenoma initiation in the context of the
complex specific-pathogen-free GM. Thus, the Min
mouse provides a platform to dissect genomic and
Moskowitz et al. BMC Cancer
(2020) 20:600
microbial contribution to phenotypic variability, and
draw further inferences about variable disease susceptibility across human populations.
A small sampling of the tumor count data reported in
the Min mouse shows a wide range of small intestinal
tumor counts among control animals. Throughout the
course of over two decades of use of the C57BL/6 JApc+/Min mouse, reported adenoma counts across different colonies have varied substantially (Table 1). In
some cases, these disparities were attributed to undetermined differences between institutions. It is wellestablished that mice originating from different mouse
producers and institutions have highly distinct GMs
[22]. Furthermore, strict genetic control of mouse
models is essential to maintaining a consistent phenotype. Though producers take precautions to prevent
genetic drift in inbred colonies, mutations in genetic
modifiers of the Min phenotype may be selected for
rapidly within a colony, and thus account for differences in tumor number across different colonies. In this
study, we leveraged the observed phenotypic variability
between two inbred Min colonies from a common
lineage that have been separated in excess of 20 generations, to interrogate whether disparity in tumor numbers between C57BL/6 inbred colonies occurs due to
differences in the GM or host genetic differences associated with colony divergence. We transferred embryos
from mice from a low-tumor multiplicity colony
(C57BL/6 J-ApcMin/J abbrv. Min/J) and a high-tumor
multiplicity colony (C57BL/6JMlcr-ApcMin/Mlcr abbrv.
Min/D) into surrogate dams harboring distinct complex
GMs, resulting in two genetically independent lines of
mice each harboring two distinct complex GMs. We
describe independent and additive influences of host
genetics and the GM on adenoma initiation through
the use of 16S rRNA microbial profiling, host wholegenome sequencing (WGS), and finally non-targeted
metabolomics. This approach allows for the relatively
non-invasive identification of altered biologically
Table 1 Summary of small intestinal (SI) adenoma number
variability between C57BL6/J-ApcMin colonies
Tumor Count
(SI)
Reference
22
MacGregor DJ et al. International Journal of Oncology.
2000.
34
Zell JA et al. International Journal of Cancer. 2007.
41
Chiu CH et al. Cancer Research. 1997.
71
Niho N et al. Cancer Science. 2003.
102
Ahn B and Ohshima H. Cancer Research. 2001.
108
Paulsen JE et al. Carcinogenesis. 1997.
128
Kwong et al. Genetics. 2007.
Page 3 of 16
relevant pathways and mechanistic associations with
CRC initiation through integration and refinement of
large data sets.
Methods
Animal use and ethics statement
Animal studies were conducted in an Association for
Assessment and Accreditation of Laboratory Animal
Care International (AAALAC) accredited facility according to the guidelines provided by the Guide for the Care
and Use of Laboratory Animals, and were approved by
the University of Missouri Institutional Animal Care and
Use Committee. For Complex Microbiota Targeted
Rederivation (CMTR) C57BL/6JMlcr-ApcMin/Mmmh
(Min/D) and C57BL/6 J-ApcMin/J (Min/J) embryos were
transferred into separate Crl:CD1 surrogate dams with
distinct complex GM populations (GMJAX and
GMHSD) to naturally deliver offspring representing four
experimental groups; Min/JGMJAX, Min/DGMJAX, Min/
JGMHSD, and Min/DGMHSD (Fig. 1a).
Male and female CMTR offspring were group-housed
by sex, genetic origin of the embryo donor (Min/D or
Min/J), and GM of the surrogate dam (GMJAX or
GMHSD). All mice, including embryo donors, ET recipients, and rederived offspring were group-housed in
microisolator cages on ventilated racks (Thoren, Hazelton, PA) on a 14:10 light:dark cycle on paper chip bedding (Shepherd Specialty Papers, Watertown, TN), with
ad libitum access to 5058 irradiated breeder chow (LabDiet, St. Louis, MO) and acidified autoclaved water. All
pups were ear-punched at weaning (21 days of age) using
sterile technique. DNA was extracted using the “HotSHOT” genomic DNA preparation method as described
[23]. To generate N2 backcross animals Min/D males
and WT females from the Min/J colony were first
crossed to create F1 hybrids of the two genetic lineages.
F1 hybrids were then backcrossed to both the Min/D
and Min/J parental lines to create N2 mice. At 3 months
of age, all mice were euthanized via CO2 asphyxiation
and the abdominal cavity was opened. Whole small and
large intestines were incised longitudinally, flushed with
saline and placed on bibulous paper with the luminal
side facing up for formalin fixation. Grossly visible adenomas were counted manually using a Leica M165FC
microscope at 1.25x magnification. Fecal samples were
collected from all rederived mice at 1 month, while fecal
samples, cecal material, and ileal scrapes were collected
after sacrifice at 3 months of age.
Embryo collection and transfer
Embryos for transfer were collected from donors from
two separate colonies (ET donors). Half of the embryos
were obtained from frozen stocks that were generated
through breeding of sexually mature C57BL/6JD-
Moskowitz et al. BMC Cancer
(2020) 20:600
Page 4 of 16
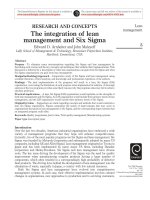
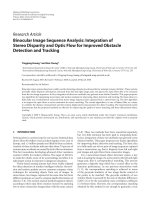
Fig. 1 Genetic lineage and GM colonization additively determine adenoma numbers in ApcMin mice. a Embryos from the Min/J and Min/D
genetic lineages were transplanted into surrogate dams harboring two distinct complex GM profiles; GMJAX and GMHSD. Offspring represent the
two genetic lineages which have inherited a GM from their respective surrogate dams (Min/JGMJAX, n = 13; Min/DGMJAX, n = 18; Min/JGMHSD, n = 19;
Min/DGMHSD, n = 10). b Scatter plots comparing mean (± SEM) small intestinal (SI) and colon adenoma counts of the original B6-ApcMin colony
generated at UW McArdle Laboratory (Min/D) to B6-ApcMin mice acquired from The Jackson Laboratory and maintained at University of Missouri
(Min/J) (Min/D, n = 65; Min/J, n = 22). c Scatter plots comparing mean (± SEM) SI and colon adenoma counts of the four rederived groups,
including each genetic lineage (Min/J and Min/D) rederived with two complex GMs. *p < 0.05, **p < 0.01, ***P < 0.001; Student’s t-test (a) and
Two-way ANOVA with the Student Newman-Keuls method (c)
Apc+/Min (Min/D) males with 5–8 week-old C57BL/6JDApc+/+ females, maintained as a closed-colony at the
McArdle Laboratory, University of Wisconsin (Madison,
WI). A second cohort of embryos for ET was obtained
on-site (University of Missouri, Columbia, MO) using
C57BL/6 J-Apc+/Min (Min/J) males and 5 to 8 week-old
C57BL/6 J- Apc+/+ females, purchased from The Jackson
Laboratory (Bar Harbor, ME). To generate Min/J embryos, in vitro fertilization was performed as described
[24]. Presumptive zygotes were then moved to a KSOM
dish and incubated for 24 h to allow progression to the
two-cell stage [25]. For ET recipients, 8 week old CD1
females harboring a GM (Hsd:CD1GMHSD) from Envigo
(Envigo, Indianapolis, IN) were purchased and allowed
to acclimate for 1 week prior to use. Eight week old CD1
females harboring a GM representing The Jackson Laboratory (Crl:CD1GMJAX) were previously generated in
our laboratory [26]. CD1GMHSD and CD1GMJAX surrogate
female embryo recipients were mated with sterile, vasectomized Hsd:CD1 or Crl:CD1 males, respectively. All
surrogate females were inspected for copulatory plugs
and plug-positive mice were used for embryo transfer.
Surrogate females were anesthetized via IM injection of
ketamine/xylazine cocktail at 5.5 mg and 1 mg per 100 g
body weight respectively, and placed in sternal recumbency. A dorsal midline incision was made and the uterine oviducts located by dissecting through the
retroperitoneal muscle. Embryos in 3 to 5 μl of media
were injected into the oviducts using a glass handpipette. Skin incisions were closed with sterile surgical
staples and mice received a subcutaneous injection of
2.5 mg/kg of body weight flunixin meglumine (Banamine®) prior to recovery on a warming pad.
Tissue collection and processing
All mice were humanely euthanized with CO2 asphyxiation and necropsied, and small intestines were processed as described above. A sterile scalpel blade was
used to gently scrape normal ileal epithelium. After the
body cavity was opened, whole spleens and liver were
Moskowitz et al. BMC Cancer
(2020) 20:600
also collected. All collected tissue was flash-frozen in liquid nitrogen followed by storage at − 80 °C.
Sample collection and DNA extraction for 16S rRNA
sequencing
Two fecal pellets per mouse were collected aseptically and
placed in a 2 mL round-bottom tube containing 800 μl of
lysis buffer [22] and a 0.5 cm diameter stainless steel bead
(Grainger, Lake Forest, Il). All samples were mechanically
disrupted using a TissueLyser II (Qiagen, Venlo,
Netherlands) for 2 min at 50 Hz, followed by incubation at
70 °C for 20 min with periodic vortexing. DNA extraction
from fecal pellets, cecal contents, and ileal epithelium for
16S rRNA sequencing was performed using a DNeasy
Blood & Tissue Kit® (Qiagen) as previously described [22].
16S library preparation and sequencing
DNA extraction from fecal pellets, cecal contents, and
ileal epithelium for 16S rRNA sequencing was performed using a DNeasy Blood & Tissue Kit® (Qiagen) as
previously described (See Supplemental Methods) [22].
Bacterial 16S rRNA amplicons were generated by amplification of the V4 hypervariable region of the 16S rRNA
gene using universal primers (U515F/806R) [27], then
sequenced on the Illumina MiSeq platform as described
previously [22]. Assembly, binning, and annotation of
DNA sequences was performed using Qiime v1.9 [28] at
the University of Missouri Informatics Research Core
Facility (Columbia, MO) as described [22]. Contiguous
sequences were assigned to operational taxonomic units
(OTUs) using a criterion of 97% nucleotide identity by
de novo clustering. Taxonomy was assigned to selected
OTUs using BLAST [29] against the SILVA database
[30] of 16 s rRNA sequences and taxonomy.
Whole-genome sequencing
Genomic DNA for whole-genome sequencing (WGS)
was extracted from splenic tissue using the DNeasy
Blood & Tissue Kit®, as described by the manufacturers
(Qiagen). Paired-end (151 base pair) sequence reads generated for each sample were aligned to the GRCm38
(mm10) mouse reference genome using BWA-MEM
(v0.7.5) [ followed by a
local realignment around indels using the GATKv3.0
‘IndelRealigner Tool’ [20644199]. Possible PCR and optical duplicates were filtered using Picard tools (v1.64)
( SNP and short
indel calls were generated using the Mouse Genomes
Project variation catalog v5 parameters (described in detail [27480531]). In brief, samtools mpileup v1.3
[19505943] and bcftools call v1.3 [21653522] were used
to identify SNPs and indels in each of the samples.
Indels were left-aligned using the bcftools norm function. Filters were then applied to removed variants of
Page 5 of 16
low depth (< 10 reads), low genotype quality (q < 20),
poor mapping quality (q < 20) and proximity to an indel
(SNPs within 2 bp of an indel). Additionally, only heterozygous SNPs with > 5 support reads for each allele were
retained. Functional consequences based on mouse
Ensembl gene models (v88) were annotated using the
Variant Effect Predictor [20562413]. The VEP tool facilitates the identification of synonymous and deleterious
mutations such as stop changes and potentially damaging
missense variants. Variants private to each sample were
identified by removing SNPs and indels common to any of
the 36 strains present in the MGPv5 catalog [27480531].
TA cloning and sanger sequencing for variant validation
As described previously in Genotyping, ear punches were
used to collect DNA for variant validation. To validate the
observed variant in the upstream region of Fabp6 detected
by WGS, this region was PCR amplified using the primers
FWD 5′-ACCACTTCCTCCCTCAGGAT-3′, REV 5′TTCTCCCAATGCCCATCCAG-3′. The TOPO TA
Cloning® Kit (Invitrogen™) was used to insert the region of
interest into the pCR™ 4-TOPO® vector, and TOP10 competent E. coli cells were used for vector transformation according to the manufacturer’s instructions. Transformed
cells were spread onto Lysogeny Broth (LB) plates with 50
μg/mL kanamycin for resistance selection, then grown
overnight at 37 °C in a shaking incubator. The PureYield™
Plasmid Miniprep System (Promega, Madison, WI) was
used to extract DNA from each culture according to the
manufacturer’s instructions. Sequencing reactions were
prepared using the extracted DNA and the T7 sequencing
primer (5′-TAATACGACTCACTATAGGG-3′. Sanger
sequencing was performed at the MU DNA Core using a
3730xl 96-capillary DNA analyzer (ThermoFisher Scientific, Waltham, MA) with the Applied Biosystems Big Dye
Terminator cycle sequencing chemistry.
Genotyping
Genotyping for the Min allele by PCR was performed in
a reaction volume of 10 uL containing 0.2 uM of each
primer (5′-ATTGCCCAGCTCTTCTTCCT-3′ and 5′CGTCCTGGGAGGTATGAATG-3′), 1 x HRM Supermix (BioRad, Hercules, CA), and genomic DNA. Genotyping for the Fabp6 upstream insertion was similarly
performed using ear-punches as described. The 10 uL
HRM reaction contained 0.2 uM of each primer (5′ACCACTTCCTCCCTCAGGAT-3′ and 5′-TTCTCC
CAATGCCCATCCAG-3′), 1 x HRM Supermix, and
genomic DNA. Genotyping reactions and analyses were
carried out using a BioRad CFX384 Real-Time PCR
Detection system. For Min genotyping, cycling conditions were as follows: 95 °C, 2 min; 40 cycles of 95 °C, 10
s; 60 °C, 30 s, 72 °C, 30 s, 95 °C, 30 s; 60 °C, 1 min,
followed by melt curve analysis from 73 °C to 85 °C in
Moskowitz et al. BMC Cancer
(2020) 20:600
Page 6 of 16
increments of 0.1 °C for 10 s. PCR cycling conditions for
Fabp6 analysis were the same as those mentioned above,
followed by a melt curve analysis from 65 °C to 95 °C in
increments of 0.2 °C. All melt curve results were analyzed using BioRad Precision Melt Software v1.2 to detect the Min allele or the Fabp6 insertion.
metabolites were normalized to the internal standard.
One sample from each of the four experimental groups
was analyzed with automated MS/MS. Fragmentation
data was compared to archived PUBCHEM and KEGG
fragment databases via the MetFrag web tool (https://
msbi.ipb-halle.de/MetFragBeta/).
Tissue processing and reverse transcriptase-quantitative
PCR (RT-qPCR)
Metabolomics data analysis
Ileal scrapes collected at 3 months of age were used to
quantitate expression of Fabp6, and liver used to quantitate expression of Cyp39a1. All collected tissue was
flash-frozen in liquid nitrogen followed by storage at −
80 °C. Frozen tissues were mechanically disrupted using
a TissueLyser II (Qiagen) for 4 min at 50 Hz. Total RNA
was then extracted using the AllPrep® DNA/RNA Mini
Kit (Qiagen), and cDNA was synthesized using the
iScript™ cDNA Synthesis Kit (Bio-Rad, Hercules, CA) according to the respective manufacturer’s instructions.
Samples were analyzed in quadruplicate and all evaluated gene expression levels were normalized to Hprt expression using a PrimeTime® qPCR assay (IDT®). For
qPCR, each 10 uL reaction contained 1 x Primer/Probe
mixes (Table S9), 1 x iTaq™ Universal Probe Supermix,
and 100 ng cDNA template. PCR parameters were: denaturation at 95 °C for 5 s, and annealing and elongation
at 60 °C for 30 s for a total of 54 cycles.
Ultra-high performance liquid chromatography-tandem
mass spectrometry (UHPLC-MS/MS)
Fecal samples weighing 25 mg were treated with 1.0 mL
80% MeOH with 18 μg/mL umbelliferone, sonicated for
5 min and centrifuged for 40 min at 3000 g at 10 °C. 0.5
mL supernatant was used for UHPLC-MS analysis after
centrifugation at 5000 g at 10 °C for 20 min and transfer
of 250 μL of extract into glass vials with inserts. A Bruker maXis impact quadrupole-time-of-flight mass spectrometer coupled to a Waters ACQUITY UPLC system
was used to perform UHPLC-MS analysis. Compound
separation was achieved on a Waters C18 column (2.1 ×
100 mm, BEH C18 column with 1.7-um particles) using
a linear gradient and mobile phase A (0.1% formic acid)
and B (acetonitrile). Phase B increased from 5 to 70%
over 30 min, then to 95% over 3 min, held at 95% for 3
min, then returned to 5% for equilibrium. Flow rate was
0.56 mL/min and the column temperature was 60 °C.
Mass spectrometry was performed in the negative electrospray ionization mode with the nebulization gas pressure at 43.5 psi, dry gas of 12 l/min, dry temperature of
250 C and a capillary voltage of 4000 V. Mass spectral
data were collected from 100 and 1500 m/z and were
auto-calibrated using sodium formate after data acquisition. Instrument performance was monitored by the internal standard umbelliferone and peak areas of
Chromatographic data was aligned using mass and retention time with XCMS software (http://xcmsonline.
scripps.edu/). Following alignment, XCMS was used to
generate a relative intensity table with individual features
labeled by retention time and mass for analysis in the
Metaboanalyst v3.0 web program [31]. In Metaboanalyst,
the interquartile range method was used to filter data.
Data was normalized based on sample sums of features’
relative intensity, then log transformed prior to multivariate analysis. Principle Component Analysis (PCA),
putative metabolite identification, and pathway overrepresentation cloud plots were generated with XCMS,
where dysregulated pathways were determined using the
mummichog algorithm [32]. Metaboanalyst was used to
perform hierarchical clustering using the Euclidean
distance measure and Ward clustering algorithm with
significantly modulated (based on ANOVA) metabolites
according to experimental group, and displayed as a
heat-map and dendogram. Metabolite and tumor correlation analysis was performed using small intestinal
tumor counts and individual feature relative intensities
across all four experimental groups, and regression
graphs were generated using GraphPad Prism 8. Individually significant features were determined separately
in terms of GM (compared Min/DGMJAX and Min/
DGMHSD) and genetic lineage (compared of Min/JGMJAX
and Min/DGMJAX) by t-test in XCMS. To determine the
metabolites contributing to the separation and rooting
of the hierarchical clusters illustrated by the dendogram,
the samples were classified into those with ‘high’ or ‘low’
colonic adenoma numbers independent of genetic
lineage or GM, and a linear discriminant analysis (LDA)
was performed using the LEfSe (Linear discriminant
analysis Effect Size) tool on a high-computing Linux
platform [33]. An LDA score of log102 or greater for any
given metabolite was considered significantly differential
between the high and low adenoma groups.
Statistical analysis
Statistical analyses were performed using Sigma Plot
14.0 (Systat Software Inc., Carlsbad CA). Differences in
OTU relative abundance between GMJAX and GMHSD
were determined using Student’s t-test. To account for
multiple testing, OTUs with a p value < 0.001 were considered statistically significant. Two-way ANOVA with
the Student Newman-Keuls post-hoc method was used
Moskowitz et al. BMC Cancer
(2020) 20:600
to assess differences in adenoma number between rederived groups, where p < 0.05 was considered statistically
significant. For GM analysis, GraphPad Prism 8 was used
to generate bar graphs and Tukey’s box plots displaying
phylum relative abundances, richness (OTU counts), and
α-diversity (Shannon Index). Principal Coordinate Analyses incorporating the Bray-Curtis similarity index used
for visualizing β-diversity were generated with the
Paleontological Statistics software package (PAST) 3.12
[34]. Two-way ANOVA/Student Newman-Keuls posthoc method was used to assess differences in richness
and α-diversity and phylum abundance differences between rederived mice. To better account for quantitative
and qualitative community differences between GMJAX
and GMHSD, statistical testing for β-diversity was performed via a two-way PERMANOVA analysis of both
Bray-Curtis and Jaccard dissimilarities for bacterial OTU
community structure using PAST 3.12. For RT-qPCR assays, expression analysis was performed using the 2-ΔΔCt
method of relative expression [35], and statistical differences were assessed using the Student’s t-test.
Results
Genetic lineage and GM colonization additively determine
adenoma susceptibility in distinct C57BL/6-ApcMin
colonies
Historically, tumor multiplicities in C57BL/6-ApcMin
mice vary widely in reported studies despite having
the same inbred genetic background (Table 1). Notably, these colonies were housed in different institutions for unknown numbers of generations prior to
reporting tumor numbers, highlighting the difficulty
in separating the impact of genetic divergence from
environmental variables. We compared intestinal adenoma number in our institution between two
C57BL/6-ApcMin lines arising from a common colony.
The original B6-ApcMin colony was developed in the
McArdle Laboratory at the University of Wisconsin
(Min/D). A subset of Min/D mice were sent to the
Jackson Laboratory (JAX) and underwent rederivation
for colony development and distribution (Min/J), and
thus harbor a GM representing JAX. The original
Min/D colony was maintained as a closed colony
through sibling mating and harbored a GM from
Harlan/Sprague Dawley (now Envigo) that was
acquired through pup fostering to ICR (Hsd:ICR (CD1)) foster mice to rid the colony of Helicobacter spp.
Mice from the Min/D colony had an average of 99.2
small intestinal (SI) and 2.26 colonic adenomas [36],
and breeder males were consistently progeny-tested to
maintain tumor multiplicities in the offspring within
one standard deviation from the average. The Min/J
colony acquired from the Jackson Laboratory and
maintained at the University of Missouri had
Page 7 of 16
significantly fewer SI and colonic adenomas, with 44.2
and 0.55, respectively (SI and colon p < 0.001) (Fig.
1a).
To interrogate how GM and host genetic lineage independently and additively contribute to variable adenoma
susceptibility in ApcMin mice, we used Complex Microbiota Targeted Rederivation (CMTR) to establish mice
from the Min/J genetic lineage and the Min/D genetic
lineage with two different complex GMs; a low-richness
GM originally acquired from B6 mice from the Jackson
Laboratory (GMJAX) and high-richness GM originally
acquired from CD-1 mice from Envigo (GMHSD). These
GM profiles were chosen because they most closely represent the original GMs of the Min/J and Min/D colonies, respectively. Min/J and Min/D embryos were
separately implanted into surrogate dams harboring the
desired GM, such that they would maintain their original genetic lineage while acquiring the desired maternal GM through natural birth. Thus, we generated four
experimental groups representing each combination of
genetic lineage and GM (Fig. 1b). All ApcMin offspring
were sacrificed at 3 months of age, and SI and colonic
adenomas were counted to determine the effects of genetic lineage and GM colonization on adenoma susceptibility. We found that independent of genetic lineage,
mice colonized with GMHSD developed more SI adenomas than their GMJAX counterparts. Furthermore,
when comparing adenoma susceptibility between the
genetic lineages within each GM, mice of the Min/D
lineage developed more adenomas than Min/J mice independent of GM (Fig. 1c). Thus, colonization of Min/J
embryos with GMHSD partially restored the original
Min/D phenotype, but did not account entirely for the
phenotypic differences between the original Min/D and
Min/J colonies. Colonization of Min/D embryos with
GMJAX suppressed the original Min/D phenotype, while
colonization of Min/D with GMHSD completely restored the original McArdle phenotype. Combining the
effects of genetic lineage and GM, Min/DGMHSD mice
develop substantially more adenomas than Min/JGMJAX
(p < 0.001). In the colon, we observed increased adenomas in GMHSD-colonized mice compared to GMJAX,
while genetic lineage had no apparent effect (Fig. 1c).
These trends were similarly observed when males and
females were assessed separately (Fig. S1). To
summarize, both genetic lineage and GM colonization
independently modulated adenoma susceptibility, and
collectively had either additive protective or deleterious
phenotypic effects.
Distinct GM communities influence adenoma
susceptibility
To characterize the GMJAX and GMHSD microbial
communities, feces were collected at 1 month, and fecal
Moskowitz et al. BMC Cancer
(2020) 20:600
and ileal epithelial scrapes at 3 months of age, from
rederived ApcMin mice. 16S rRNA sequencing was then
used to determine relative abundance of all detected microbial taxa. At 1 month, phyla Proteobacteria, Actinobacteria, Deferribacteres, and Cyanobacteria were
enriched in GMHSD-colonized mice, while Tenericutes
were enriched in GMJAX-colonized mice (Fig. 2a).
These changes were observed regardless of genetic
lineage, indicating that phylum make-up was determined
by the surrogate dam rather than genetic lineage of the
embryo. At the operational taxonomic unit (OTU) level,
GMJAX and GMHSD had distinct post-weaning microbial profiles in fecal samples (Fig. 2b) which remained
disparate until sacrifice at 3 months in both feces and
ileal scrapes (Fig. S2A). Community analyses of fecal and
ileal β-diversity by two-way PERMANOVA corroborated
the discrete nature of these communities (Table S1 and
S2). Sex did not appear to play a significant role in GM
make-up, and as anticipated based on previous
characterization of these GMs [22], GMHSD mice had
increased microbial richness (Chao1 index) and αdiversity (Shannon Index) compared to GMJAX mice
(Figs. S2B and S2C). Using a p-value of 0.001 as a
threshold, we found 58 and 34 significantly modulated
OTUs in feces and ileal scrapes, respectively, between
GMJAX and GMHSD (Tables S3 and S4). GMHSD mice
harbored enriched abundances of sulfidogenic Desulfovibrio and Bilophila sp., as well as sulfatase-secreting bacteria (SSB) Rikenella, while GMJAX had enriched levels
of Bacteroides sp. and family Peptococcaceae. A heat
map illustrating fold difference in the relative abundance
of the 25 most significantly different OTUs was used for
a hierarchical clustering analysis, and shows that samples
clustered based on GM profile, regardless of genetic
lineage (Fig. 2c). Thus, GMJAX and GMHSD represent
highly distinct complex microbial communities with a
number of different taxa potentially contributing to differential adenoma susceptibility.
GM and host genetic lineage shape the metabolome in
ApcMin mice
Based on the results of our rederivation experiment, we
aimed to determine functional differences between each
genetic lineage and GM community that could contribute to differential disease susceptibility using a metabolomics approach. Feces contains not only microbial
metabolites, but also mammalian host metabolites that
may undergo microbial biotransformation [10]. In an
untargeted analysis of fecal metabolites at 3 months of
age detected by liquid chromatography coupled mass
spectrometry (LC-MS), we observed distinct metabolite
profiles based on both genetic lineage and GM
colonization (Fig. 3a). Using a False Discovery Rate (qvalue) of 0.1 as a threshold, we found that 1009 features
Page 8 of 16
were significantly modulated between the four rederived
ApcMin groups. Of these features, 172 were specifically
modulated by the GM and 7 by genetic lineage (Supplementary datasets 1-3; Figs. S3A and B), while the remainder appear to be modulated by a combination of
the two factors. A heat map illustrating fold-change of
the most substantially modulated metabolites (based on
ANOVA) was used for a hierarchical clustering analysis.
This analysis demonstrated that samples primarily clustered based on GM, with a secondary clustering pattern
based on genetic lineage (Fig. 3b). Notably, we found
that certain metabolites had significant positive and
negative correlations with adenoma number across all
four rederived groups (Fig. 3c). A pathway analysis using
putative compounds was performed to determine metabolic pathways modulated based on genetic lineage and
GM colonization. Differential bile acid metabolism was
observed when comparing Min/J and Min/D genetics, as
defined by enrichment of putative bile acid intermediates
(25R)-3α,7α-dihydroxy-5β-cholestanate and 3α,7α,12αtrihydroxy-24-oxo-5β-cholestanoyl CoA in Min/D mice
compared to Min/J (Table S5, Fig. 3d). Meanwhile, differential sphingosine lipid metabolism was observed
based on GM colonization (Table S5). To summarize, a
minority of differential features were specifically modulated by GM colonization or host genetic lineage,
whereas the vast majority of features were modulated by
a combination of the two factors. Furthermore, both individual metabolites and metabolic pathways were independently modulated based on genetic lineage or GM.
Host genetic lineage influences bile acid metabolism
The divergent genetic lineages Min/J and Min/D had
significantly altered adenoma susceptibility and metabolic profile. We therefore characterized genetic divergence between the Min/J and Min/D lines via ~30X
whole-genome sequencing (WGS) on representative
breeder female mice from each colony (see supplementary data and methods). SNPs and indels that were private to either Min/D or Min/J were categorized based
on their predicted functional effect due to the nature of
the variant using the Variant Effect Predictor (VEP) tool
(Table S6). There were no private protein coding homozygous variants detected in either line, with all homozygous variants residing in noncoding regions. To
interrogate overall effects of private mutations in each
lineage, all private homozygous variants residing within
or near known genes were used to identify overrepresented KEGG [37] and REACTOME [38] biological
pathways using the over-representation tool in InnateDB, which revealed over-representation of bile-acid
metabolism in the Min/D line (Table S8) [39]. Variants
near or within candidate genes contributing to bile acid
metabolism included Cyp39a1, which codes for an
Moskowitz et al. BMC Cancer
(2020) 20:600
Fig. 2 (See legend on next page.)
Page 9 of 16
Moskowitz et al. BMC Cancer
(2020) 20:600
Page 10 of 16
(See figure on previous page.)
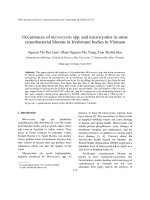
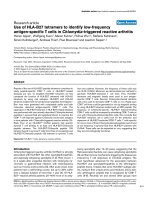
Fig. 2 Distinct GM communities influence adenoma susceptibility. a Bar charts representing relative abundances (mean ± SEM) of Phyla with detected
significant differences between fecal samples GMJAX and GMHSD groups (Min/JGMJAX, n = 13; Min/DGMJAX, n = 18; Min/JGMHSD, n = 19; Min/DGMHSD, n = 10).
b Unweighted Principal Coordinate Analysis (PCoA) representing differences in β-diversity at the Operational Taxanomic Unit (OTU) level between complex
GM profiles of CMTR offspring in feces at 1 month, and ileal scrapes at 3 months of age. c Heatmap showing 25 taxa with significantly different (p < 0.001)
fecal relative abundances between GMJAX and GMHSD at 1 month, where color intensity represents fold-change of each OTU. Hierarchical clustering based
on Euclidean distances (top) demonstrates clustering of samples based on GM. All statistically significant OTUs and associated log-fold changes are
represented in supplementary Tables 3A (fecal) and 3B (ileal).*p < 0.05, **p < 0.01, ***p < 0.001; Two-way ANOVA with the Student Newman-Keuls method
for Multiple Comparisons
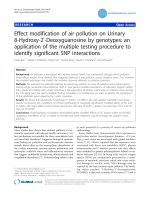
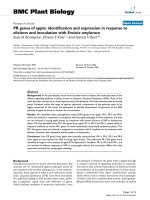
Fig. 3 Untargeted analysis of GM and host genetic lineage effects on the fecal metabolome. a PCA illustrating unsupervised clustering of fecal metabolites at
3 months of age (Min/JGMJAX, n = 6; Min/DGMJAX, n = 4; Min/JGMHSD, n = 5; Min/DGMHSD, n = 5). b Heatmap showing 25 detected fecal metabolites with most
significantly different relative abundances across all rederived groups, where color intensity represents log-fold-change of each metabolite. Hierarchical clustering
based on Euclidean distances (top) illustrates primary clustering of samples based on GM, and secondary clustering based on genetic lineage. All metabolites
shown on heat map have significantly different mean abundances (p < 0.001) based on ANOVA. c Spearman’s rank correlation was used to show metabolites
with significant positive or negative correlations to SI tumor number across all rederived ApcMin groups (n = 20). d Scatter plots of mean ± SEM relative
abundances of putative metabolites contributing to modulation of bile acid metabolism (Min/J, n = 6; Min/D, n = 4). Metabolites are denoted by mass:charge
ratio and retention time (m/z_tR). *p < 0.05, **p < 0.01, ***p < 0.001; Student’s t-test
Moskowitz et al. BMC Cancer
(2020) 20:600
enzyme involved in bile acid biosynthesis, and the intestinal bile acid transporter coded for by Fabp6 [40, 41].
The Min/D line carried a single base (A) deletion in intron 1 of Cyp39a1 at position chr17:43,674,583. Min/D
also carried a T6 bp insertion within a poly T in the area
upstream of Fabp6 within the area of chr11:43,604,91343,604,928. Notably, homozygous variants private to the
Min/J line were detected near candidate genes Myc and
Dlg3 among other cancer related genes (Table S7).
The Min/D Fabp6 variant is associated with SI adenoma
susceptibility
Our WGS findings of variants associated with bile acid
metabolism were particularly notable as they provide a
possible explanation for the previously described
changes in bile acid metabolites (Fig. 3d). However, it is
unclear whether there are any functional consequences
of the observed germline mutations. To determine
whether detected Fabp6 and Cyp39a1 variants had potential downstream effects in the tissues they are normally expressed, we compared gene expression levels in
the normal ileal epithelium and liver, respectively, of
Min/J and Min/D mice. We found that Min/D mice had
a significant reduction in Fabp6 expression in the ileal
epithelium compared to Min/J mice, while there were
no differences in Cyp39a1 mRNA levels in the liver
(Fig. 4b).
We validated the Fabp6 variant detected by WGS and
further interrogated whether Fabp6 is a possible modifier of adenoma susceptibility. The Min/D and Min/J
parental lines were used to generate N2 mice. Tumor
number assessment that was performed blinded for
genotype showed a significant correlation with the
Fabp6 variants, where mice that were homozygous for
the Min/D variant had the highest adenoma susceptibility. Those that were heterozygous displayed an intermediate phenotype, while mice that were homozygous
Page 11 of 16
for the Min/J variant had the lowest adenoma multiplicity (Fig. 4b). Thus, we observed differential Fabp6 expression between the Min/J and Min/D lineages
associated with the validated upstream insertion in Min/
D mice, and further associated this variant with SI adenoma susceptibility in N2 mice.
Colonic adenoma susceptibility is associated with
changes in bile acid metabolism
We finally aimed to determine whether the fecal metabolome could account for the observed differences in colonic adenoma number between the original Min/D and
Min/J colonies (Fig. 1a). An unsupervised dendrogram
was generated to cluster the fecal metabolomes from 3
month old mice based on detected putative fecal metabolite features. The major root of the tree clustered samples into two distinct groups independent of genetic
lineage and GM profile (Fig. 5a). Analysis of these two
groups revealed that they correlated with colonic adenoma multiplicity, indicated by the numbers adjacent to
the dendrogram, where one group had 0.75 ± 0.22 colon
adenomas, while the other had 2.5 ± 0.57 colon adenomas. Linear Discriminant Analysis (LDA) was used to
identify the metabolites driving separation between the
low-adenoma and high-adenoma clusters. In total, we
found 16 metabolites associated with the high-adenoma
cluster, and 6 metabolites associated with the lowadenoma cluster (Fig. 5b). Of these metabolites, tandem
MS enabled identification of two metabolites overrepresented in the low-adenoma cluster, both of which
were bile acid or bile acid derivatives. The relative abundance of putative cholate was primarily modulated by
GM, while the abundance of putative 3β,7α,12α-Trihydroxy-5α-cholan-24-oic acid was dependent on both
GM and genetic lineage (Fig. 5c). In conclusion, an unbiased clustering analysis of the fecal metabolomes of
the rederived ApcMin groups generated two primary
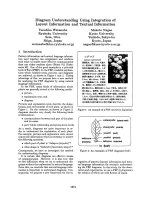
Fig. 4 Min/D Fabp6 variant association with SI adenoma susceptibility. a RT-qPCR comparison of relative expression of candidate genes Fabp6 and
Cyp39a1 between Min/J and Min/D lineages, using ileal mucosal scrapes from normal intestinal epithelium and liver, respectively (Min/J, n = 10; Min/D,
n = 12). b Scatter plots comparing mean (± SEM) SI tumor counts of N2 mice based on their status for the Fabp6 insertion (wt/wt homozygous for
absence of insertion, n = 29; wt/+ heterozygous for insertion, n = 34) +/+ homozygous for presence of the Min/D insertion, n = 16). *p < 0.05, **p <
0.01, ***p < 0.001; Student’s t-test (a) and ANOVA with the Student Newman-Keuls method (b)
Moskowitz et al. BMC Cancer
(2020) 20:600
Page 12 of 16
Fig. 5 Colonic adenoma susceptibility is associated with changes in bile acid metabolism. a Dendrogram was generated based on the putative
fecal metabolite features using the Euclidean distance of measurement and Wards clustering algorithm. The major root of the tree clustered
samples independent of genetic lineage and GM profile. b Linear Discriminant Analysis (LDA) was used to identify the metabolites driving
separation between the low-adenoma and high-adenoma clusters identified by the dendogram. c Scatter plots displaying relative abundance of
two bile acids identified by tandem MS, significantly over-represented in the low-colonic adenoma group defined by the dendogram analysis
(Min/JGMJAX, n = 6; Min/DGMJAX, n = 4; Min/JGMHSD, n = 5; Min/DGMHSD, n = 4). *p < 0.05, **p < 0.01; student’s t-test
groups, which were associated with colonic adenoma
numbers. Identification of two of these metabolites driving the low- and high-adenoma clusters revealed elevated levels of two bile acid compounds in the lowadenoma group, while the remainder are currently
uncharacterized.
Discussion
The Min mouse is the single most cited mouse model of
human cancer for nearly three decades, yielding an
extraordinary wealth of information about the pathogenesis and treatment of human disease. However, the use
of the Min mouse model for quantitative analysis of
tumor susceptibility and treatment has been confounded
by phenotypic variability of unknown origin, particularly
with respect to adenoma multiplicity (Table 1). Here, we
demonstrate how leveraging the observed phenotypic
variability between Min colonies allows us to unravel the
complex factors comprising disease susceptibility, with
special focus on how host genetics and the gut microbiota (GM) collectively influence adenoma initiation. We
utilized a multi-omics approach to integrate microbial
community and host genomic data, and include the fecal
metabolome to incorporate these data sets to provide
new insight into the functional contributions of these interactions in CRC susceptibility.
We exploited our observation of a variable phenotype
between two colonies that diverged from a common
population; the original C57BL/6-ApcMin colony generated
and housed at the McCardle Laboratory at the University
of Wisconsin (Min/D) and mice received from The
Jackson Laboratory (Min/J) (Fig. 1a). Given the multigeneration segregation of the two colonies and the differences in selective pressures, we hypothesized that host
Moskowitz et al. BMC Cancer
(2020) 20:600
genetic divergence would account for differences in adenoma susceptibility, despite having the same original inbred
genetic background. Previous studies have also demonstrated that mice housed in different institutions have distinct GMs due to environmental differences, so we further
hypothesized that the Min/D and Min/J colonies’ disparate GM communities could contribute to distinct phenotypes [22]. The original Min/D colony was rederived onto
Hsd:CD1 surrogate dams from Envigo (previously Harlan)
at the McCardle Laboratory, and therefore had a GM
representing Envigo, while Min/J mice have a relatively
less complex GM from The Jackson Laboratory [26]. To
segregate the effects of host genetics and GM on adenoma
susceptibility, we used a unique targeted rederivation approach in which we generated mice of the Min/D and
Min/J genetic lineages each with a GM representing either
Envigo (GMHSD) or The Jackson Laboratory (GMJAX)
(Fig. 1b). Remarkably, we demonstrated that both genetic
lineage and GM considerably influenced adenoma numbers. While Min/J mice colonized with GMHSD had increased adenoma numbers compared to our original Min/
J colony, colonization of Min/D mice with GMJAX repressed adenoma numbers compared to the original Min/
D colony, emphasizing a critical role for the GM in disease
susceptibility in ApcMin mice (Fig. 1c). Furthermore, rederived mice of the Min/D lineage developed more adenomas
than their Min/J counterparts independent of GM
colonization, indicating that genetic lineage similarly accounts for significant phenotypic variability (Fig. 1c).
Thus, we demonstrate here that host genetics and the GM
collectively accounted for the adenoma number disparity
between two divergent colonies, additively determining
adenoma multiplicity.
Microbial profiling via NGS of the 16S rRNA gene allows characterization of the GMJAX and GMHSD communities to identify OTUs associated with a protective
versus deleterious phenotype. Analysis of β-diversity of
the microbial taxa of GMHSD and GMJAX in the ileum
and feces across multiple time points confirmed that these
GMs are stably distinct from one another throughout the
GI tract (Figs. 2 and S2). Desulfovibrio sp. and Bilophila
sp., deltaproteobacteria producers of hydrogen sulfide
(H2S) via sulfate and sulfite reduction, respectively, were
2–3 orders of magnitude higher in GMHSD compared to
GMJAX in both ileal scrapes and feces (Tables S3 and S4)
suggesting a potentially important role for sulfidogenic
bacteria. A number of studies describe associations between H2S and CRC risk, indicating both pro- and anticarcinogenic roles depending on concentration and route
of cellular exposure [13, 42–44]. Of further interest, Bilophila sp., named for their close association with bile, is the
only bacterial genera known to utilize taurine from
taurine-conjugated bile acids for anaerobic respiration and
H2S production [8, 45]. Due to its use of bile acids as a
Page 13 of 16
source of respiration, B. wadsworthia expands dramatically in western diets with higher fat content associated
with increased taurine-conjugated bile acids, and thus presents a critical link between western diets, bile acid levels,
sulfide production, and CRC risk [46]. While these suggestive results remain correlative, experiments focused on
supplementing these bacteria in an environmentally controlled setting could provide additional insight into complex community structures and their role in CRC
pathogenesis.
The emergence of targeted and untargeted metabolomics provide an avenue to interrogate metabolic changes
in disease. While the high sensitivity of an untargeted approach yields large numbers of metabolites of interest, distinguishing these compounds from unclassified fragments
or adducts poses a significant challenge [16]. This study in
particular exemplifies the challenges of an untargeted approach, as the vast majority of detected differential metabolite features remain unidentified. It is also important to
consider that more extensive annotation of certain metabolite classes may cause inherent bias when interpreting
results. Thus, continued efforts to improve metabolite libraries, as well as bioinformatics pipelines that enable
more efficient compound identification, are critical to the
development of these approaches.
Despite these challenges, a wealth of information can
be gleaned from controlled metabolomics studies. These
data show that both the GM and host genetics shape the
fecal metabolome, and in the process, could alter predisposition to adenoma initiation (Fig. 2a-b). Additional
analysis enables mapping of differential putative compounds to metabolic pathways, and thus shows the perturbation of such metabolic pathways associated with
pathology of interest. We identified dysregulation of bile
acid metabolism in mice from the Min/D genetic
lineage. The enterohepatic BA system is a classic example of the inter-dependent nature of host genetics
and the GM. Host gene expression of enzymes responsible for primary BA biosynthesis, as well as intestinal
transporters that recycle these BAs are required for
functional enterohepatic circulation [47], while the GM
de-conjugates and transforms primary bile acids as they
traverse the GI tract to produce secondary BAs [48].
Thus, intra-intestinal levels of BAs depend upon cooperative genomic and microbial function.
Gleaning functional genomic significance of WGS variants is often especially challenging due to high numbers
of misreads and unknown intergenic effects of poorly
annotated functional elements. Thus, we used our metabolomics data, specifically identification of bile acid dysregulation, as a functional genomic tool to focus our
variants of interest. We identified an insertion at a Spi1
transcription factor binding site of Fatty acid binding
protein 6 (Fabp6), a protein responsible for the re-
Moskowitz et al. BMC Cancer
(2020) 20:600
uptake of bile acids in the ileum for enterohepatic recirculation [49], in Min/D mice. This variant was associated with decreased expression of Fabp6 in the Min/D
population, suggesting a functional role for the insertion.
Previous studies have implicated Fabp6 in human CRC
where it was over-expressed in cancerous tissue relative
to normal tissue. Counterintuitively, higher expression
levels of Fabp6 within tumors correlated with smaller
tumors and less metastasis, suggesting its potential role
in early carcinogenesis [41]. Decreased expression of
Fabp6 in normal ileal epithelium associated with increased adenomagenesis in Min/D mice, as well as a significant association between the Fabp6 variant and SI
adenoma multiplicity in N2 mice, support the proposed
role for Fabp6 in tumor initiation (Fig. 4b).
While it is difficult to discern contributing factors to
colonic adenoma development in ApcMin mice due to
low colon tumor numbers and an incompletely penetrant phenotype, metabolomics may provide a foundation for identifying changes associated with a more
severe or suppressed colonic phenotype. An unbiased
analysis of fecal metabolites in our rederived groups separated the metabolic profiles into two distinct groups defined by colonic tumor number. Among several
associated compounds, we identified two bile acids
where increased abundance was associated with the lowadenoma group (Fig. 5). Previous studies have implicated
secondary bile acids such as deoxycholic acid (DCA) in
CRC pathogenesis through mechanisms including oxidative damage and mitochondrial dysfunction, while primary bile acids can inhibit adenoma formation [50–52].
Cholic acid (CA) is a primary bile acid converted to
DCA by the gut microbiota [53]. Enrichment of cholate
in the low-adenoma group, and its association with
GMJAX-colonized mice, may indicate that GMJAX converts CA to DCA less efficiently than GMHSD, and
therefore confers a suppressed adenoma phenotype.
These results highlight the diversity of bile acids and
their potential effects on host cell proliferation in CRC,
and suggest that carcinogenesis may depend upon a delicate balance between the two. However, further targeted
studies are required to better characterize dysregulation
of primary and secondary bile acids, and to determine
how genetic variants and the microbiota each influence
these metabolites.
Conclusions
Colorectal cancer is a classic example of a multifaceted
disease with complex biological systems contributing to
overall susceptibility and pathogenesis. Here, we demonstrate that complex GM communities and host genetics
both independently and additively modulate adenoma
development in ApcMin mice. We utilized a metabolomics platform to show that genetically divergent host
Page 14 of 16
genomes and complex GM interactively shape the intestinal metabolome. Our strategy of utilizing untargeted
metabolomics data as a functional genomics tool enabled
us to focus our attention to WGS variants of consequence. Thus, we demonstrate a tactic to extract pathologically relevant functional candidate variants from
large sequencing data sets. This work provides a platform for both mechanistic links between genetic variants
and the GM as well as biomarker discovery. Furthermore, this data provides a clear explanation for much of
the variability observed in the ApcMin tumor phenotype
throughout its use over the course of several decades,
and may explain substantial differences in susceptibility
to CRC across different human populations. Finally, this
approach was relatively non-invasive and can be translated to human studies, integrating the complicated
interactive nature of the host genome, the GM, and the
metabolome to create individualized risk assessment and
tailored preventive medicine strategies.
Supplementary information
Supplementary information accompanies this paper at />1186/s12885-020-07007-9.
Additional file 1.
Additional file 2.
Additional file 3.
Additional file 4.
Abbreviations
CRC: colorectal cancer; GM: gut microbiota; Apc: Adenomatous polyposis
coli; Min: Multiple intestinal neoplasia allele; Min/J: C57BL/6 J-ApcMin mice;
Min/D: C57BL/6JD-ApcMin mice; Fabp6: Fatty acid binding protein 6; BA: bile
acids; H2S: hydrogen sulfide; GMJAX: complex gut microbiota with original
origins from the Jackson Laboratory; GMHSD: complex gut microbiota with
original origins from Harlan Sprague Dawley (Envigo)
Acknowledgments
We would like to thank William Dove for generously donating the C57BL/6JMlcrApcMin/Mmmh mice to the MMRRC for public distribution (MMRRC:043849-MU/
GMJAX and MMRRC:050543-MU/GMHSD) and comments on the manuscript. We
would also like to acknowledge the contributions of Nathan Bivens and the MU
DNA Core for assistance with 16S rRNA gene sequencing, Bill Spollen and the MU
Informatics Research Core Facility for assistance with processing and analysis of 16S
rRNA sequencing data, MU Office of Animal Resources and their staff for assistance
with animal husbandry and veterinary care.
Authors’ contributions
All authors have read and approved this manuscript. JM and JAL collectively
conceived the experimental design for all described experiments and were
responsible for overseeing all mouse studies, data analysis, interpretation, and
writing the manuscript. SB processed mouse tissue as required for subsequent
assays including 16S rRNA sequencing, metabolomics, and expression analyses.
TK oversaw whole-genome sequencing, and AD was responsible for the computational processing of resulting WGS data. CF conceived the development of
distinct standardized complex microbiota communities to be used as surrogates for rederivations in the described study, and MH implemented and maintained the surrogate populations required for this experiment. LWS oversaw all
described metabolomics studies, and ZL was responsible for performing LC-MS
experiments and assisted with metabolomics data processing.
Moskowitz et al. BMC Cancer
(2020) 20:600
Funding
This research was funded by grants from the National Institutes of Health to
the Mutant Mouse Resource and Research Center at the University of
Missouri (U42 OD010918), and by the University of Missouri to Dr. James
Amos-Landgraf (Startup-funding). JEM was supported by NIH T32 OD011126.
Availability of data and materials
The datasets in this publication have been made available for public access.
Microbiome sequence data is available in the NCBI Sequence Read Archive.
SRA: SRP216253 BioProject: PRJNA555614. The 16S sample metadata is listed
in the supplementary data. The metabolomics metadata is listed in
supplemental and data is available through the public database
metabolomics workbench (amoslandgrafj_20200522_151621_mwtab).
Ethics approval and consent to participate
Animal studies were conducted in an Association for Assessment and
Accreditation of Laboratory Animal Care International (AAALAC) accredited
facility according to the guidelines provided by the Guide for the Care and
Use of Laboratory Animals, and were approved by the University of Missouri
Institutional Animal Care and Use Committee.
Consent for publication
All the authors consent to publication, the data has been made public as
indicated in the manuscript.
Competing interests
The authors declare no competing interests.
Author details
1
Department of Veterinary Pathobiology, University of Missouri, Columbia,
MO 65201, USA. 2Present Address: F. Widjaja Foundation Inflammatory Bowel
and Immunobiology Research Institute, Cedars-Sinai Medical Center, Los
Angeles, CA 90048, USA. 3Wellcome Trust Sanger Institute, Wellcome
Genome Campus, Hinxton CB10 1SA, UK. 4European Bioinformatics Institute,
Wellcome Genome Campus, Hinxton CB10 1SD, UK. 5Department of
Biochemistry, MU Metabolomics Center, University of Missouri Bond Life
Sciences Center, Columbia, MO 65201, USA. 6Mutant Mouse Resource and
Research Center, University of Missouri, 4011 Discovery Drive, Columbia, MO
65201, USA.
Received: 4 February 2020 Accepted: 26 May 2020
References
1. Thune I, Lund E. Physical activity and the risk of colorectal cancer in men
and women. Br J Cancer. 1996;73:1134–40.
2. de la Chapelle A. Genetic predisposition to colorectal cancer. Nat Rev
Cancer. 2004;4(10):769–80.
3. Itzkowitz SH, Yio X. Inflammatation and Cancer IV. Colorectal cancer in
inflammatory bowel disease: the role of inflammation. Am J Physiol
Gastrointest Liver Physiol. 2004;287:G7–G17.
4. Bertagnolli MM, Hsu M, Hawk ET, Eagle CJ, Zauber AG. Adenoma prevention
with Celecoxib study I: statin use and colorectal adenoma risk: results from
the adenoma prevention with celecoxib trial. Cancer Prev Res (Phila). 2010;
3(5):588–96.
5. Couturier-Maillard A, Secher T, Rehman A, Normand S, De Arcangelis A,
Haesler R, Huot L, Grandjean T, Bressenot A, Delanoye-Crespin A, et al.
NOD2-mediated dysbiosis predisposes mice to transmissible colitis and
colorectal cancer. J Clin Invest. 2013;123(2):700–11.
6. Cuevas-Ramos G, Petit CR, Marcq I, Boury M, Oswald E, Nougayrede JP.
Escherichia coli induces DNA damage in vivo and triggers genomic
instability in mammalian cells. Proc Natl Acad Sci U S A. 2010;107(25):
11537–42.
7. Travaglione S, Fabbri A, Fiorentini C. The Rho-activating CNF1 toxin from
pathogenic E. coli: a risk factor for human cancer development? Infect
Agent Cancer. 2008;3:4.
8. Carbonero F, Benefiel AC, Alizadeh-Ghamsari AH, Gaskins HR. Microbial
pathways in colonic sulfur metabolism and links with health and disease.
Front Physiol. 2012;3:1–11.
9. Birt DF, Phillips GJ. Diet, genes, and microbes: complexities of colon cancer
prevention. Toxicol Pathol. 2014;42(1):182–8.
Page 15 of 16
10. Franzosa EA, Sirota-Madi A, Avila-Pacheco J, Fornelos N, Haiser HJ, Reinker S,
Vatanen T, Hall AB, Mallick H, McIver LJ, et al. Gut microbiome structure and
metabolic activity in inflammatory bowel disease. Nat Microbiol. 2019;4(2):
293–305.
11. Bino RJ, Hall RD, Fiehn O, Kopka J, Saito K, Draper J, Nikolau BJ, Mendes P,
Roessner-Tunali U, Beale MH, et al. Potential of metabolomics as a
functional genomics tool. Trends Plant Sci. 2004;9(9):418–25.
12. Bultman SJ, Jobin C. Microbial-derived butyrate: an oncometabolite or
tumor-suppressive metabolite? Cell Host Microbe. 2014;16(2):143–5.
13. Attene-Ramos MS, Wagner ED, Gaskins HR, Plewa MJ. Hydrogen sulfide
induces direct radical-associated DNA damage. Mol Cancer Res. 2007;5(5):
455–9.
14. Dossa AY, Escobar O, Golden J, Frey MR, Ford HR, Gayer CP. Bile acids
regulate intestinal cell proliferation by modulating EGFR and FXR signaling.
Am J Physiol Gastrointest Liver Physiol. 2016;310(2):G81–92.
15. Farhana L, Nangia-Makker P, Arbit E, Shango K, Sarkar S, Mahmud H,
Hadden T, Yu Y, Majumdar AP. Bile acid: a potential inducer of colon cancer
stem cells. Stem Cell Res Ther. 2016;7(1):181.
16. Melnik AV, da Silva RR, Hyde ER, Aksenov AA, Vargas F, Bouslimani A, Protsyuk I,
Jarmusch AK, Tripathi A, Alexandrov T, et al. Coupling targeted and untargeted
mass spectrometry for Metabolome-microbiome-wide association studies of
human fecal samples. Anal Chem. 2017;89(14):7549–59.
17. Shoemaker AR, Gould KA, Luongo C, Moser AR, Dove WF. Studies of
neoplasia in the min mouse. Biochim Biophys Acta. 1997;1332:F25–48.
18. Cormier RT, Bilger A, Lillich AJ, Halberg RB, Hong KH, Gould KA, Borenstein N,
Lander ES, Dove WF. The Mom1AKR intestinal tumor resistance region consists
of Pla2g2a and a locus distal to D4Mit64. Oncogene. 2000;19:3182–92.
19. Baran AA, Silverman KA, Zeskand J, Koratkar R, Palmer A, McCullen K, Curran
WJ Jr, Edmonston TB, Siracusa LD, Buchberg AM. The modifier of min 2
(Mom2) locus: embryonic lethality of a mutation in the Atp5a1 gene
suggests a novel mechanism of polyp suppression. Genome Res. 2007;17(5):
566–76.
20. Kwong LN, Dove WF. APC and its modifiers in colon cancer. Adv Exp Med
Biol. 2009;656:85–106.
21. Li Y, Kundu P, Seow SW, de Matos CT, Aronsson L, Chin KC, Karre K, Pettersson
S, Greicius G. Gut microbiota accelerate tumor growth via c-Jun and STAT3
phosphorylation in APCMin/+ mice. Carcinogenesis. 2012;33(6):1231–8.
22. Ericsson AC, Davis JW, Spollen W, Bivens N, Givan S, Hagan CE,
McIntosh M, Franklin CL. Effects of vendor and genetic background on
the composition of the fecal microbiota of inbred mice. PLoS One.
2015;10(2):e0116704.
23. Truett GE, Heeger P, Mynatt RL, Truett AA, Walker JA, Warman ML.
Preparation of PCR-quality mouse genomic DNA with hot sodium
hydroxide and tris (HotSHOT). BioTechniques. 2000;29(1):52 54.
24. Takeo TNN. Reduced glutathione enhances fertility of frozen/thawed C57BL/
6 mouse sperm after exposure to methyl-Beta-Cyclodextrin. Biol Reprod.
2011;85:1066–72.
25. Biggers JDML, Raffin M. Amino acids and Preimplantation development of
the mouse in protein-free potassium simplex optimized medium. Biol
Reprod. 2000;63:281–93.
26. Hart ML, Ericsson AC, Lloyd KCK, Grimsrud KN, Rogala AR, Godfrey VL,
Nielsen JN, Franklin CL. Development of outbred CD1 mouse colonies with
distinct standardized gut microbiota profiles for use in complex microbiota
targeted studies. Sci Rep. 2018;8(1):10107.
27. Caporaso JG, Lauber CL, Walters WA, Berg-Lyons D, Lozupone CA, Turnbaugh
PJ, Fierer N, Knight R. Global patterns of 16S rRNA diversity at a depth of
millions of sequences per sample. Proc Natl Acad Sci U S A. 2010;108:4516–22.
28. Kuczynski J, Stombaugh J, Walters WA, Gonzalez A, Caporaso JG, Knight R:
Using QIIME to analyze 16S rRNA gene sequences from microbial
communities. Curr Protoc Microbiol 2012, Chapter 1:Unit 1E 5.
29. Altschul SF, Madden TL, Schaffer AA, Zhang J, Zhang Z, Miller W, Lipman DJ.
Gapped BLAST and PSI-BLAST: a new generation of protein database search
programs. Nucleic Acids Res. 1997;25(17):3389–402.
30. Ritari J, Salojarvi J, Lahti L, de Vos WM. Improved taxonomic assignment of
human intestinal 16S rRNA sequences by a dedicated reference database.
BMC Genomics. 2015;16:1056.
31. Xia J, Sinelnikov IV, Han B, Wishart DS. MetaboAnalyst 3.0--making
metabolomics more meaningful. Nucleic Acids Res. 2015;43(W1):W251–7.
32. Smith CA, Want EJ, O'Maille G, Abagyan R, Siuzdak G. XCMS: processing
mass spectrometry data for metabolite profiling using nonlinear peak
alignment, matching, and identification. Anal Chem. 2006;78(3):779–87.
Moskowitz et al. BMC Cancer
(2020) 20:600
33. Segata N, Izard J, Waldron L, Gevers D, Miropolsky L, Garrett WS,
Huttenhower C. Metagenomic biomarker discovery and explanation.
Genome Biol. 2011;12(6):R60.
34. Hammer Ø, Harper DAT, Ryan PD. Past: paleontological statistics software
package for education and data analysis. Palaeontologia Electronica. 2001;
1(4):9.
35. Schmittgen TD, Livak KJ. Analyzing real-time PCR data by the comparative
CT method. Nat Protoc. 2008;3(6):1101–8.
36. Amos-Landgraf JMHJ, Wielenga MCB, Dunkin E, Krentz KJ, et al. Sex disparity
in colonic adenomagenesis involves promotion by male hormones, not
protection by female hormones. PNAS. 2014;111(46):16514–9.
37. Kanehisa M, Goto S. KEGG: Kyoto Encylcopedia of genes and genomes.
Nucleic Acids Res. 2000;28(1):27–30.
38. Joshi-Tope G, Gillespie M, Vastrik I, D'Eustachio P, Schmidt E, de Bono B,
Jassal B, Gopinath GR, Wu GR, Matthews L, et al. Reactome: a
knowledgebase of biological pathways. Nucleic Acids Res. 2005;33(Database
issue):D428–32.
39. Breuer K, Foroushani AK, Laird MR, Chen C, Sribnaia A, Lo R, Winsor GL,
Hancock RE, Brinkman FS, Lynn DJ. InnateDB: systems biology of innate
immunity and beyond--recent updates and continuing curation. Nucleic
Acids Res. 2013;41(Database issue):D1228–33.
40. Fuchs M. Bile Acid Regulation of Hepatic Physiology III. Rregulation of bile
acid synthesis: past progress and future challenges. Am J Physiol
Gastrointest Liver Physiol. 2003;284:G551–9.
41. Ohmachi T, Inoue H, Mimori K, Tanaka F, Sasaki A, Kanda T, Fujii H, Yanaga
K, Mori M. Fatty acid binding protein 6 is overexpressed in colorectal
cancer. Clin Cancer Res. 2006;12(17):5090–5.
42. Attene-Ramos MS, Wagner ED, Plewa MJ, Gaskins HR. Evidence that
hydrogen sulfide is a genotoxic agent. Mol Cancer Res. 2006;4(1):9–14.
43. Hellmich MR, Szabo C. Hydrogen sulfide and Cancer. Handb Exp Pharmacol.
2015;230:233–41.
44. Guo FF, Yu TC, Hong J, Fang JY. Emerging roles of hydrogen sulfide in
inflammatory and neoplastic colonic diseases. Front Physiol. 2016;7:156.
45. Laue H, Friedrich M, Ruff J, Cook AM. Dissimilatory sulfite reductase
(desulfoviridin) of the taurine-degrading, non-sulfate-reducing bacterium
Bilophila wadsworthia RZATAU contains a fused DsrB-DsrD subunit. J
Bacteriol. 2001;183(5):1727–33.
46. Ridlon JM, Kang DJ, Hylemon PB, Bajaj JS. Bile acids and the gut
microbiome. Curr Opin Gastroenterol. 2014;30(3):332–8.
47. Thomas C, Pellicciari R, Pruzanski M, Auwerx J, Schoonjans K. Targeting bile-acid
signalling for metabolic diseases. Nat Rev Drug Discov. 2008;7(8):678–93.
48. Ridlon JM, Kang DJ, Hylemon PB. Bile salt biotransformations by human
intestinal bacteria. J Lipid Res. 2006;47(2):241–59.
49. Lefebvre P, Cariou B, Lien F, Kuipers F, Staels B. Role of bile acids and bile
acid receptors in metabolic regulation. Physiol Rev. 2009;89(1):147–91.
50. Cao H, Luo S, Xu M, Zhang Y, Song S, Wang S, Kong X, He N, Cao X, Yan F,
et al. The secondary bile acid, deoxycholate accelerates intestinal adenomaadenocarcinoma sequence in Apc (min/+) mice through enhancing Wnt
signaling. Familial Cancer. 2014;13(4):563–71.
51. Degirolamo C, Modica S, Palasciano G, Moschetta A. Bile acids and colon
cancer: solving the puzzle with nuclear receptors. Trends Mol Med. 2011;
17(10):564–72.
52. Smith DL, Keshavan P, Avissar U, Ahmed K, Zucker SD. Sodium taurocholate
inhibits intestinal adenoma formation in APCMin/+ mice, potentially
through activation of the farnesoid X receptor. Carcinogenesis. 2010;31(6):
1100–9.
53. Brown DG, Rao S, Weir TL, O'Malia J, Bazan M, Brown RJ, Ryan EP.
Metabolomics and metabolic pathway networks from human colorectal
cancers, adjacent mucosa, and stool. Cancer Metab. 2016;4:11.
Publisher’s Note
Springer Nature remains neutral with regard to jurisdictional claims in
published maps and institutional affiliations.
Page 16 of 16