Candidate methylation sites associated with endocrine therapy resistance in ER+/ HER2- breast cancer
Bạn đang xem bản rút gọn của tài liệu. Xem và tải ngay bản đầy đủ của tài liệu tại đây (1.48 MB, 15 trang )
Soleimani Dodaran et al. BMC Cancer
(2020) 20:676
/>
RESEARCH ARTICLE
Open Access
Candidate methylation sites associated
with endocrine therapy resistance in ER+/
HER2- breast cancer
Maryam Soleimani Dodaran1,2†, Simone Borgoni3,4†, Emre Sofyalı3,4, Pernette J. Verschure5, Stefan Wiemann3,4,
Perry D. Moerland1*† and Antoine H. C. van Kampen1,2*†
Abstract
Background: Estrogen receptor (ER) positive breast cancer is often effectively treated with drugs that inhibit ER
signaling, i.e., tamoxifen (TAM) and aromatase inhibitors (AIs). However, 30% of ER+ breast cancer patients develop
resistance to therapy leading to tumour recurrence. Changes in the methylation profile have been implicated as
one of the mechanisms through which therapy resistance develops. Therefore, we aimed to identify methylation
loci associated with endocrine therapy resistance.
Methods: We used genome-wide DNA methylation profiles of primary ER+/HER2- tumours from The Cancer Genome
Atlas in combination with curated data on survival and treatment to predict development of endocrine resistance.
Association of individual DNA methylation markers with survival was assessed using Cox proportional hazards models
in a cohort of ER+/HER2- tumours (N = 552) and two sub-cohorts corresponding to the endocrine treatment (AI or
TAM) that patients received (N = 210 and N = 172, respectively). We also identified multivariable methylation signatures
associated with survival using Cox proportional hazards models with elastic net regularization. Individual markers and
multivariable signatures were compared with DNA methylation profiles generated in a time course experiment using
the T47D ER+ breast cancer cell line treated with tamoxifen or deprived from estrogen.
(Continued on next page)
* Correspondence: ;
†
Maryam Soleimani Dodaran and Simone Borgoni: these authors contributed
equally to this work
†
Perry D. Moerland and Antoine H.C. van Kampen: these authors jointly
supervised this work
1
Bioinformatics Laboratory, Department of Clinical Epidemiology, Biostatistics,
and Bioinformatics, Amsterdam Public Health research institute, Amsterdam
UMC, University of Amsterdam, Meibergdreef 9, Amsterdam, AZ 1105, The
Netherlands
Full list of author information is available at the end of the article
© The Author(s). 2020 Open Access This article is licensed under a Creative Commons Attribution 4.0 International License,
which permits use, sharing, adaptation, distribution and reproduction in any medium or format, as long as you give
appropriate credit to the original author(s) and the source, provide a link to the Creative Commons licence, and indicate if
changes were made. The images or other third party material in this article are included in the article's Creative Commons
licence, unless indicated otherwise in a credit line to the material. If material is not included in the article's Creative Commons
licence and your intended use is not permitted by statutory regulation or exceeds the permitted use, you will need to obtain
permission directly from the copyright holder. To view a copy of this licence, visit />The Creative Commons Public Domain Dedication waiver ( applies to the
data made available in this article, unless otherwise stated in a credit line to the data.
Soleimani Dodaran et al. BMC Cancer
(2020) 20:676
Page 2 of 15
(Continued from previous page)
Results: We identified 134, 5 and 1 CpGs for which DNA methylation is significantly associated with survival in the
ER+/HER2-, TAM and AI cohorts respectively. Multi-locus signatures consisted of 203, 36 and 178 CpGs and showed a
large overlap with the corresponding single-locus signatures. The methylation signatures were associated with survival
independently of tumour stage, age, AI treatment, and luminal status. The single-locus signature for the TAM cohort
was conserved among the loci that were differentially methylated in endocrine-resistant T47D cells. Similarly, multilocus signatures for the ER+/HER2- and AI cohorts were conserved in endocrine-resistant T47D cells. Also at the gene
set level, several sets related to endocrine therapy and resistance were enriched in both survival and T47D signatures.
Conclusions: We identified individual and multivariable DNA methylation markers associated with therapy resistance
independently of luminal status. Our results suggest that these markers identified from primary tumours prior to
endocrine treatment are associated with development of endocrine resistance.
Keywords: Breast cancer, DNA methylation, Endocrine therapy, Resistance, Survival, T47D
Background
Breast cancer (BRCA) is among the most common cancers diagnosed in women in Europe where it also is the
third cause of cancer death after lung and colorectal
cancer [1]. Approximately 75% of breast tumours is
characterized by the expression of estrogen receptor
alpha (ERα), encoded by the estrogen receptor 1 (ESR1)
gene. These tumours require estrogen signals for continued growth and, consequently, patients generally receive
endocrine treatment to inhibit ER signalling [2]. Endocrine treatment comprises selective estrogen receptor
modulators including tamoxifen, selective estrogen receptor down-regulators including fulvestrant, and AIs
(e.g., anastrozole, letrozole and exemestane) that inhibit
the production of estrogen from androgen. Unfortunately, resistance to endocrine therapy (ET) develops in
approximately 30% of ER+ BRCA patients resulting in
recurrence of the tumour [3]. Despite many efforts the
precise mechanisms leading to acquired treatment resistance remain mostly unknown and, therefore, therapies
to prevent or revert resistance are currently lacking.
Therefore, the identification of biomarkers, including
epigenetic markers, that can predict endocrine resistance
are considered of great value for patient stratification
prior to ET [4].
In general, BRCA development, progression, and
(endocrine) drug resistance result from the cumulative
burden of genetic and epigenetic changes. Moreover,
post-transcriptional and post-translational modifications
are likely to contribute as well [5–7]. The association of
epigenetic changes with tumour characteristics, subtypes, prognosis, and treatment outcome is only partially
characterized [8]. Epigenetic changes have been shown
to drive resistance acquisition (RA) through their effect
on gene expression and/or chromosomal stability [9].
For example, using RNA-seq and ChIP-seq analysis of
the acetylation of lysine 27 on histone 3 (H3K27ac), an
established active enhancer marker, revealed that epigenetic activation of the cholesterol biosynthesis pathway
causes activation of ERα resulting in resistance [10].
DNA methylation is also perturbed during BRCA development and may largely affect gene expression [4, 11].
Since DNA methylation has also been shown to be altered in endocrine resistant tumours [12], the identification of methylation markers for disease diagnosis,
prognosis, and treatment outcome is receiving increased
attention. Moreover, BRCA treatment might benefit
from the regulation of methylation activity by using
DNA methyltransferase inhibitors [4]. Treatment with
the DNA methyltransferase inhibitor 5-aza-2′ deoxycytidine caused a significant reduction in promoter methylation and a concurrent increase in expression of the gene
ZNF350 that encodes a DNA damage response protein,
and of MAGED1 which is a tumour antigen and putative
regulator of P53, suggesting that a methylation-targeted
therapy might be beneficial [13]. However, current inhibitors have weak stability, lack specificity for cancer
cells and are inactivated by cytidine deaminase thus limiting their use in the treatment of BRCA [14].
Several studies investigated DNA methylation in relation to disease outcome and therapy resistance. Lin et al.
observed significant differences in DNA methylation
profiles between tamoxifen sensitive and tamoxifen resistant cell lines [15]. There, a large number of genes,
several of which have been previously implicated in
BRCA pathogenesis, were shown to have increased DNA
methylation of their promoter CpG islands in the resistant cell lines. Similarly, Williams et al. observed a large
number of hypermethylated genes in a tamoxifenresistant cell line [13]. In a meta-analysis of two human
BRCA gene expression datasets, 144 genes for which
methylation levels had been linked to BRCA survival
were shortlisted as putative epigenetic biomarkers of
survival. Kaplan-Meier survival analysis on the expression of these genes further reduced this list to 48 genes,
and a subsequent correlation analysis of gene expression
and DNA methylation provided evidence for the potential association of DNA methylation with survival in
Soleimani Dodaran et al. BMC Cancer
(2020) 20:676
different BRCA subtypes including ER+/HER2- [16]. Another study compared ductal carcinoma in situ to invasive BRCA and suggested that methylation changes
indicate an early event in the progression of cancer and,
therefore, might be of relevance for clinical decision
making [17]. In contrast to studies that showed the impact of promoter methylation, it has also been demonstrated that endocrine response in cell lines is mainly
modulated by methylation of estrogen-responsive enhancers [18]. There, increased ESR1-responsive enhancer
methylation in primary tumours was found to be associated with endocrine resistance and disease relapse in
ER+ (luminal A) human BRCA, suggesting that methylation levels can be used to identify patients that positively
respond to ET. Note that, although limited ERresponsive enhancer methylation may already be present
in the primary tumour, the analysis of methylation profiles of matched relapse samples showed that enhancer
DNA methylation increased during treatment. Therefore, a combination of pre-existing and acquired differences in enhancer DNA methylation could be associated
with the development of ET resistance.
Current evidence on the association of DNA methylation and endocrine resistance is largely based on cell line
models. The largest BRCA patient cohort to study
genome-wide DNA methylation profiles and their association with resistance to ET is provided by The Cancer
Genome Atlas (TCGA) [19]. However, to the best of our
knowledge, these data have hardly been used to find candidate methylation sites associated with endocrine resistance. One exception is a recent study by Zhang et al., who
used the TCGA BRCA cohort to identify regions that
were differentially methylated between patients resistant
and sensitive to ET [20]. However, their analysis was based
on only a small subset of 32 samples selected based on either short-term (less than 30 months; resistant) or longterm (more than 100 months; sensitive) survival.
In the current work we investigated if DNA methylation profiles of primary ER+/HER2- tumours provide information to predict endocrine resistance. We selected
methylation profiles provided by TCGA from patients
treated with tamoxifen or AIs, and assumed that patient
survival is a proxy for absence of therapy resistance. To
identify specific DNA methylation markers, we tested
the association with survival using a Cox proportional
hazards model. We were able to identify DNA methylation markers associated with patient outcome in a cohort of 552 ER+/HER2- patients, a sub-cohort of 172
patients treated with TAM, and a sub-cohort of 210 patients treated with AIs. We validated these markers and
associated gene sets using DNA methylation profiles
generated in a time course experiment using the T47D
cell line treated with tamoxifen or deprived from
estrogen.
Page 3 of 15
Methods
Data
We used clinical, biospecimen, gene expression (RNAseq V2) and DNA methylation (Illumina Human
Methylation 450 K) data of 1098 patients with breast
invasive carcinoma from TCGA (cancergenome.nih.
gov). Samples represented in TCGA were all collected
prior to adjuvant therapy [21]. TCGA also recorded
patient follow-up information describing clinical
events such as type of treatment, the number of days
from the date of initial pathological diagnosis to a
new tumour event, death, and date of last contact.
Since clinical and biospecimen data are scattered over
multiple files in the TCGA repository, we first
merged all information in a single table with one row
per patient using the patient identifiers provided in
the clinical and biospecimen data. Subsequently, we
corrected drug names for tamoxifen and AIs (anastrozole, exemestane and letrozole) for spelling variants
and mapped synonyms to their generic drug names
(Additional File 1).
Patient cohorts
For all patients with DNA methylation data available
we selected data from primary tumours (indicated
with “01” in the patient barcode) of female ER+/
HER2- BRCA patients (Fig. 1). The molecular subtype
was determined using TCGA gene expression data for
these samples (see below). The ER+/HER2- cohort
was further subdivided according to the endocrine
treatment (AI or tamoxifen) that patients received
during follow-up. Patients who received both drugs
were included in both sub-cohorts. Consequently, we
considered three patient cohorts, i.e., ER+/HER2-, AI,
and TAM.
Subtype determination
Information for BRCA subtyping by immunohistochemistry of ER or HER2 is missing for 192 out of 1098 patients. Therefore, we used TCGA BRCA RNAseq V2
gene expression data to determine molecular subtypes
(Additional File 2). To this end, gene expression data
from primary tumours were retrieved from the Genomic
Data Commons legacy archive using the R package
TCGAbiolinks [22]. RSEM estimated abundances were
normalised using the upper quartile method from the R
package edgeR [23] and subsequently log2-transformed
with an offset of one. BRCA subtypes ER−/HER2-,
HER2+, and the lowly proliferative ER+/HER2- (luminal
A) and highly proliferative ER+/HER2- (luminal B) subtypes were determined using the SCMOD2 model from
the R package genefu [24].
Soleimani Dodaran et al. BMC Cancer
(2020) 20:676
Page 4 of 15
Survival analysis
Clinical variables
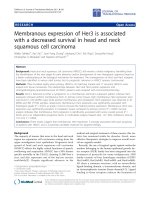
Fig. 1 Study flow chart and cohort definition. This figure shows the
steps taken to define each of the three cohorts. First the molecular
subtype was determined using TCGA BRCA gene expression data
and ER+/HER2- patient samples were selected. Next, patients
without follow-up data and patients for whom no methylation
profiles were measured were removed. Finally, male patients were
removed leading to the study cohort of ER+/HER2- patients. Patients
who received tamoxifen form the TAM sub-cohort and patients who
received AI form the AI sub-cohort. Dashed arrows indicate filter
steps. ‡42 patients received both tamoxifen and AI and are included
in both the TAM and AI sub-cohort. No missing data for TAM and AI
cohorts. AI, aromatase inhibitor; BRCA, breast invasive carcinoma; ER,
estrogen receptor; HER2, human epidermal growth factor receptor 2;
TAM, tamoxifen; TCGA, The Cancer Genome Atlas
DNA methylation data and pre-processing
Illumina Human Methylation 450 K raw data (IDAT files)
for the patients in the cohorts defined above were retrieved
from TCGA. Pre-processing was performed using the R
package minfi [25]. Data were normalized using functional
normalization with dye bias correction using a reference
array [26]. Detection p-values were calculated for each
methylation probe and 82,150 probes with an unreliable signal (p > 0.01) in one or more samples were removed. Probes
corresponding to loci that contain a SNP in the CpG site or
in the single-base extension site were removed. We also removed probes that have been shown to cross-hybridize to
multiple genomic positions [27]. Finally, M-values were calculated and probes with low variation across samples (standard deviation of M-values ≤ 0.4) were removed. The final
data set comprised 320,504 CpG loci. Probes were annotated
to genes and enhancer regions using the R package
IlluminaHumanMethylation450kanno.ilmn12.hg19.
Based on literature [28–30] we selected menopause status (pre/post, after merging pre- and peri-menopausal;
values ‘[Unknown]’ and ‘Indeterminate’ were considered
missing), AI treatment (yes, no), tamoxifen treatment
(yes, no), tumour stage (I-IV, after merging subcategories; stage X was considered missing), and age at diagnosis as candidate variables predictive of survival. We
tested association with survival using the Cox proportional hazards model (R package survival). We defined
an event as the first occurrence of a new tumour event
or death. For patients without an event we used the latest contact date as provided by the clinical data (right
censoring). To account for missing values for the variables menopause status and stage in the ER+/HER2- cohort we used multiple imputation (R package mice) to
generate 50 datasets and perform survival analysis on
each dataset separately [31]. The input data used for
multiple imputation is available in Additional File 3.
Rubin’s rule was applied to combine individual estimates
and standard errors (SEs) of the model coefficients from
each of the imputed datasets into an overall estimate
and SE resulting in a single p-value for each variable.
Clinical variables with a p-value < 0.10 in a univariable
survival model were selected for inclusion in the multivariable survival model. Variables in the final multivariable model were determined using backward selection
by iteratively removing variables with the highest p-value
until all variables had a p-value < 0.05.
Single-locus survival analysis
Next we performed survival analysis to identify single
methylation loci associated with patient survival using
the methylation M-values in a Cox proportional hazards
model. The models for each locus were adjusted for significant clinical variables from the multivariable model.
To account for missing values for clinical variables, multiple imputation was used as described above. Resulting
p-values were corrected for multiple testing using the
Benjamini-Hochberg false discovery rate (FDR). Adjusted p-values < 0.05 were considered statistically significant. Subsequently, single-locus survival models were
also adjusted for ER+/HER2- subtypes (luminal A/luminal B) in addition to the clinical variables selected
above. Kaplan-Meier curves for individual loci were determined by calculating the median of the methylation
levels over all patients in a cohort and then assigning a
patient to a low (methylation level < median) or a high
(methylation level ≥ median) group.
Multi-locus survival analysis
We used the Cox proportional hazards model with elastic net regularization (function cv.glmnet, R package
Soleimani Dodaran et al. BMC Cancer
(2020) 20:676
glmnet) [32] to identify a signature of multiple methylation loci associated with survival. We followed a twostage approach. First, the CpG signature was determined
without including clinical variables using Cox regression
with elastic net penalty. Secondly, from the resulting
model the risk score (see below) was calculated and used
in a new model that includes the clinical variables selected above in order to establish whether the methylation signature provided additional information compared
to merely using clinical variables. Optimal values, minimizing the partial likelihood deviance, for the elastic net
mixing parameter (α) and tuning parameter (λ) were determined by stratified (for event status) 10-fold crossvalidation using a grid search varying α from 0 to 1 in
steps of 0.1 and using 100 values for λ that were automatically generated for each α. We constructed one model for
each of the three cohorts (ER+/HER2-, AI, TAM). Subsequently, for each cohort we used the identified signature
to calculate a risk score for each patient:
X
risk score ¼
c ÃM i
i i
where for CpG locus i, ci denotes the corresponding coefficient in the Cox model and Mi the methylation Mvalue. Next, multivariable Cox proportional hazards regression was performed using the risk score as a variable
and adjusting for significant clinical variables from the
multivariable model. Missing values for the clinical variables were imputed as described above. Finally, the riskscore-based models were also adjusted for ER+/HER2subtypes (luminal A/luminal B) in addition to the selected clinical variables. Kaplan-Meier curves were determined for two groups of patients by calculating the
median of the risk scores over all patients in a cohort
and then assigning a patient to a good (risk score < median) or a bad prognosis group (risk score ≥ median).
Stability of multi-locus signatures
To assess the stability of the multi-locus signatures 30
regularized Cox models were fitted using a stratified (for
event status) selection of 90% of the samples for each
cohort. We counted the number of times each CpG
locus was included in the 30 signatures and then selected those CpGs that occurred in at least 6 or at least
21 signatures. We refer to the resulting signatures as stability signatures. Fisher’s exact test was used to determine the significance of the overlap between the original
multi-locus signature and the stability signatures.
Correlation between DNA methylation and gene expression
CpGs in single-locus and multi-locus signatures were
annotated to their nearest gene(s) (package IlluminaHumanMethylation450kanno.ilmn12.hg19). For each signature Pearson correlation coefficients (and corresponding
Page 5 of 15
p-values) were calculated between the methylation and
gene expression profiles of each CpG-gene pair. Resulting p-values were corrected for multiple testing in each
signature using the Benjamini-Hochberg FDR.
Methylation profiling of resistance acquisition in an ER+
breast cancer cell line
T47D cells were either treated with 100 nM 4hydroxytamoxifen (TMX), long-term estrogen deprived
(LTED; modelling AI treatment [33]) or not treated
(wild type (WT)) in two biological replicates cultured for
7 and 5 months, respectively. DNA was extracted after 0,
1, 2, 5 and 7 (only one replicate) months. Methylation
profiling was performed using the Illumina MethylationEPIC BeadChip platform at the Genomic and Proteomic Core Facility (DKFZ, Germany). For each sample
two technical replicates were measured. Pre-processing
was performed as described above, except that a single
sample approach was used for dye bias correction. The
8682 probes with an unreliable signal (detection p-value
> 0.01) in one or more samples were removed. Probes
that cross-hybridized to multiple genomic positions as
listed by Pidsley et al. [34] were removed. No filtering
based on M-values was performed. The final data set
contains 786,872 CpG loci. Using the resulting M-values
CpG-wise linear models were fitted with coefficients for
each treatment (TMX, LTED, WT) and time point combination. In addition, we included a coefficient to correct
for systematic differences between the two biological
replicates (R package limma). For both LTED and TMX
treated cells, contrasts were made between each individual time point t and the WT cell line at baseline, that is,
LTEDt – WT0 and TMXt – WT0, respectively. The
comparison of the average of TMX and LTED treated
cells versus WT baseline was estimated via the contrast
(LTEDt + TMXt)/2 – WT0. Differential methylation was
assessed using empirical Bayes moderated statistics while
also including the consensus correlation within pairs of
technical replicates in the linear model fit (function
duplicateCorrelation, limma package). The resulting signatures are referred to as the LTED, TMX and TMX/
LTED signatures.
Enrichment analysis
We performed generalized gene set testing with a hypergeometric test using the gsameth function (R package
missMethyl) to test if significant CpG sites are enriched
in selected pathways [35]. For the single-locus survival
analysis, signatures were defined as those CpGs with pvalue < 0.006 (TAM, AI) and p-value < 0.002 (ER+/
HER2-) corresponding to signatures of ~ 2500 CpGs.
For the T47D RA experiment signatures were defined as
the top 10,000 CpGs ranked on p-value as determined
using a moderated F-test (limma package), which tests
Soleimani Dodaran et al. BMC Cancer
(2020) 20:676
whether a CpG is differentially methylated at any time
point versus WT, for the three sets of contrasts (TMX,
LTED, TMX/LTED) described above. We used a combination of Hallmark gene sets (collection H) and a subset of 16 curated gene sets (collection C2; gene set name
contained either “tamoxifen” or “endocrine_therapy”)
from the Molecular Signatures Database (MSigDB) v7.0
(Entrez Gene ID version) [36]. Resulting p-values were
corrected for multiple testing using the BenjaminiHochberg FDR.
We also tested whether the methylation loci identified
from the TCGA BRCA single-locus and multi-locus signatures (based on Illumina 450 K arrays) and represented on the Illumina EPIC array were enriched in the
T47D RA experiment using ROAST rotation-based gene
set tests (limma package) [37]. Enrichment of TAM and
AI survival signatures was assessed using the comparisons of respectively TMX and LTED treated cells to WT
baseline described above. Enrichment of the ER+/
HER2- survival signature was assessed using the comparison of the average of TMX and LTED treated
cells versus WT baseline described above. ROAST pvalues were calculated, for two alternative hypotheses
denoted as ‘up’ and ‘down’ using 9999 rotations. In
the ROAST analyses directional contribution weights
of 1 or − 1 were used depending on whether a CpG
of the signature under consideration had a positive
(corresponding to increased risk of an event) or negative (corresponding to decreased risk of an event) coefficient in the corresponding Cox model. In this
case, the alternative hypothesis ‘up’ corresponds to
methylation levels changing in the same direction in
the TCGA BRCA survival signature and in the T47D
RA experiment, whereas the alternative hypothesis
‘down’ corresponds to a change in the opposite direction (Fig. 2). The two-sided directional p-value is
reported.
Quantitative real-time PCR
Total RNA was isolated from WT and T47D cells
treated with tamoxifen or deprived from estrogen
with RNeasy Mini kit (Qiagen, Hilden, Germany) according to the manufacturer’s instructions and treated
with DNase Max Kit (Qiagen). cDNA was synthesized
with the Revert Aid H Minus First Strand cDNA Synthesis Kit (Fermentas, Waltham, MA, USA). Quantitative real-time PCR (qRT-PCR) reactions for target
genes were performed with the Applied Biosystems
QuantStudio™ 3 Real-Time PCR System, using probes
from the Universal Probe Library, UPL (Roche Diagnostics, Mannheim, Germany). The data were analyzed using the SDS software with the ΔΔCt method.
The Ct values were normalized to the housekeeping
gene ACTB.
Page 6 of 15
Results
Clinical variables are associated with survival in ER+/
HER2- cohort
For the TCGA BRCA ER+/HER2- cohort (N = 552, Fig.
1) we assessed whether the clinical variables menopause
status, AI treatment, tamoxifen treatment, tumour stage
and age at diagnosis were associated with survival, with
an event defined as first occurrence of a new tumour
event or death. In a univariable Cox proportional hazards model tumour stage (HR 1.92, 95% CI 1.43–2.59;
p = 1.63E-05) and age at diagnosis (HR 1.03, 95% CI
1.01–1.05; p = 2.40E-04) are significantly associated with
survival (Table 1). This is in agreement with previous
findings that a more advanced tumour stage and increased age are associated with poorer outcome [38].
Tamoxifen treatment, AI treatment and menopause status are not significantly associated with survival in our
cohort. When we included the clinical variables in a
multivariable Cox proportional hazards model, tumour
stage, age and AI treatment were selected for inclusion
in the final multivariable model using backward selection (Table 2).
Single methylation loci associated with survival
To identify individual methylation loci associated with
survival we fitted 320,504 Cox proportional hazard
models using the M-value of each CpG while adjusting
for the clinical variables selected in the multivariable
model above (tumour stage, age and AI treatment (ER+/
HER2- cohort only)). This resulted in 134, 5 and 1 CpGs
for which DNA methylation is significantly (adjusted pvalue < 0.05) associated with survival in the ER+/HER2-,
TAM, and AI cohort respectively (Additional File 4).
The Kaplan-Meier curves show a significant difference
in survival between the two groups stratified on median
methylation level for nearly all selected loci (Additional File 5). Interestingly, apart from three CpGs in
the ER+/HER2- signature, for all of the CpGs increased
methylation is associated with decreased risk of an event.
Additional File 6 shows the overlap of the signatures for
the three cohorts. Three out of five methylation loci
from the TAM signature are also found in the ER+/
HER2- signature and, consequently, the other two loci
are specific for tamoxifen treated patients. Since all patients in the TAM cohort are also included in the ER+/
HER2- cohort, overlap between the signatures is expected. TAM and AI signatures do not share methylation loci. ER+/HER2- and TAM signatures are enriched
for enhancer CpGs (ER+/HER2-: 36%, p = 0.0005; TAM:
80%, p = 0.0113; Fisher’s exact test, one-sided).
For all selected patients we had paired DNA methylation and gene expression data (Fig. 1). We therefore calculated the Pearson correlation coefficient between the
methylation profile of each locus in any of the three
Soleimani Dodaran et al. BMC Cancer
Fig. 2 (See legend on next page.)
(2020) 20:676
Page 7 of 15
Soleimani Dodaran et al. BMC Cancer
(2020) 20:676
Page 8 of 15
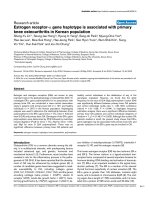
(See figure on previous page.)
Fig. 2 Validation of survival signatures in T47D resistance acquisition experiment. a Kaplan-Meier plots for two selected CpGs significantly
associated with survival in the ER+/HER2- cohort. Patients were stratified based on the methylation levels of a risk decreasing locus CpG↓ (left;
higher methylation is associated with longer survival) and a risk increasing locus CpG↑ (right; higher methylation is associated with shorter
survival). H, methylation levels above median; L, methylation levels below median. Shaded areas in the Kaplan-Meier plot denote the 95% CI in
the H and L strata. P-values are based on a log-rank test. b Example of a barcode enrichment plot for a TCGA BRCA survival signature in the cell
line comparison of treated (LTED or TMX) samples at time point t versus WT baseline. All methylation loci are ranked from left to right by
increasing log-fold change in the cell line comparison under consideration and represented by a shaded bar. Loci within the survival signature
are represented by vertical bars. Red bars correspond to risk increasing loci (for example, CpG↑ indicated with a solid bar), blue bars correspond
to risk decreasing loci (for example, CpG↓ indicated with a solid bar). In this example, the risk increasing loci tend to be hypermethylated (logfold change > 0) in the treated cell line and the risk decreasing loci tend to be hypomethylated (log-fold change < 0). That is, most loci change
in the same direction in the survival signature and the T47D RA experiment. c When using directional weights of 1 and − 1 for risk increasing and
risk decreasing loci respectively, the blue bars are mirrored across the black dashed line at a log-fold-change of 0. In this case for a ROAST gene
set test, the alternative hypothesis ‘up’ corresponds to methylation levels changing in the same direction whereas the alternative hypothesis
‘down’ corresponds to a change in the opposite direction
signatures and gene expression of the gene(s) closest to
that locus (Additional File 4). DNA methylation is significantly (adjusted p-value < 0.05) (anti-)correlated with
gene expression for 52 (of 136), 3 (of 5) and 2 (of 2)
CpG-gene pairs in the ER+/HER2-, TAM and AI signature respectively.
To gain insight in the main biological processes involved in differences in survival, we performed gene set
enrichment analyses on genes linked to CpG loci associated with survival. All three signatures are significantly
enriched (FDR < 0.1) in gene sets associated with ET or
endocrine resistance, genes activated when upregulating
the PI3K/AKT/mTOR pathway and genes upregulated
in response to TGFB1, which have both been implicated
in endocrine resistance [39, 40] (Additional File 12).
Multi-locus methylation signature associated with survival
Next we performed a multivariable analysis with elastic
net penalty to find combinations of methylation loci associated with survival in a Cox proportional hazards
model. This resulted in 203, 36 and 178 CpGs that are
included in the survival signatures of the ER+/HER2-,
TAM, and AI cohort respectively (Additional File 7).
The ER+/HER2- and AI signatures are enriched for enhancer loci (ER+/HER2-: 36%, p = 1.79E-05; AI: 29%,
p = 0.044; Fisher’s exact test, one-sided), whereas the
TAM signature is not significantly enriched for enhancer
loci (TAM: 36%, p = 0.051; Fisher’s exact test, oneTable 1 Univariable Cox proportional hazards model
HR
95% CI
P-value
Stage (per stage increment)
1.92
1.43–2.59
1.63E-05
Age (per 1-yr increment)
1.03
1.01–1.05
2.40E-04
AI treatment (vs. no AI treatment)
0.68
0.45–1.05
0.0812
Post-menopausal (vs. pre-menopausal)
1.52
0.94–2.45
0.0913
Tamoxifen treatment (vs. no
tamoxifen treatment)
0.67
0.42–1.07
0.0921
Univariable Cox proportional hazards model for clinical variables (ER+/HER2cohort). HR hazard ratio, CI confidence interval, AI aromatase inhibitor
sided). The risk score calculated from the multi-locus
signature and adjusted for tumour stage, age and AI
treatment (ER+/HER2- cohort only) is significantly associated with survival (p < 10E-12) for all three cohorts
(Additional File 8) indicating that DNA methylation is
an independent factor in predicting survival. The risk
scores calculated from the multi-locus signatures stratify
the patients in two groups for each cohort (Fig. 3a).
There is no overlap between the signatures of TAM
and AI cohorts. However, the ER+/HER2- signature
partly overlaps with the TAM and AI signatures (Fig.
3b). The coefficients in the Cox models corresponding
to the overlapping loci have an identical sign in both cohorts. The multi-locus signatures include a large number
of methylation loci that were also identified in the corresponding single-locus survival analysis. Out of 203
methylation loci in the ER+/HER2- multi-locus signature 34 were also found in the single-locus signature
(Additional File 9). Moreover, all methylation loci in the
TAM and AI single-locus signatures, five and one respectively, are part of the corresponding multi-locus
signature.
We assessed the stability of the multi-locus signatures
using a 10% leave-out test. The stability signature is
enriched in the original multi-locus signature for each
corresponding cohort (p < 0.05; Additional File 10).
We calculated the Pearson correlation coefficient between the methylation profile of each locus in any of the
three multi-locus signatures and gene expression of the
gene(s) closest to that locus (Additional File 7). DNA
methylation is significantly (adjusted p-value < 0.05)
Table 2 Multivariable Cox proportional hazards model
HR
95% CI
P-value
Stage (per stage increment)
2.15
1.61–2.89
3.05E-07
Age (per 1-yr increment)
1.04
1.02–1.05
2.48E-06
AI treatment (vs. no AI treatment)
0.61
0.40–0.94
0.026
Multivariable Cox proportional hazards model for clinical variables (ER+/HER2cohort). HR hazard ratio, CI confidence interval, AI aromatase inhibitor
Soleimani Dodaran et al. BMC Cancer
(2020) 20:676
Page 9 of 15
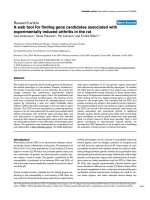
Fig. 3 Multi-locus survival analysis. a Kaplan-Meier plots of the patients stratified based on the risk scores of the multi-locus signature in ER+/
HER2, TAM and AI cohorts. H, risk score above median; L, risk score below median. Shaded areas denote the 95% CI in the H and L strata. Pvalues are based on a log-rank test. b Venn diagram denoting the number of methylation loci in the multi-locus signatures for the ER+/HER2-,
TAM, and AI cohorts’
(anti-)correlated with gene expression for 109 (of 235),
17 (of 37) and 57 (of 181) CpG-gene pairs in the ER+/
HER2-, TAM and AI signature respectively.
Profiling of resistance development in T47D cells
To investigate the possible association between DNA
methylation of the loci identified in the survival analyses
and ET resistance in more detail, we performed a time
course experiment using the T47D ER+ BRCA cell line
treated with tamoxifen or long-term estrogen deprived.
qRT-PCR analysis showed that endocrine resistance associated genes HDAC9 [41] and CD36 [42] are indeed
significantly increased in the treated cells compared to
WT (Additional File 11). Also known tamoxifen induced
genes KRT4 and FGF12 [43] show a significant upregulation in the treated cells. Next, we generated genomewide DNA methylation profiles for both treatments on
five different time points (0 (=WT), 1, 2, 5, and 7
months). We identified three signatures, corresponding
to CpGs that were differentially methylated over time in
TMX treated cells, LTED cells, and in the comparison of
the average of TMX and LTED cells versus WT. These
signatures consist of thousands of loci that are significantly differentially methylated over time versus WT. To
gain insight in the main biological processes involved in
RA, we performed gene set enrichment analyses on
genes associated with differentially methylated loci. All
three signatures are significantly enriched (FDR < 0.1) in
gene sets associated with ET or endocrine resistance,
gene sets related to metastasis such as the epithelialmesenchymal transition, gene sets corresponding to signaling pathways implicated in endocrine resistance such
as hedgehog signaling [44], and a gene set defining early
response to estrogen (Additional File 12).
Validation of survival signatures in T47D resistance
acquisition experiment
We then investigated the concordance between the CpG
loci in the survival signatures and in the RA signatures
(Fig. 2). The multi-locus survival signatures for ER+/
HER2- and AI are significantly enriched in the comparison of the last time point (7 months) versus WT baseline
Soleimani Dodaran et al. BMC Cancer
(2020) 20:676
Page 10 of 15
in the T47D RA experiment (ER+/HER2-: p = 0.0017,
AI: p = 0.0222; direction: ‘up’; Table 3). The signatures
are not enriched at earlier time points. However, the
proportion of CpGs contributing to enrichment in the
same direction (‘up’) increases over time until it becomes
significant for the last time point. The single-locus survival signature for TAM is also significantly enriched at
the 7-month time point in the T47D RA experiment
(p = 0.0032), but not for ER+/HER2- despite an increasing trend in the proportion of CpGs contributing to enrichment in the same direction (‘up’) over time
(Table 4). The single-locus AI signature consists of only
one CpG and an enrichment analysis is therefore not
possible. However, for this locus the change in methylation level when comparing LTED treated cells with WT
baseline is not concordant with the log-hazard ratio for
that locus (data not shown).
Also in terms of gene sets there is overlap between the
sets enriched in both the single-locus survival signatures
and RA signatures. Interestingly, one of the most significant gene sets in all six signatures consists of genes
down-regulated in response to ultraviolet (UV) radiation.
Many genes in this gene set are related to cell motility.
Indeed, upon UV stress cells down regulate nonessential processes such as invasion and motility,
whereas these processes are upregulated in resistant cells
that become more invasive. Four gene sets are
Table 3 ROAST test results for the multi-locus signatures
Time point
Direction
P-value
Prop. (down)
Prop. (up)
ER+/HER2- (193 CpG sites)
1
Up
0.3948
0.06
0.07
2
Up
0.6744
0.24
0.24
5
Up
0.3137
0.26
0.28
7
Up
0.0017
0.23
0.35
TAM (32 CpG sites)
1
Down
0.0995
0.06
0.03
2
Down
0.1736
0.16
0.06
5
Down
0.0037
0.28
0.06
7
Down
0.0028
0.22
0.13
AI (164 CpG sites)
1
Up
0.1004
0.05
0.13
2
Up
0.5434
0.15
0.22
5
Down
0.2088
0.24
0.23
7
Up
0.0222
0.15
0.26
Direction indicates the direction of change. Methylation loci were weighted by
their direction of change in the survival signature. ‘Up’ therefore corresponds
to changes in the same direction in the survival signature and in the T47D RA
experiment. That is, if a locus is risk in/decreasing in the survival signature
than it is hyper/hypomethylated in the cell line signature for the indicated
time point as compared to WT baseline. ‘Down’ corresponds to changes in the
opposite direction. Prop., proportion of loci in the signature contributing to
the estimated p-value and direction. Significant p-values (< 0.05) for
concordant changes (‘Up’) are indicated in bold
Table 4 ROAST test results for the single-locus signatures
Time ER+/HER2- (128 CpG sites)
TAM (5 CpG sites)
point
Direction PProp.
Prop. Direction P-value Prop.
Prop.
value (down) (up)
(down) (up)
1
Down
0.6920 0.11
0.07
Down
0.7699
0
0
2
Up
0.7571 0.16
0.20
Up
0.8784
0
0
5
Down
0.0365 0.30
0.25
Up
0.1013
0.2
0.4
7
Up
0.3455 0.25
0.31
Up
0.0032 0
0.6
Direction indicates the direction of change. Methylation loci were
weighted by their direction of change in the survival signature. ‘Up’
therefore corresponds to changes in the same direction in the survival
signature and in the T47D RA experiment. That is, if a locus is risk in/
decreasing in the survival signature than it is hyper/hypomethylated in
the cell line signature for the indicated time point as compared to WT
baseline. ‘Down’ corresponds to changes in the opposite direction. Prop.,
proportion of loci in the signature contributing to the estimated p-value
and direction. Significant p-values (< 0.05) for concordant changes (‘Up’)
are indicated in bold
significantly enriched (FDR < 0.1) in the two ER+/HER2signatures.. These include sets associated with endocrine
resistance and a gene set defining early response to estrogen (Fig. 4a, Additional File 12A). Six gene sets, several of them related to endocrine resistance, are
significantly enriched in the two tamoxifen signatures
(Fig. 4b, Additional File 12B). Two gene sets are significantly enriched in both the AI and LTED signature (Fig.
4c, Additional File 12C).
Discussion
We investigated whether TCGA DNA methylation profiles measured in primary ER+/HER2- tumours can be
used to predict development of resistance to ET in two
sub-cohorts of patients treated with tamoxifen or AI.
Using a single-locus Cox proportional hazard model we
were able to identify 134, 5 and 1 CpGs for which DNA
methylation is significantly associated with survival in
the ER+/HER2-, TAM and AI cohorts respectively, while
the corresponding multi-locus signatures consisted of
203, 36 and 178 CpGs. The multi-locus signatures
showed a large overlap of 25, 100, and 100% with the
ER+/HER2-, TAM and AI single-locus signatures respectively. The risk scores of the multi-locus signatures
were significantly associated with survival. Moreover, we
found that the ER+/HER2- and TAM single-locus and
ER+/HER2- and AI multi-locus signatures were significantly enriched for CpGs in enhancer regions suggesting
a functional effect (on gene expression) [18]. For both
the single-locus signatures (Additional File 6) and the
multi-locus signatures (Fig. 3b) we observed no overlap
of loci associated with survival between the AI and
TAM cohorts. This could be indicative of a difference in
development of resistance against tamoxifen or AI. This
is in line with earlier observations in endocrine-resistant
cells compared with wild type MCF7 cells, which also
showed limited overlap in their response to tamoxifen
Soleimani Dodaran et al. BMC Cancer
(2020) 20:676
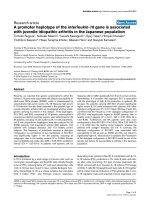
Fig. 4 Gene sets enriched in single-locus survival and resistance
acquisition signatures. Gene set enrichment analysis of single-locus
survival (x-axis) and RA signatures (y-axis). a T47D TMX/LTED
signature versus ER+/HER2− single-locus signature. b T47D TMX
signature versus TAM single-locus signature. c T47D LTED signature
versus AI single-locus signature. Each diamond represents either a
Hallmark (H) gene set or a curated gene set (C: Creighton, M:
Massarweh) related to tamoxifen treatment or ET from the Molecular
Signatures Database. Gene sets significantly enriched (FDR < 0.1, that
is -log10(FDR) > 1, indicated by the red dashed lines) in both
signatures are labelled with their name. See Additional File 12 for a
version of this figure in which more gene sets are labelled
and estrogen deprivation in terms of their gene expression [10] and DNA methylation profiles [18].
In our analyses we adjusted for clinical variables associated with survival (tumour stage, age and AI treatment
(ER+/HER2- cohort only)) in order to estimate the independent effect of methylation on survival. It has been
shown that methylation profiles can discriminate between the ER+/HER2- subtypes luminal A and B [45].
Moreover, patients with a luminal B tumour have worse
prognosis compared to patients with a luminal A
Page 11 of 15
tumour [46], which is also the case in our ER+/HER2cohort (HR 2.04, 95%CI 1.11–3.74, p = 0.020). We,
therefore, also performed survival analyses adjusted for
luminal status in addition to the clinical variables mentioned earlier. The single-locus signatures with correction for luminal status showed a considerable overlap of
85, 40, and 100% with the original (that is, without correction for luminal status) ER+/HER2-, TAM and AI
single-locus signatures respectively (Additional File 13).
Notably, all CpGs included in the original single-locus
signatures still have an FDR < 0.15 after correction for
luminal status. The risk scores of the original multilocus signatures were also significantly associated with
survival after correction for luminal status (Additional File 13). In summary, the methylation signatures
we identified are associated with survival independently
of luminal status.
We note that although the methylation profiles provided by TCGA are measured in untreated primary
tumour samples, treatment regimens after initial diagnosis are heterogeneous. Some patients received adjuvant
chemotherapy and/or radiotherapy next to ET and 42
patients in the TAM and AI cohorts received both types
of endocrine treatments. Moreover, the duration of
(endocrine) treatment varied among patients. Furthermore, treatment information may not be complete [21].
These aspects were not taken into account in our analyses and might have biased the results. We also acknowledge that this study is limited by the relatively
modest number of events (i.e., new tumour event, death)
for the different cohorts (ER+/HER2-: 97 events in 552
patients; TAM: 24 events in 172 patients; AI: 32 events
in 210 patients) due to the relatively short follow-up
time. This affects statistical power to identify methylation loci associated with survival.
In this study we assumed that the methylation events
in the primary tumour, rather than acquired methylation
during tumour progression, are associated with patient
survival as a proxy for development of therapy resistance. To validate our results we aimed to use methylation profiles from the International Cancer Genome
Consortium (ICGC). However, the number of patients in
the ICGC BRCA cohort with reliable information on
endocrine treatment was too small to make such a comparison meaningful. Instead, we used DNA methylation
measurements obtained from T47D cells as a model system for RA in ER+ luminal A BRCA. We showed that
our multi-locus signatures for the ER+/HER2- and AI
cohorts were conserved among the loci that are differentially methylated in endocrine-resistant T47D cells. Similarly, our single-locus signature for the TAM cohort was
also significantly enriched in the T47D experiment. At
the gene set level, several sets related to ET and endocrine resistance were significantly enriched in both the
Soleimani Dodaran et al. BMC Cancer
(2020) 20:676
survival and RA signatures. Although this is not a final
validation of our results, it strongly suggests that the loci
we identified from primary tumours, that is prior to any
endocrine treatment, are also associated with endocrine
resistance.
CpGs with concordant significant changes in the survival and RA signatures and with significant (anti-
Page 12 of 15
)correlation between paired DNA methylation and gene
expression profiles in TCGA BRCA are promising candidates for further investigation and are listed in Additional File 14. Most genes associated with these CpG
sites have been implicated in survival and resistance related processes in BRCA. In particular, high levels of
TSC2 and PXN are associated with decreased metastasis-
Fig. 5 Association of methylation levels of CpG site cg02198582 with survival and resistance acquisition and its correlation with TSC2 expression
levels. a Kaplan-Meier plot for CpG site cg02198582 located in the gene body of TSC2 and significantly associated with survival in the AI cohort.
Patients were stratified based on methylation levels. H, methylation levels above median; L, methylation levels below median. Shaded areas in the
Kaplan-Meier plot denote the 95% CI in the H and L strata. P-value is based on a log-rank test. b Correlation between paired DNA methylation
and gene expression profiles (cg02198582, TSC2). Each circle corresponds to a patient sample in the AI cohort. The Pearson correlation coefficient
is indicated, together with the corresponding regression line and its 95% CI. c Log2-fold change of the methylation M-values of cg02198582
inT47D LTED versus WT cells
Soleimani Dodaran et al. BMC Cancer
(2020) 20:676
free survival [47, 48]. This is in agreement with our findings that lower methylation of the corresponding CpG
loci is associated with decreased survival and that their
DNA methylation profile is negatively correlated with
gene expression (Fig. 5a-b, Additional File 15A-B). Interestingly, in the T47D RA experiment these loci are also
significantly hypomethylated in resistant cells compared
with WT (Fig. 5c, Additional File 15C). In the ER+/
HER2- single-locus signature, the cg07145834 locus in
the 5’UTR of ZHX2 was selected. Low levels of ZHX2
are associated with better overall survival [49], in
agreement with the findings from this study that
higher methylation of the corresponding CpG locus is
associated with increased survival, its DNA methylation profile is positively correlated with ZHX2 gene
expression, and the CpG locus is hypomethylated in
resistant cells compared with WT T47D cells (Additional File 15D-F).
Stone et al. [18] recently demonstrated in a small cohort of patients who received endocrine treatment
for at least five years that methylation levels in selected ESR1-enhancer loci were significantly increased in primary tumours of patients who relapsed
within six years as compared to patients with 14year relapse free survival. Moreover, these differences
were even more pronounced in matched local relapse samples. DNA methylation data measured in a
large number of pre- and post-treatment samples obtained from patients who received ET that either relapsed due to endocrine resistance or remained
relapse-free will enable validation of the signatures
identified in this and other studies. Moreover, such a
cohort enables comparison of methylation levels in
paired primary and local relapse samples providing
the opportunity to identify epigenetic drivers of
endocrine resistance [50].
Conclusions
In this study we identified individual and multivariable
DNA methylation markers associated with survival and
resistance in a large cohort of 552 ER+/HER2- BRCA
patients from The Cancer Genome Atlas. Survival signatures were validated using time series DNA methylation
profiles of T47D cells during development of resistance
to endocrine therapy. A number of promising targets
with concordant significant changes in survival and RA
signatures were identified. These include CpG sites associated with TSC2, PXN and ZHX2 that have all been implicated in survival related processes in BRCA. Our
results suggest that methylation signatures associated
with the development of endocrine resistance can also
be identified in primary breast tumours prior to any
endocrine treatment.
Page 13 of 15
Supplementary information
Supplementary information accompanies this paper at />1186/s12885-020-07100-z.
Additional file 1. Mapping to generic drug names. Overview of
synonyms and spelling variants for drug names used in TCGA BRCA and
their mapping to a generic drug name used in our study.
Additional file 2. Molecular subtypes. Overview of the molecular
subtype frequency as determined by immunohistochemistry of ER and
HER2 and as predicted by the SCMOD2 model (R package genefu) using
TGCA BRCA primary tumour gene expression data. Subtypes are listed for
the 1095 patients for whom gene expression data is available (Fig. 1).
Additional file 3. Sample annotation. Sample annotation for the 552
patients in the ER+/HER2- cohort. The first sheet provides a short
definition of the variables included in the second sheet.
Additional file 4. Single-locus survival analysis. Results of single-locus
survival analysis on ER+/HER2-, TAM and AI cohorts. For each CpG the results of the correlation analysis and of the differential methylation analysis
of month 7 versus WT in the T47D RA experiment are also included.
Additional file 5 Single-locus Kaplan-Meier plots. Kaplan-Meier plots for
each CpG site from the single-locus signatures. Patients were stratified
based on the methylation levels of the indicated locus in ER+/HER2, TAM
and AI cohorts. H, methylation level above median; L, methylation level
below median. Shaded areas denote the 95% CI in the H and L strata. Pvalues are based on a log-rank test.
Additional file 6. Single-locus Venn diagram. Venn diagram of the
single-locus signatures in the ER+/HER2-, TAM and AI cohorts.
Additional file 7. Multi-locus survival analysis. Results of multi-locus survival analysis on ER+/HER2-, TAM and AI cohorts. For each CpG the results
of the correlation analysis and of the differential methylation analysis of
month 7 versus WT in the T47D RA experiment are also included.
Additional file 8. Survival analysis using risk score. Results of survival
analysis of the multi-locus signature using the risk score corrected for selected clinical variables in ER+/HER2-, TAM and AI cohorts.
Additional file 9. Overlap between single-locus and multi-locus signatures. Venn diagrams of the overlap between single-locus and multi-locus
signatures in the three cohorts ER+/HER2-, TAM and AI. (PPTX 41 kb)
Additional file 10. Stability of multi-locus signatures. Results of Fisher’s
exact test to determine the significance of the overlap between the original multi-locus signature and the stability signature.
Additional file 11. qRT-PCR results. Primer sequences and gene expression levels of CD36, FGF12, HDAC9, and KRT4 determined by qRT-PCR
after treatment with tamoxifen or long-term estrogen deprivation relative
to their expression in untreated T47D cells.
Additional file 12. Gene set enrichment analysis. Gene set enrichment
analysis of single-locus survival (x-axis) and RA signatures (y-axis). (A) T47D
TMX/LTED signature versus ER+/HER2− single-locus signature. (B) T47D
TMX signatuare versus TAM single-locus signature. (C) T47D LTED signature versus AI single-locus signature. Each diamond represents either a
Hallmark gene set or a curated gene set related to tamoxifen treatment
or ET from the Molecular Signatures Database. Gene sets significantly
enriched (FDR < 0.1, that is -log10(FDR) > 1, indicated by the red dashed
lines) in at least one of the two signatures are labelled with their name.
Purple: gene sets that are significantly enriched in all three survival signatures. Red: gene sets that are significantly enriched in all three RA signatures. Blue: gene sets that are significantly enriched in all six signatures.
Additional file 13. Survival analyses including luminal status. Reanalysis
when also including luminal status in the (i) multivariable survival
analysis, (ii) single-locus survival analysis, and (iii) risk score for the multilocus signature.
Additional file 14. CpGs with concordant significant changes in the
survival and resistance acquisition signatures and with significant
correlation between paired DNA methylation and gene expression
profiles. CpGs in single-locus (Additional File 4) and multi-locus (Additional File 7) survival signatures were selected according to three additional criteria: (i) CpG DNA methylation is significantly (adjusted p-value
Soleimani Dodaran et al. BMC Cancer
(2020) 20:676
< 0.05) (anti-)correlated with expression of the nearby gene(s), (ii) CpG is
also significantly differentially methylated (adjusted p-value < 0.05) in the
corresponding RA signature at month 7 versus WT, (iii) CpG changes concordantly in survival and corresponding RA signature, that is, risk increasing loci are hypermethylated and risk decreasing loci are
hypomethylated.
Additional file 15. Association of methylation levels of selected CpG
sites with survival and resistance acquisition and their correlation with
expression levels of the associated genes. (A,D) Kaplan-Meier plot for CpG
site cg14094027 located in the gene body of PXN (A) and CpG site
cg07145834 located in the 5’UTR of ZHX2 (D), both significantly associated with survival in the ER+/HER2- cohort. Patients were stratified based
on methylation levels. H, methylation levels above median; L, methylation
levels below median. Shaded areas in the Kaplan-Meier plot denote the
95% CI in the H and L strata. P-values are based on a log-rank test. (B,E)
Correlation between paired DNA methylation and gene expression profiles (B: cg14094027, PXN; E: cg07145834, ZHX2). Each circle corresponds
to a patient sample in the ER+/HER2- cohort. The Pearson correlation coefficient is indicated, together with the corresponding regression line and
its 95% CI. (C,F) Log2-fold change of the methylation M-values of
cg14094027 (C) and cg07145834 (F) in the comparison of T47D TMX/
LTED versus WT.
Abbreviations
AI: Aromatase inhibitor; BRCA: Breast cancer; CI: Confidence interval;
ESR1: Estrogen receptor 1; ER: Estrogen receptor; ET: Endocrine therapy;
FDR: False discovery rate; H3K27ac: Acetylation of lysine 27 on histone 3;
HR: Hazard ratio; LTED: Long-term estrogen deprived/deprivation;
RA: Resistance acquisition; SE: Standard error; TAM: Tamoxifen (patient data);
TCGA: The Cancer Genome Atlas; TMX: Tamoxifen (cell line experiment)
Acknowledgements
We acknowledge Dr. Alex Michie and Dr. Age K. Smilde for their helpful
suggestions while carrying out this research. The results shown here are in
part based upon data generated by the TCGA Research Network: https://
www.cancer.gov/tcga.
Authors’ contributions
MS performed the data analysis, interpreted the results, and drafted the
manuscript. SB drafted parts of the manuscript, performed the qRT-PCR experiment and, together with ES, performed the cell line experiment under
supervision of SW. SB, ES, PJV and SW critically reviewed the manuscript. MS,
PJV, SW, PDM and AHCvK interpreted the results. PDM and AHCvK conceived
the study, supervised the project and helped draft the manuscript. All authors read and approved the final manuscript.
Funding
This work was supported by EpiPredict which received funding from the
European Union’s Horizon 2020 research and innovation programme under
Marie Skłodowska-Curie grant agreement No 642691.
Availability of data and materials
The DNA methylation dataset supporting the conclusions of this article is
available in the Genomics Data Commons Legacy Archive (.
cancer.gov/legacy-archive) repository. The other datasets supporting the
conclusions of this article are included within the article and its additional
files.
Ethics approval and consent to participate
Not applicable.
Consent for publication
Not applicable.
Competing interests
The authors declare that they have no competing interests.
Author details
1
Bioinformatics Laboratory, Department of Clinical Epidemiology, Biostatistics,
and Bioinformatics, Amsterdam Public Health research institute, Amsterdam
Page 14 of 15
UMC, University of Amsterdam, Meibergdreef 9, Amsterdam, AZ 1105, The
Netherlands. 2Biosystems Data Analysis, Swammerdam Institute for Life
Sciences, University of Amsterdam, Science Park 904, Amsterdam 1098 XH,
The Netherlands. 3Division of Molecular Genome Analysis, German Cancer
Research Center (DKFZ), Im Neuenheimer Feld 580, 69120 Heidelberg,
Germany. 4Faculty of Biosciences, University Heidelberg, 69120 Heidelberg,
Germany. 5Synthetic Systems Biology and Nuclear Organization,
Swammerdam Institute for Life Sciences, University of Amsterdam, Science
Park 904, Amsterdam 1098 XH, The Netherlands.
Received: 5 November 2019 Accepted: 23 March 2020
References
1. Ferlay J, Colombet M, Soerjomataram I, Dyba T, Randi G, Bettio M, et al.
Cancer incidence and mortality patterns in Europe: estimates for 40
countries and 25 major cancers in 2018. Eur J Cancer. 2018;103:356–87.
2. Johnston SJ, Cheung KL. Endocrine therapy for breast Cancer: a model of
hormonal manipulation. Oncol Ther. 2018;6(2):141–56.
3. Early Breast Cancer Trialists’ Collaborative G. Effects of chemotherapy and
hormonal therapy for early breast cancer on recurrence and 15-year
survival: an overview of the randomised trials. Lancet. 2005;365(9472):1687–
717.
4. Pouliot MC, Labrie Y, Diorio C, Durocher F. The role of methylation in breast
Cancer susceptibility and treatment. Anticancer Res. 2015;35(9):4569–74.
5. Abdel-Hafiz H. Epigenetic mechanisms of Tamoxifen resistance in luminal
breast Cancer. Diseases. 2017;5(3):16.
6. Clarke R, Tyson JJ, Dixon JM. Endocrine resistance in breast cancer--an
overview and update. Mol Cell Endocrinol. 2015;418(Pt 3):220–34.
7. Bianco S, Gevry N. Endocrine resistance in breast cancer: from cellular
signaling pathways to epigenetic mechanisms. Transcription. 2012;3(4):165–
70.
8. O'Sullivan DE, Johnson KC, Skinner L, Koestler DC, Christensen BC.
Epigenetic and genetic burden measures are associated with tumor
characteristics in invasive breast carcinoma. Epigenetics. 2016;11(5):344–53.
9. Hervouet E, Cartron PF, Jouvenot M, Delage-Mourroux R. Epigenetic
regulation of estrogen signaling in breast cancer. Epigenetics. 2013;8(3):237–
45.
10. Nguyen VTM, Barozzi I, Faronato M, Lombardo Y, Steel JH, Patel N, et al.
Differential epigenetic reprogramming in response to specific endocrine
therapies promotes cholesterol biosynthesis and cellular invasion. Nat
Commun. 2015;6:10044.
11. Fleischer T, Tekpli X, Mathelier A, Wang S, Nebdal D, Dhakal HP, et al. DNA
methylation at enhancers identifies distinct breast cancer lineages. Nat
Commun. 2017;8(1):1379.
12. Pathiraja TN, Nayak SR, Xi Y, Jiang S, Garee JP, Edwards DP, et al. Epigenetic
reprogramming of HOXC10 in endocrine-resistant breast cancer. Sci Transl
Med. 2014;6(229):229ra41.
13. Williams KE, Anderton DL, Lee MP, Pentecost BT, Arcaro KF. High-density
array analysis of DNA methylation in Tamoxifen-resistant breast cancer cell
lines. Epigenetics. 2014;9(2):297–307.
14. Gnyszka A, Jastrzebski Z, Flis S. DNA methyltransferase inhibitors and their
emerging role in epigenetic therapy of Cancer. Anticancer Res. 2013;33(8):
2989–96.
15. Lin X, Li J, Yin G, Zhao Q, Elias D, Lykkesfeldt AE, et al. Integrative analyses
of gene expression and DNA methylation profiles in breast cancer cell line
models of tamoxifen-resistance indicate a potential role of cells with stemlike properties. Breast Cancer Res. 2013;15(6):R119.
16. Gyorffy B, Bottai G, Fleischer T, Munkacsy G, Budczies J, Paladini L, et al.
Aberrant DNA methylation impacts gene expression and prognosis in
breast cancer subtypes. Int J Cancer. 2016;138(1):87–97.
17. Fleischer T, Frigessi A, Johnson KC, Edvardsen H, Touleimat N, Klajic J, et al.
Genome-wide DNA methylation profiles in progression to in situ and
invasive carcinoma of the breast with impact on gene transcription and
prognosis. Genome Biol. 2014;15(8):435.
18. Stone A, Zotenko E, Locke WJ, Korbie D, Millar EK, Pidsley R, et al. DNA
methylation of oestrogen-regulated enhancers defines endocrine sensitivity
in breast cancer. Nat Commun. 2015;6:7758.
19. Koboldt D, Fulton R, McLellan M, et al. Comprehensive molecular portraits
of human breast tumours. Nature. 2012;490(7418):61–70.
Soleimani Dodaran et al. BMC Cancer
(2020) 20:676
20. Zhang F, Cui Y. Dysregulation of DNA methylation patterns may identify
patients with breast cancer resistant to endocrine therapy: a predictive
classifier based on differentially methylated regions. Oncol Lett. 2019;18(2):
1287–303.
21. Liu J, Lichtenberg T, Hoadley KA, Poisson LM, Lazar AJ, Cherniack AD, et al.
An integrated TCGA pan-Cancer clinical data resource to drive high-quality
survival outcome analytics. Cell. 2018;173(2):400–16 e11.
22. Colaprico A, Silva TC, Olsen C, Garofano L, Cava C, Garolini D, et al.
TCGAbiolinks: an R/bioconductor package for integrative analysis of TCGA
data. Nucleic Acids Res. 2016;44(8):e71.
23. Robinson MD, McCarthy DJ, Smyth GK. edgeR: a bioconductor package for
differential expression analysis of digital gene expression data.
Bioinformatics. 2010;26(1):139–40.
24. Gendoo DM, Ratanasirigulchai N, Schroder MS, Pare L, Parker JS, Prat A,
et al. Genefu: an R/bioconductor package for computation of gene
expression-based signatures in breast cancer. Bioinformatics. 2016;32(7):
1097–9.
25. Aryee MJ, Jaffe AE, Corrada-Bravo H, Ladd-Acosta C, Feinberg AP, Hansen
KD, et al. Minfi: a flexible and comprehensive bioconductor package for the
analysis of Infinium DNA methylation microarrays. Bioinformatics. 2014;
30(10):1363–9.
26. Fortin JP, Labbe A, Lemire M, Zanke BW, Hudson TJ, Fertig EJ, et al.
Functional normalization of 450k methylation array data improves
replication in large cancer studies. Genome Biol. 2014;15(12):503.
27. Chen YA, Lemire M, Choufani S, Butcher DT, Grafodatskaya D, Zanke BW,
et al. Discovery of cross-reactive probes and polymorphic CpGs in the
Illumina Infinium HumanMethylation450 microarray. Epigenetics. 2013;8(2):
203–9.
28. Ronneberg JA, Fleischer T, Solvang HK, Nordgard SH, Edvardsen H,
Potapenko I, et al. Methylation profiling with a panel of cancer related
genes: association with estrogen receptor, TP53 mutation status and
expression subtypes in sporadic breast cancer. Mol Oncol. 2011;5(1):61–76.
29. Lyman GH, Kuderer NM, Lyman SL, Debus M, Minton S, Balducci L, et al.
Menopausal status and the impact of early recurrence on breast Cancer
survival. Cancer Control. 1997;4(4):335–41.
30. Cianfrocca M, Goldstein LJ. Prognostic and predictive factors in early-stage
breast cancer. Oncologist. 2004;9(6):606–16.
31. van Buuren S, Groothuis-Oudshoorn K. Mice: multivariate imputation by
chained equations in R. J Stat Softw. 2011;45(3):1–67.
32. Simon N, Friedman J, Hastie T, Tibshirani R. Regularization paths for Cox's
proportional hazards model via coordinate descent. J Stat Softw. 2011;39(5):
1–13.
33. Martin LA, Ghazoui Z, Weigel MT, Pancholi S, Dunbier A, Johnston S, et al.
An in vitro model showing adaptation to long-term oestrogen deprivation
highlights the clinical potential for targeting kinase pathways in
combination with aromatase inhibition. Steroids. 2011;76(8):772–6.
34. Pidsley R, Zotenko E, Peters TJ, Lawrence MG, Risbridger GP, Molloy P, et al.
Critical evaluation of the Illumina MethylationEPIC BeadChip microarray for
whole-genome DNA methylation profiling. Genome Biol. 2016;17(1):208.
35. Phipson B, Maksimovic J, Oshlack A. missMethyl: an R package for analyzing
data from Illumina's HumanMethylation450 platform. Bioinformatics. 2016;
32(2):286–8.
36. Liberzon A, Birger C, Thorvaldsdottir H, Ghandi M, Mesirov JP, Tamayo P.
The molecular signatures database (MSigDB) hallmark gene set collection.
Cell Syst. 2015;1(6):417–25.
37. Wu D, Lim E, Vaillant F, Asselin-Labat ML, Visvader JE, Smyth GK. ROAST:
rotation gene set tests for complex microarray experiments. Bioinformatics.
2010;26(17):2176–82.
38. Saadatmand S, Bretveld R, Siesling S, Tilanus-Linthorst MMA. Influence of
tumour stage at breast cancer detection on survival in modern times:
population based study in 173 797 patients. Br Med J. 2015;351:h4901.
39. Paplomata E, O'Regan R. The PI3K/AKT/mTOR pathway in breast cancer:
targets, trials and biomarkers. Ther Adv Med Oncol. 2014;6(4):154–66.
40. Perry RR, Kang Y, Greaves BR. Relationship between tamoxifen-induced
transforming growth factor beta 1 expression, cytostasis and apoptosis in
human breast cancer cells. Br J Cancer. 1995;72(6):1441–6.
41. Linares A, Assou S, Lapierre M, Thouennon E, Duraffourd C, Fromaget C,
et al. Increased expression of the HDAC9 gene is associated with
antiestrogen resistance of breast cancers. Mol Oncol. 2019;13(7):1534–47.
Page 15 of 15
42. Liang Y, Han H, Liu L, Duan Y, Yang X, Ma C, et al. CD36 plays a critical role
in proliferation, migration and tamoxifen-inhibited growth of ER-positive
breast cancer cells. Oncogenesis. 2018;7(12):98.
43. Palaniappan M, Edwards D, Creighton CJ, Medina D, Conneely OM.
Reprogramming of the estrogen responsive transcriptome contributes to
tamoxifen-dependent protection against tumorigenesis in the p53 null
mammary epithelial cells. PLoS One. 2018;13(3):e0194913.
44. Diao Y, Azatyan A, Rahman MF, Zhao C, Zhu J, Dahlman-Wright K, et al.
Blockade of the hedgehog pathway downregulates estrogen receptor alpha
signaling in breast cancer cells. Oncotarget. 2016;7(44):71580–93.
45. Stefansson OA, Moran S, Gomez A, Sayols S, Arribas-Jorba C, Sandoval J,
et al. A DNA methylation-based definition of biologically distinct breast
cancer subtypes. Mol Oncol. 2015;9(3):555–68.
46. Fallahpour S, Navaneelan T, De P, Borgo A. Breast cancer survival by
molecular subtype: a population-based analysis of cancer registry data.
CMAJ Open. 2017;5(3):E734–E9.
47. Liu H, Radisky DC, Nelson CM, Zhang H, Fata JE, Roth RA, et al. Mechanism
of Akt1 inhibition of breast cancer cell invasion reveals a protumorigenic
role for TSC2. Proc Natl Acad Sci U S A. 2006;103(11):4134–9.
48. Montalto FI, Giordano F, Chiodo C, Marsico S, Mauro L, Sisci D, et al.
Progesterone Receptor B signaling Reduces Breast Cancer Cell
Aggressiveness: Role of Cyclin-D1/Cdk4 Mediating Paxillin Phosphorylation.
Cancers (Basel). 2019;11(8):1201.
49. You Y, Ma Y, Wang Q, Ye Z, Deng Y, Bai F. Attenuated ZHX3 expression
serves as a potential biomarker that predicts poor clinical outcomes in
breast cancer patients. Cancer Manag Res. 2019;11:1199–210.
50. Chatterjee A, Rodger EJ, Eccles MR. Epigenetic drivers of tumourigenesis
and cancer metastasis. Semin Cancer Biol. 2018;51:149–59.
Publisher’s Note
Springer Nature remains neutral with regard to jurisdictional claims in
published maps and institutional affiliations.