Sarcoma epidemiology and cancer-related hospitalisation in Western Australia from 1982 to 2016: A descriptive study using linked administrative data
Bạn đang xem bản rút gọn của tài liệu. Xem và tải ngay bản đầy đủ của tài liệu tại đây (1.03 MB, 11 trang )
Wright et al. BMC Cancer
(2020) 20:625
/>
RESEARCH ARTICLE
Open Access
Sarcoma epidemiology and cancer-related
hospitalisation in Western Australia from
1982 to 2016: a descriptive study using
linked administrative data
Cameron M. Wright1,2* , Georgia Halkett3 , Richard Carey Smith4
and Rachael Moorin1,5
Abstract
Background: Sarcomas are a heterogeneous group of malignancies arising from mesenchymal cells.
Epidemiological studies on sarcoma from Australia are lacking, as previous studies have focused on a sarcoma type
(e.g. soft tissue) or anatomical sites.
Methods: Linked cancer registry, hospital morbidity and death registration data were available for Western Australia
(WA) from 1982 to 2016. All new sarcoma cases among WA residents were included to estimate incidence,
prevalence, relative survival and cancer-related hospitalisation, using the Information Network on Rare Cancers
(RARECARENet) definitions. To provide a reference point, comparisons were made with female breast, colorectal,
prostate and lung cancers.
Results: For 2012–16, the combined sarcoma crude annual incidence was 7.3 per 100,000, with the majority of
these soft tissue sarcoma (STS, incidence of 5.9 per 100,000). The age-standardised incidence and prevalence of STS
increased over time, while bone sarcoma remained more stable. Five-year relative survival for the period 2012–16
for STS was 65% for STS (higher than lung cancer, but lower than prostate, female breast and colorectal cancers),
while five-year relative survival was 71% for bone sarcoma. Cancer-related hospitalisations cost an estimated
$(Australian) 29.1 million over the study period.
Conclusions: STS incidence has increased over time in WA, with an increasing proportion of people diagnosed
aged ≥65 years. The analysis of health service use showed sarcoma had a lower mean episode of cancer-related
hospitalisation compared to the reference cancers in 2016, but the mean cost per prevalent person was higher for
sarcoma than for female breast, colorectal and prostate cancers.
Keywords: Sarcoma, Epidemiology, Incidence, Prevalence, Survival
* Correspondence:
1
Health Economics and Data Analytics, School of Public Health, Faculty of
Health Sciences, Curtin University, GPO Box U1987, Perth, Western Australia
6845, Australia
2
School of Medicine, College of Health & Medicine, University of Tasmania,
Churchill Avenue, Hobart, Tasmania 7005, Australia
Full list of author information is available at the end of the article
© The Author(s). 2020 Open Access This article is licensed under a Creative Commons Attribution 4.0 International License,
which permits use, sharing, adaptation, distribution and reproduction in any medium or format, as long as you give
appropriate credit to the original author(s) and the source, provide a link to the Creative Commons licence, and indicate if
changes were made. The images or other third party material in this article are included in the article's Creative Commons
licence, unless indicated otherwise in a credit line to the material. If material is not included in the article's Creative Commons
licence and your intended use is not permitted by statutory regulation or exceeds the permitted use, you will need to obtain
permission directly from the copyright holder. To view a copy of this licence, visit />The Creative Commons Public Domain Dedication waiver ( applies to the
data made available in this article, unless otherwise stated in a credit line to the data.
Wright et al. BMC Cancer
(2020) 20:625
Background
Sarcomas are a heterogeneous group of malignancies
arising from mesenchymal cells. The incidence of soft
tissue sarcoma (STS) is proportionately much higher
than malignant osseous and chondromatous neoplasms
(hereafter referred to as ‘bone sarcoma’) [1].
In Australia there are some published studies on
sarcoma epidemiology. Woods et al. [2] reported an
annual incidence of 1.59 per 100,000 for head and
neck sarcoma from 1982 to 2009. The Cancer Council Queensland included sarcoma in their overview of
childhood cancer in Australia [3], finding an increased
incidence of osteosarcoma by 1.1% over the period
1983 to 2005. Work using the former Western Australian (WA) Bone Tumour Registry, now incorporated into the WA Cancer Registry (WACR) found
from 1972 to 1996 there were 263 cases of primary
malignant bone tumour reported in WA [4]. Authors
of an Australian study of dermal sarcoma reported a
mean annual incidence of 2.09 per 100,000 for cases
between 1982 and 2009 [5]. A recent study focusing
on STS found the age-standardised incidence increased in Australia from 4.7 to 5.87 per 100,000
from 1982 to 2009 [6].
In WA there is a lack of contemporary information about the burden of sarcoma. Basic descriptive
epidemiology – incidence, prevalence, survival – is
essential to guide efforts to manage and plan resources for management of patients with sarcoma.
Furthermore, description of the health service utilisation can provide insight into patterns of care for
those diagnosed with sarcoma. These data can also
be used to support a recent Australian Government
program which aims to increase clinical trial activity
in rare cancers and rare diseases [7].
The aim of this study was therefore to determine the
burden of sarcoma in terms of incidence, prevalence,
relative survival, use and costs of hospital services in
WA between 1982 and 2016, inclusive. As this information in isolation lacks a reference point, comparison was
made to four common cancers: female breast, colorectal,
prostate and lung cancers.
Methods
The reporting of this population-based retrospective
cohort study is based on the Reporting of studies
Conducted using Observational Routinely-collected
health Data (RECORD) statement [8]. The study was
approved by the WA Department of Health Human
Research Ethics Committee (2012/42), which
exempted the study from obtaining individual patient
consent.
Page 2 of 11
Data sources and linkage
The data sources analysed were: (i) the WACR; (ii) the
hospital morbidity data collection (HMDC, from 1998),
and; (iii) death registrations. These datasets are routinely
linked by the WA Data Linkage Branch [9]. At June
2016 WA had a population of ~ 2.56 million (10.6% of
the national population of ~ 24.2 million [10]).
Description of participants
WACR data from 1 January 1982 to 31 December 2016
were used. All new, invasive malignant cases among WA
residents were included in the incidence and prevalence
analyses, including cancers of unknown primary site.
Multiple primary cancers were included, with the
WACR following the International Association of Cancer Registry (IARC) rules for multiple primary cancers
[11]. Multiple primary cancers are separate records in
the same individual, but not a metastasis from an initial
primary. Usually multiple primaries are in separate topographical (anatomical) sites, but histologically different
malignancies in the same site would be considered as
two separate primaries (e.g. a breast carcinoma and a
Phyllodes tumour of the breast would both be recorded).
Kaposi’s sarcoma is only counted once per individual
using the IARC rules, even if identified in multiple body
sites at different times. For the survival analyses, records
with an unknown age at diagnosis, death certificate only
diagnoses, an age > 115 years at censoring, a date of
death prior to the diagnostic date, or with no survival
time (i.e. diagnostic date equal to date of death) were excluded [12]. For the hospital analysis, the chronologically
first sarcoma from the group used in the survival analysis was linked to subsequent hospitalisations presentations (i.e. only hospitalisations occurring post-diagnosis
were included).
Selection of cancer types
Sarcoma was selected using the latest definitions and
three tier hierarchy reported by the Information Network on Rare Cancers (RARECARENet) [13] (Additional file 1). Tier 1 refers to soft tissue sarcoma, bone
sarcoma, gastro-intestinal stromal tumour (GIST) and
Kaposi sarcoma. For this study, sarcoma was considered
the sum of the tier 1 entities. This is consistent with the
approach by Gatta et al. [14], though these authors classified Kaposi sarcoma as skin cancers and noncutaneous melanoma. The tier 2 allocation separates soft
tissue sarcoma anatomically and bone sarcoma into its
origin in bone, cartilage etc. Tier 3 considers histology.
Histological classification systems have evolved considerably over the study period, with the description of new
entities and reclassification of others. For the purposes
of the study, diagnoses recorded at the time were
Wright et al. BMC Cancer
(2020) 20:625
Page 3 of 11
retained, albeit if some have now been modified or replaced e.g. malignant fibrous histiocytoma.
This topographical and histological inclusion is different to the allocation of sarcoma published on the Cancer
Australia website [1], but allowed for a more detailed description of sarcoma epidemiology. The reference cancer
types were female breast (International Classification of
Disease (ICD)-10 code C50), colorectal (ICD-10 codes
C18-C20, C218), prostate (ICD-10 code C61), and lung
(ICD-10 codes C33, C34).
would be prevalent in 2016, had the start of the study
period been 1 January 2016, was calculated. This was
then repeated working backwards by 1 year (i.e. 1 January 2015, 1 January 2014 and so on). This generated a
proportion of the ‘actual’ prevalent population at mid2016 which could then be used to generate a ‘correction
factor’ to multiply by the apparent prevalence for each
year according to the equation:
Outcomes
Where CP = corrected prevalence, P = prevalence, X =
the year to be corrected, and Y = the number of years of
look-back data available for year X. For example, if there
were 1000 cases prevalent in mid-2016, but that number
would have been 50 if the start of the study period had
been 2016 instead of 1982, this would yield a ‘correction
factor’ of 50/1000 (=0.05) for mid-1982, where there was
only 6 months of diagnostic data available. If the measured prevalence in mid-1982 was 10, the corrected
prevalence would then be 200 (10 divided by 0.05). As
GIST was first recognised as a diagnostic entity during
the study period, this was not reported separately in the
prevalence analysis.
Study outcomes were; (i) incidence; (ii) corrected prevalence; (iii) relative survival, and; (iv) annual total and rate
of hospitalisation and associated costs.
Statistical analysis
All analyses were conducted using Stata SE Version 15
(College Station, Texas).
Descriptive statistics
Descriptive statistics were generated stratified by the following diagnostic periods: 1982–87; 1988–93; 1994–99;
2000–05; 2006–11, and; 2012–16. Differences in categorical variables between periods were assessed statistically using the Pearson’s chi-squared test or Fisher’s
Exact test (the latter for small cell sizes), while continuous variables were assessed using the Kruskal-Wallis
test.
Incidence
Age-standardised incidence per 100,000 was calculated
using the WA mid-year populations published by the
Australian Bureau of Statistics (ABS), stratified into 5year age groups [10]. The European Standard Population
(2013) was used as a reference for age-standardisation,
to allow comparison of incidence between periods to incidence reported by RARECARENet [15]. Crude incidence by broad diagnostic age group and sex was also
reported for 2016.
Prevalence
Prevalence was calculated at 30 June for each diagnostic
year by summing incident cases prior to this date among
individuals who had not died. Because the prevalent
period was 34.5 years (i.e. 1 January 1982 to 30 June
2016), it was assumed that the prevalence in 2016 was
accurate. However, for previous years, there was less
follow-up and thus a higher chance that people previously diagnosed with sarcoma and still alive were diagnosed before 1982 and therefore not counted among the
prevalent population. The approach taken with an earlier
analysis of WA data by Maxwell et al. [16] was adopted
to correct for this. First, the number of individuals who
À
Á
CP ¼ Px = P2016Yyears =P2016;34:5 years
Relative survival
Relative survival was estimated using the Ederer II
method and a period approach for 2012–2016, using the
– strs – user-written command [17, 18]. The relative
survival approach compared survival of the group with
sarcoma to that of the general WA population. Relative
survival is one of several cancer survival measures (see
Baade et al. [19]). It was selected for this study because
the measure is reported for sarcoma by RARECARENet
[20] and Cancer Australia [1]. Single year-age and sexspecific death rates for WA published by the ABS were
used [21]. For ages where there were no data, the mean
of the previous and subsequent years was used. Individual cancer records ‘entered’ at 1 January 2012 and were
followed to the first of all-cause death (failure) or 31 December 2016. The date of death according to the mortality registry was used, unless there was date uncertainty
or the date of death was missing, in which case the date
of death recorded in the cancer registry was used.
Health service use
Linked hospital admission records were considered
cancer-related if they contained a cancer principal diagnosis, chemotherapy or radiotherapy procedure codes
[16] (Additional file 1). The total number of episodes
and mean episodes per corrected prevalent person, along
with the total cost and mean cost per prevalent person,
was reported by year of admission. Inter-hospital transfers were considered as a single episode. The cost of
Wright et al. BMC Cancer
(2020) 20:625
each episode of care was assigned based on average price
weight for each Australian Refined Diagnosis Related
Group (AR-DRG) code specific to the date of separation
of each hospital record [22]. Cost values were reported
in Australian dollars ($), adjusted to March 2019 using
consumer price indices [23].
Results
Descriptive statistics
In total 4512 records met the inclusion criteria. Of these,
523 (12%) were excluded on the basis of not being malignant (191 (4%) benign, 315 (7%) uncertain if malignant or benign and 8 (0.2%) primary malignant, but not
new). A further 11 (0.2%) were for non-WA residents
and 1 (0.02%) was a duplicate record. This left 3989 sarcoma records (3 records fulfilled more than one exclusion criteria) for the analysis of incidence and prevalence
(Table 1). A further 23 were excluded for the survival
analysis, and a further 15 excluded for the health service
utilisation analysis (n = 3951 included). Incident records
comprised 54% males and 88% were diagnosed at ≥25
years (Table 1). Seventy-six percent of cases were
STS (n = 3024), with 595 bone sarcomas (15%), 223
GISTs (6%) and 147 (4%) Kaposi sarcomas. The proportion of STS among the ≥65 age group increased over
time (p = 0.03). Major notable differences between the
broad sarcoma types were a tendency toward younger
age at diagnosis for bone sarcoma (median age at diagnosis 38 years, compared to STS at 58 years) and a lower
all-cause death (44.4%) and higher median follow-up for
this group (5.4 years). Exceptions to the broad trends in
age distribution and sex were a high proportion (79%) of
those with STS of the uterus and STS of the peritoneum
and retroperitoneum (60%) being aged 25–64 years, a
higher proportion female than male among those with
STS of the genitourinary tract (52%) and peritoneum
and retroperitoneum (55%), and 50.5% of osseous
Ewing’s sarcoma being diagnosed aged 0–14 years.
Incidence
The mean annual age-standardised incidence per 100,
000 are provided in Table 2. For sarcoma, there was an
increase in incidence over the study period, with the incidence 6.6 per 100,000 for 1982–87 (95% confidence
interval (CI) 5.9–7.3), increasing to 9.0 (95% CI 8.4–9.6)
for 2012–16. This was underpinned by an increase in
STS incidence (5.4 per 100,000 for 1982–87; 7.2 per 100,
000 for 2012–16), while there was comparatively little
change for bone sarcoma, or Kaposi sarcoma. The limbs
were the most common site for STS, with 2.3 per 100,
000 in 2012–16, followed by skin (1.4), uterus (0.9) and
superficial trunk (0.7). Bone sarcomas were most commonly osteogenic/osteosarcoma (0.3 per 100,000 if
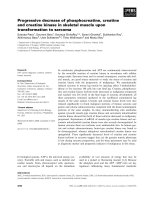
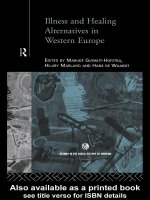
2012–16). Assessing crude incidence for 2012–16 by age
Page 4 of 11
group or sex, the highest incidence of STS per 100,000
was for people aged ≥65 years (19.2) and was higher for
males (6.3, relative to 5.4 per 100,000 for females)
(Fig. 1). Bone sarcoma had an incidence of 1.6 per 100,
000 for those aged 15–24 years, which was higher than
the 1.4 per 100,000 for STS in this age group and similar
to 1.7 per 100,000 for bone sarcoma diagnosed among
those aged ≥65 years.
Leiomyosarcoma was the most common STS histology
type (17%), followed by malignant fibrous histiocytoma
(13%). STS of the head and neck were more often malignant fibrous histiocytoma (21%), while STS of the breast
were mainly either Phyllodes tumours (50%) or epitheloid angiosarcomas (22%). STS of the skin had a higher
proportion of dermatofibrosarcoma pertuberans (38%)
relative to other sites. Bone sarcoma were 23% conventional osteosarcoma, 25% chondrosarcoma and 13%
Ewing sarcoma (data not shown).
Prevalence
At June 2016, there were 1445 prevalent STS cases, 329
bone sarcoma and 48 Kaposi sarcoma. Forty-four percent of prevalent STS cases were diagnosed > 10 years
prior, with 19% 5–10 years prior, 26% 1–5 years prior
and 11% in the previous year. The corresponding percentages for bone sarcoma were 54, 21, 22 and 4%. STS
prevalence increased from 31 to 57 per 100,000 between
1982 and 2016, while bone sarcoma prevalence decreased from 21 per 100,000 to 13 per 100,000
(Additional file 2).
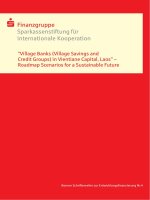
Relative survival
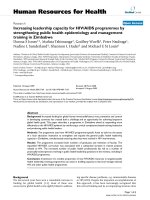
One- and five-year relative survival estimates for tier 1
entities and reference cancers are provided in Fig. 2.
Bone sarcoma had a relative survival of 90% at one year
and 71% at five years, with the five-year relative of survival of GIST (78%) and Kaposi sarcoma (89%) higher
still. One-year relative survival was lower for STS of the
viscera (60%), pelvis (66%), brain and other parts of the
nervous system (73%) and uterus (78%) relative to other
sarcoma types; by contrast STS of the head and neck,
limbs and skin had > 90% one-year relative survival. STS
of the viscera had a five-year relative survival similar to
lung cancer (lung cancer 20%, STS of the viscera 17%),
while STS of the breast had a five-year survival almost
equal to female breast cancer (~ 91% for both). Relative
survival for STS and bone sarcoma stratified by broad
age group are provided in Additional file 3.
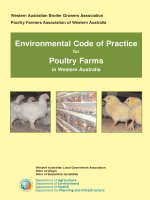
Health service use
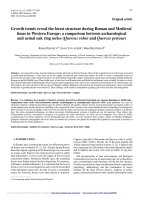
Cancer-related hospital episodes and costs over the
period 1998 to 2016 for sarcoma are shown in Fig. 3.
Corresponding figures for the reference cancers are provided in Additional file 4. Over this period there were
Wright et al. BMC Cancer
(2020) 20:625
Page 5 of 11
Table 1 Descriptive statistics for sarcoma in Western Australia, 1982–2016
1982–87
1988–93
1994–99
2000–05
2006–11
2012–16
304
365
450
539
632
734
Male (%)
140 (46.1)
185 (50.7)
245 (54.4)
280 (51.9)
337 (53.3)
395 (53.8)
Female (%)
164 (53.9)
180 (49.3)
205 (45.6)
259 (48.1)
295 (46.7)
339 (46.2)
p-valuea All
Soft tissue sarcoma
Number
3024
Sex
0.226
1582 (52.3)
1442 (47.7)
Diagnostic age group
0–14 years (%)
18 (5.9)
17 (4.7)
23 (5.1)
19 (3.5)
32 (5.1)
23 (3.1)
15–24 years (%)
18 (5.9)
25 (6.8)
27 (6)
25 (4.6)
27 (4.3)
24 (3.3)
25–64 years (%)
179 (58.9)
191 (52.3)
225 (50)
310 (57.5)
346 (54.7)
400 (54.5)
1651 (54.6)
≥ 65 years (%)
89 (29.3)
132 (36.2)
175 (38.9)
185 (34.3)
227 (35.9)
287 (39.1)
1095 (36.2)
54 (39–68)
57 (37–73)
59 (42–72) 56 (42–71)
58 (43–72)
61 (47–74)
< 0.001
58 (42–72)
246 (67.4)
298 (66.2)
289 (53.6)
291 (46)
196 (26.7)
< 0.001
1546 (51.1)
77
96
97
94
122
109
Male (%)
46 (59.7)
57 (59.4)
48 (49.5)
52 (55.3)
70 (57.4)
68 (62.4)
Female (%)
31 (40.3)
39 (40.6)
49 (50.5)
42 (44.7)
52 (42.6)
41 (37.6)
Median age (IQR)
Death on or prior to censor date (%) 226 (74.3)
0.030
132 (4.4)
146 (4.8)
Bone sarcoma
Number
595
Sex
0.538
341 (57.3)
254 (42.7)
Diagnostic age group
0–14 years (%)
18 (23.4)
11 (11.5)
17 (17.5)
15 (16)
20 (16.4)
11 (10.1)
15–24 years (%)
15 (19.5)
23 (24)
14 (14.4)
15 (16)
19 (15.6)
27 (24.8)
113 (19)
25–64 years (%)
34 (44.2)
49 (51)
46 (47.4)
43 (45.7)
59 (48.4)
45 (41.3)
276 (46.4)
≥ 65 years (%)
10 (13)
13 (13.5)
20 (20.6)
21 (22.3)
24 (19.7)
26 (23.9)
114 (19.2)
29 (16–55)
33.5 (20–55.5) 40 (19–59) 43.5 (19–61)
40.5 (20–63) 42 (19–64)
52 (54.2)
53 (56.4)
39 (32)
28 (25.7)
Median age (IQR)
Death on or prior to censor date (%) 44 (57.1)
48 (49.5)
0.252
0.191
< 0.001
92 (15.5)
38 (18–61)
264 (44.4)
Gastrointestinal stromal sarcomab
Number
0
35
60
67
61
Male (%)
0
18 (51.4)
26 (43.3)
37 (55.2)
38 (62.3)
Female (%)
0
17 (48.6)
34 (56.7)
30 (44.8)
23 (37.7)
0–14 years (%)
0
0
0
0
0
0
15–24 years (%)
0
0
31 (52.7)
25–64 years (%)
0
20 (57.1)
223
Sex
0.162
119 (53.4)
104 (46.6)
Diagnostic age group
≥65 years (%)
0
15 (42.9)
Median age (IQR)
–
56.5 (54–59)
Death on or prior to censor date (%)
29 (48.3)
0
26 (42.6)
30 (44.8)
35 (57.4)
65 (50–75)
68 (52–74)
37 (61.7)
36 (53.7)
< 10
24
34
64 (45–78) 64 (53.5–74.5)
26 (74.3)
0
37 (55.2)
0.510
0
114 (51.1)
109 (48.9)
0.931
< 0.001
65 (52–75)
107 (48)
Kaposi’s sarcomab
Number
14
44
31
147
Sex
Male (%)
11 (78.6)
39 (88.6)
26 (83.9)
20 (83.3)
24 (70.6)
Female (%)
3 (21.4)
5 (11.4)
5 (16.1)
4 (16.7)
10 (29.4)
0
0
0
0
0 (0)
0.303
120 (81.6)
27 (18.4)
Diagnostic age group
0–14 years (%)
0.001
0
Wright et al. BMC Cancer
(2020) 20:625
Page 6 of 11
Table 1 Descriptive statistics for sarcoma in Western Australia, 1982–2016 (Continued)
1982–87
1988–93
15–24 years (%)
< 10
< 10
25–64 years (%)
< 10
34 (77.3)
< 10
< 10
11 (35.5)
14 (58.3)
≥65 years (%)
Median age (IQR)
58.5 (30–72) 39 (34–60.5)
1994–99
2000–05
2006–11
0
0
13 (38.2)
20 (64.5)
10 (41.7)
p-valuea All
87 (59.1)
21 (61.8)
48 (36–71) 72.5 (52.5–82.5) 75 (62–83)
Death on or prior to censor date (%) 12 (85.7)
40 (90.9)
23 (74.2)
14 (58.3)
10 (29.4)
Total
507
611
717
840
395
2012–16
60 (40.8)
63 (50–71)
< 0.001
56 (38–75)
< 0.001
99 (67.3)
919
3989
IQR interquartile range
a
Chi-squared or Fisher’s exact test for categorical variables and Kruskal Wallis test for continuous variables
b
Less than ten cases denoted as < 10 to protect confidentiality, with some percentage values omitted, sub-periods and/or age groups combined to
prevent calculation
18,585 episodes among the cohort with sarcoma, (0.69
episodes per prevalent person) and a total cost of $29.1
million ($3.3 million in 2016). In 1998 the mean cancerrelated episodes per prevalent person was 0.54; for 2016
this was 0.76. The associated mean cost per prevalent
person increased from $675 to $1728 per prevalent person at risk between 1998 and 2016. The mean cancerrelated hospital episodes per prevalent person in 2016
was lower for sarcoma (0.76) than for breast (0.93), colorectal (1.10) and lung cancers (3.23), but higher than for
prostate cancer (0.47). Interestingly, the mean cost per
prevalent person was the second highest for sarcoma in
2016 ($1728); the reference cancers ranged from $805
(female breast cancer) to $5180 (lung cancer).
Discussion
To our knowledge, this is the first study of sarcoma epidemiology and health service utilisation in WA, showing
an increase in STS from 1982 to 2016. At June 2016, we
estimate there were 1935 prevalent cases, with nearly
half diagnosed more than 10 years previous.
The definition for sarcoma used in this study was the
latest published by RARECARENet [13]. This is a project
which collated data from 94 European cancer registries
from 27 countries up to 2007. Estimates of age-adjusted
incidence are reported for cases diagnosed from 2003 to
2007 (most closely corresponding to the 2000 to 2005
period in this study) [15]. The age-adjusted European incidence of STS was 4.15 per 100,000, lower than 5.9 per
100,000 in WA from 2000 to 2005. The magnitude was
also above the (United States (U.S.) standardised) rate of
5.03 per 100,000 reported by Toro et al. [24] using U.S.
SEER data from 1978 to 2001. STS of the skin had an incidence in 2000–2005 of 1.3 per 100,000, much higher than
0.30 per 100,000 reported in Europe [15]. The European
incidence of bone sarcoma was likewise slightly lower,
0.80 per 100,000 (95% CI 0.78–0.82) compared to 0.9 per
100,000 in WA. The incidence of GIST in WA was markedly higher at 0.7 per 100,000 in WA compared to 0.26
per 100,000 in Europe. The five-year relative survival for
STS was higher at 65% than the 57% reported for Europe
for 2005–07 [20]; likewise bone sarcoma relative survival
was higher (71% compared to 59%, respectively). Because
the European data were for an earlier time period and because the ‘relative’ population differed, the above is an indicative rather than ideal comparison.
Australian data for sarcoma produced by the Australian Institute of Health and Welfare are available
to 2014 [1], but used a slightly different sarcoma
definition (e.g. STS encompasses GIST). The magnitude of incidence is similar (e.g. the age-standardised
incidence rate of STS in 2014 was 6 per 100,000,
compared to 7.2 per 100,000 in WA). A recent study
assessed Australian incidence of STS, standardising
to the 2001 Australian population [6]. Replicating
this for WA data yields an STS incidence for 2000–
2005 of 4.8 per 100,000, compared to 6.2 per 100,
000 for Australia. This may be partly explained by a
different STS definition used by these authors.
Woods et al. [2] in an analysis of sarcoma of the
head and neck in Australia from 1982 to 2009 reported an annual incidence rate of 1.59 per 100,000.
This is greater than the crude incidence for STS of
the head and neck of 0.2 per 100,000 reported for
2012–16 in this study and 0.26 per 100,000 reported
by RARECARENet [15]. There were 108 cases of
STS of the head and neck in WA reported between
1982 and 2009, according to the classification used
in this study. This is much less than 10% (the approximate national proportion of the WA population) of the 3440 cases of skin and STS of the head
and neck reported by Woods et al. [2]. The main
difference appears to be due to inclusion of STS of
the skin and Ewing’s family of tumours in the
Woods et al. [2] paper, whereas the RARECARENet
classification excludes these from STS of the head
and neck and classifies these separately. When considering STS of the skin affecting sites of the face
and neck, the number of cases of head and neck sarcoma in WA between 1982 and 2009 increased to
243, closer to 10% of those reported by Woods et al.
[2] in their analysis of Australian data.
Wright et al. BMC Cancer
(2020) 20:625
Page 7 of 11
Table 2 Mean annual age-standardiseda incidence per 100,000 mid-year population (95% confidence interval)
Type of sarcomab
1982–87
1988–93
1994–99
2000–05
2006–11
2012–16
Cases
Soft tissue sarcoma
5.4 (4.7–6)
5.6 (5–6.2)
6 (5.4–6.6)
5.9 (5.3–6.4)
5.9 (5.5–6.4)
7.2 (6.7–7.8)
3024
Soft tissue sarcoma of head and neck
0.3 (0.1–0.5)
0.2 (0.1–0.3)
0.3 (0.2–0.4)
0.4 (0.3–0.6)
0.2 (0.1–0.3)
0.3 (0.2–0.4)
Soft tissue sarcoma of limbs
1.2 (0.9–1.5)
1.1 (0.8–1.4)
1.3 (1–1.5)
1.2 (1–1.4)
1.7 (1.4–2)
2.3 (2–2.6)
Soft tissue sarcoma of superficial trunk
0.3 (0.1–0.4)
0.4 (0.2–0.6)
0.6 (0.4–0.8)
0.6 (0.4–0.8)
0.5 (0.4–0.7)
0.7 (0.6–0.9)
Soft tissue sarcoma of mediastinum
0.1 (0–0.1)
0 (0–0.1)
0 (0–0.1)
0 (0–0.1)
0 (0–0)
0.1 (0–0.1)
Soft tissue sarcoma of breast
0.4 (0.2–0.5)
0.1 (0–0.1)
0.2 (0.1–0.4)
0.2 (0.1–0.3)
0.2 (0.1–0.3)
0.3 (0.2–0.4)
Soft tissue sarcoma of uterus
0.7 (0.4–1)
0.9 (0.6–1.2)
0.9 (0.6–1.2)
1 (0.7–1.3)
0.8 (0.6–1)
0.9 (0.6–1.1)
Other soft tissue sarcomas of genitourinary tract
0.2 (0.1–0.3)
0.3 (0.2–0.4)
0.2 (0.1–0.3)
0.2 (0.1–0.3)
0.3 (0.2–0.4)
0.1 (0–0.2)
Soft tissue sarcoma of viscera
0.7 (0.5–0.9)
0.7 (0.5–1)
0.5 (0.3–0.7)
0.3 (0.2–0.4)
0.3 (0.2–0.4)
0.4 (0.2–0.5)
Soft tissue sarcoma of paratestis
0.2 (0–0.4)
0.2 (0–0.4)
0.2 (0–0.3)
0.1 (0–0.2)
0.1 (0–0.1)
0.1 (0–0.2)
Soft tissue sarcoma of retroperitoneum and
peritoneum
0.4 (0.2–0.6)
0.5 (0.3–0.7)
0.5 (0.3–0.6)
0.3 (0.1–0.4)
0.4 (0.3–0.5)
0.4 (0.3–0.5)
Soft tissue sarcoma of pelvis
0.2 (0.1–0.4)
0.3 (0.2–0.4)
0.3 (0.1–0.4)
0.2 (0.1–0.3)
0.3 (0.2–0.4)
0.3 (0.2–0.4)
Soft tissue sarcoma of skin
0.9 (0.6–1.2)
1.1 (0.8–1.3)
1.1 (0.9–1.4)
1.3 (1.1–1.6)
1 (0.8–1.1)
1.4 (1.1–1.6)
Soft tissue sarcoma of brain and other parts of the 0.1 (0–0.2)
nervous system
0.2 (0.1–0.2)
0.1 (0–0.2)
0.1 (0.1–0.2)
0.3 (0.2–0.4)
0.2 (0.1–0.3)
Embryonal rhabdomyosarcoma of soft tissue
0.1 (0–0.1)
0 (0–0)
0 (0–0)
0.1 (0–0.1)
0.1 (0–0.1)
0 (0–0)
Ewing’s family tumours of soft tissue
0 (0–0.1)
0 (0–0.1)
0.2 (0.1–0.3)
0.2 (0.1–0.3)
0.1 (0.1–0.2)
0.2 (0.1–0.2)
0.9 (0.7–1.2)
1.1 (0.9–1.3)
1 (0.8–1.3)
0.9 (0.7–1.1)
1 (0.8–1.2)
1 (0.8–1.1)
Osteogenic sarcoma
0.3 (0.2–0.5)
0.3 (0.2–0.4)
0.3 (0.2–0.4)
0.3 (0.2–0.3)
0.2 (0.1–0.3)
0.3 (0.2–0.4)
Chondrogenic sarcoma
0.2 (0.1–0.4)
0.4 (0.2–0.5)
0.3 (0.2–0.4)
0.2 (0.1–0.3)
0.3 (0.2–0.5)
0.2 (0.1–0.3)
Notochordal sarcomas, chordoma
0.1 (0–0.2)
0.1 (0–0.2)
0.1 (0–0.2)
0.1 (0–0.2)
0 (0–0)
0.1 (0–0.1)
Ewing’s family of tumours
0.1 (0.1–0.2)
0.1 (0.1–0.2)
0.1 (0–0.2)
0.1 (0.1–0.2)
0.1 (0–0.2)
0.1 (0.1–0.2)
Other high grade sarcomas (fibrosarcoma,
malignant fibrous histiocytoma)
0.1 (0–0.2)
0.1 (0–0.1)
0 (0–0.1)
0 (0–0)
0 (0–0.1)
0 (0–0.1)
Gastrointestinal stromal sarcoma
0 (0–0)
0 (0–0.1)
0.5 (0.3–0.7)
0.7 (0.5–0.9)
0.7 (0.5–0.8)
0.6 (0.5–0.8)
223
Kaposi’s sarcoma
0.3 (0.1–0.4)
0.6 (0.4–0.7)
0.4 (0.2–0.5)
0.3 (0.2–0.4)
0.2 (0.1–0.3)
0.1 (0.1–0.2)
147
Sarcoma (total)
7.9 (7.2–8.5)
7.8 (7.2–8.4)
7.8 (7.2–8.3)
9 (8.4–9.6)
3989
Bone sarcoma
595
6.6 (5.9–7.3)
7.3 (6.6–8)
Female breast cancer
115.2 (111–
119.4)
130.3 (126.3– 144.6 (140.7– 146.1 (142.5– 146.3 (143–
134.4)
148.5)
149.6)
149.5)
162.4 (158.9– 35,
165.9)
932
Colorectal cancer
84.6 (81.7–
87.4)
85.4 (82.9–
88)
88.4 (86–
90.8)
88.3 (86.1–
90.4)
84.4 (82.4–
86.3)
71.9 (70.1–
73.6)
34,
846
Lung Cancer
75.2 (72.5–
77.8)
70.8 (68.5–
73.1)
69.5 (67.4–
71.6)
68.2 (66.3–
70.2)
66.2 (64.5–
67.9)
63.4 (61.7–
65.1)
27,
857
Prostate cancer
130.9 (124.6– 182.3 (176–
137.2)
188.7)
224.8 (218.9– 214.2 (209.1– 264.3 (259.3– 227.6 (223–
230.7)
219.3)
269.2)
232.1)
40,
802
a
Standardised to the 2013 European Standard Population. Note that tier 2 entities do not sum to tier 1 totals
Soft tissue sarcomas of the heart, paraorbit, alveolar rhabdomyosarcoma, vascular sarcoma and epithelial tumours, adamantinoma all had incidence of zero (to 1
decimal place) throughout and have thus been omitted from the list of sarcoma types
b
Bessen et al. [6] also report a similar trend of increasing incidence of STS in Australia between 1982 and
2009, consistent with increases in Europe [15] and the
U.S. [24]. The proportionate increase in people aged
≥65 years is consistent with accumulated mutations leading to STS development. Increased vigilance among clinicians, through dissemination of primary care-targeted
education material (e.g. [25]) and more clearly defined
management guidelines (e.g. [26]) may also have led to
more accurate diagnosis of STS over time. Centralised
sarcoma management, as occurs through the State Sarcoma Service in WA, could also assist in diagnosis by
creating clear referral pathways.
The definition of sarcoma varied in recent studies
from China and Germany [27, 28]. Using the RARECARENet definition, this study reported 3989 sarcoma
cases. Had the definition by Pingping et al. [27] been
used; 4036 cases would have been reported, whereas a
Wright et al. BMC Cancer
(2020) 20:625
Page 8 of 11
Fig. 1 Mean annual crude incidence per 100,000 of sarcoma and major sarcoma groups, by age group and sex for 2012–16
broader definition applied by Ressing et al. [28] would
have led to 4671 cases being reported in WA. Ressing
et al. [28] reported some uncertainty over the inclusion
of some morphology codes (e.g. Mullerian mixed
tumour), with around 5% removed in these authors'
sensitivity analysis. The advantages of using the RARECARENet definition of sarcoma (plus Kaposi sarcoma) is
to facilitate comparison of data from WA with those in
a different setting. This along with comparison with the
four reference cancers contextualises the findings. In
Fig. 2 One and five-year relative survival for those ‘at risk’ from 2012 to 16, by cancer type* *Errors bars are 95% confidence intervals
Wright et al. BMC Cancer
(2020) 20:625
Page 9 of 11
Fig. 3 Total episodes of cancer-related hospitalisation (a), rate per prevalent person (b), total cost (2019) Australian dollars, c, and cost per
prevalent person (d)*. *All based on corrected prevalence, described in methods
Australia, the Australian Comprehensive Cancer Outcomes and Research Database (ACCORD) is a resource
currently being utilised for sarcoma epidemiological research [29]. An extension to this study would be to compare ACCORD estimates with those in the WACR.
Having access to health service utilisation information
provides an additional lens to this epidemiological analysis. Cancer-related hospitalisation related to cancer
generally, rather than sarcoma specifically. Anecdotal
feedback from the State Sarcoma Service indicated that
many referrals and effort in management are directed towards benign or borderline lesions, as even if without
metastatic potential these can be locally aggressive and
difficult to manage. While those included on the WACR
have been mentioned in the results as specific exclusions, sarcoma is by definition a malignant disease and
thus is would be inappropriate to include these lesions
in the analysis. Finally, the prevalence analysis cannot
account for inward and outward inter-state or international migration post-diagnosis.
Conclusions
Because sarcoma is a rare cancer, understanding epidemiological trends and health resource utilisation is important to planning centralised management of patients
through a multi-disciplinary team with sarcoma expertise. This study adds to a relatively small pool of literature
analysing sarcoma epidemiology, especially in Australia.
STS incidence has increased over time in WA, with an
increasing proportion of people diagnosed aged ≥65
years. Bone sarcoma remains rare, but younger people
make up a higher proportion of the total case load, compared to other forms of sarcoma. Management can have
long-term quality of life implications (e.g. if limb amputation is indicated) and for a proportion of people the survival outcome is poor. The analysis of health service use
showed sarcoma had a lower mean episode per prevalent
person of cancer-related hospitalisation compared to the
reference cancers in 2016, but the mean cost per prevalent person was higher for sarcoma than for female
breast, colorectal and prostate cancer.
Supplementary information
Supplementary information accompanies this paper at />1186/s12885-020-07103-w.
Additional file 1. Sarcoma topographical and morphological codes and
codes for cancer-related hospitalisations.
Additional file 2. Corrected prevalence by year, 1982 to 2016.
Additional file 3. One- and five-year relative survival for soft tissue sarcoma and bone sarcoma, stratified by age group.
Additional file 4. Total episodes of cancer-related hospitalisation (a),
rate per prevalent person (b), total associated cost (2019) Australian dollars, c, and cost per prevalent person based on corrected prevalence (d).
Abbreviations
ABS: Australian Bureau of Statistics; GIST: Gastrointestinal stromal tumour;
HMDC: Hospital morbidity data collection; ICD: International Classification of
Wright et al. BMC Cancer
(2020) 20:625
Page 10 of 11
Disease; RARECARENet: Information Network on Rare Cancers;
RECORD: Reporting of studies Conducted using Observational Routinelycollected health Data; STS: Soft tissue sarcoma; U.S: United States;
WA: Western Australia; WACR: WA Cancer Registry
7.
Acknowledgements
The authors would like to thank the people of Western Australia, whose data
have been analysed and the Western Australian Data Linkage Branch,
Department of Health and data custodians, for providing linked data for this
project. Thank you also to Dr. Peter Robbins, pathologist at PathWest for his
helpful comments on the draft of this manuscript.
8.
Authors’ contributions
CW, RM and GH designed the study, CW analysed the data and wrote the
draft of the manuscript, CW, RM, GH and RCS critically reviewed the
manuscript for important intellectual content. All authors read and approved
the final manuscript.
Funding
Data acquisition for this study was funded by the Abbie Basson Sarcoma
Foundation (Sock it to Sarcoma!), though the funder had no role in the
study design or decision to submit for publication. A/Prof Georgia Halkett is
currently supported by a Cancer Council of WA Research Fellowship.
Availability of data and materials
The datasets generated and/or analysed during the current study are not
publicly available due to an ethics and research governance process being in
place to obtain the data used.
9.
10.
11.
12.
13.
14.
Ethics approval and consent to participate
The study was approved by the WA Department of Health Human Research
Ethics Committee (2012/42), which exempted the study from obtaining
individual patient consent.
15.
16.
Consent for publication
Not applicable, as per statement above.
17.
Competing interests
The authors declare that they have no competing interests.
18.
Author details
1
Health Economics and Data Analytics, School of Public Health, Faculty of
Health Sciences, Curtin University, GPO Box U1987, Perth, Western Australia
6845, Australia. 2School of Medicine, College of Health & Medicine, University
of Tasmania, Churchill Avenue, Hobart, Tasmania 7005, Australia. 3School of
Nursing, Midwifery and Paramedicine, Faculty of Health Sciences, Curtin
University, Perth, Western Australia 6102, Australia. 4Department of
Orthopaedic Surgery, Sir Charles Gardner Hospital, Hospital Ave, Nedlands,
Western Australia 6009, Australia. 5Centre for Health Services Research,
School of Population and Global Health, Faculty of Medicine, Dentistry and
Health Sciences, University of Western Australia, 35 Stirling Highway, Crawley,
Western Australia 6009, Australia.
19.
20.
21.
22.
Received: 10 March 2020 Accepted: 23 June 2020
23.
References
1. Cancer Australia. Sarcoma statistics Canberra. 2018. https://sarcoma.
canceraustralia.gov.au/statistics. Accessed 22 Jul 2019.
2. Woods RH, Potter JA, Reid JL, Louise J, Bessen T, Farshid G, et al.
Patterns of head and neck sarcoma in Australia. ANZ J Surg. 2018;88(9):
901–6.
3. Youlden DR, Aitken JF. Childhood cancer in Australia, 1983–2015. Brisbane:
Cancer Council Queensland; 2019.
4. Blackwell JB, Threlfall TJ, McCaul KA. Primary malignant bone tumours in
Western Australia, 1972-1996. Pathology. 2005;37(4):278–83.
5. Gibson E, Woods RH, Potter JA, et al. Epidemiological trends in dermal
sarcoma in Australia. Australas J Plast Surg. 2019;2(2):10–6.
6. Bessen T, Caughey GE, Shakib S, Potter JA, Reid J, Farshid G, et al. A
population-based study of soft tissue sarcoma incidence and survival in
Australia: an analysis of 26,970 cases. Cancer Epidemiol. 2019;63:101590.
24.
25.
26.
27.
Australian Government: Department of Health. Clinical Trial
Activity: Rare Cancers and Rare Diseases and Unmet Needs. 2019.
Accessed
24 Sept 2019.
Benchimol EI, Smeeth L, Guttmann A, Harron K, Moher D, Petersen I,
et al. The REporting of studies conducted using observational routinelycollected health data (RECORD) statement. PLoS Med. 2015;12(10):
e1001885.
Holman CD, Bass AJ, Rouse IL, Hobbs MS. Population-based linkage
of health records in Western Australia: development of a health
services research linked database. Aust N Z J Public Health. 1999;
23(5):453–9.
Australian Bureau of Statistics. 3101.0. Australian Demographic
Statistics, Sep 2018. Table 4. Estimated Resident Population, States
and Territories (Number). 2018. />abs@.nsf/DetailsPage/3101.0Sep%202018?OpenDocument. Accessed 24
Apr 2019.
International Association of Cancer Registries. International rules for multiple
primary cancers. 2004. />pdf. Accessed 3 Feb 2020.
Australian Institute of Health and Welfare. Cancer survival and prevalence in
Australia: period estimates from 1982 to 2010. Cancer Series no. 69. Cat. no.
CAN 65. Canberra, Australian Capital Territory: Australian Institute of Health
and Welfare; 2012.
Information Network on Rare Cancers. List of rare cancers. 2015. http://
www.rarecarenet.eu/rarecarenet/index.php/cancerlist. Accessed 27 Aug
2019.
Gatta G, Capocaccia R, Botta L, et al. Burden and centralised treatment in
Europe of rare tumours: results of RARECAREnet-a population-based study.
Lancet Oncol. 2017;18(8):1022–39.
Information Network on Rare Cancers. Age-adjusted incidence over time in
Europe. 2020. Accessed 6 Feb 2020.
Maxwell S, O'Leary P, Slevin T, et al. The increase in cancer prevalence and
hospital burden in Western Australia, 1992-2011. Popul Health Metrics. 2014;
12(1):33.
Ederer FH, H. Methodological note no. 10, end results evaluation section.
Instructions to IBM 650 programmers in processing survival computations.
Bethesda: National Cancer Institute; 1959.
Brenner H, Soderman B, Hakulinen T. Use of period analysis for
providing more up-to-date estimates of long-term survival rates:
empirical evaluation among 370,000 cancer patients in Finland. Int J
Epidemiol. 2002;31(2):456–62.
Baade P, Cramb S, Dasgupta P, Youlden D. Estimating cancer survival improving accuracy and relevance. Aust N Z J Public Health. 2016;40(5):
403–4.
Information Network on Rare Cancers. 1, 3 and 5-year Relative Survival (RS)
overtime in Europe. 2020. Accessed
6 Feb 2020.
Australian Bureau of Statistics. Deaths, Year of registration, Age at death,
Age-specific death rates, Sex, States, Territories and Australia. 2016. https://
www.abs.gov.au/?QueryId=1324#. Accessed 3 Feb 2020.
Independent Hospitals Pricing Authority. National Efficient Price
Determination. 2020. Accessed 24 Apr 2020.
Australian Bureau of Statistics. Tables 1 and 2. CPI: All Groups, Index
Numbers and Percentage Changes. 2019. />AUSSTATS/abs@.nsf/DetailsPage/6401.0Mar%202019?OpenDocument.
Accessed 13 Sept 2019.
Toro JR, Travis LB, Wu HJ, Zhu K, Fletcher CD, Devesa SS. Incidence patterns
of soft tissue sarcomas, regardless of primary site, in the surveillance,
epidemiology and end results program, 1978-2001: an analysis of 26,758
cases. Int J Cancer. 2006;119(12):2922–30.
Pike J, Clarkson PW, Masri BA. Soft tissue sarcomas of the extremities: how
to stay out of trouble. B C Med. 2008;50(6):310–8.
Dangoor A, Seddon B, Gerrand C, Grimer R, Whelan J, Judson I. UK
guidelines for the management of soft tissue sarcomas. Clin Sarcoma Res.
2016;6:20.
Pingping B, Yuhong Z, Weiqi L, Chunxiao W, Chunfang W, Yuanjue S, et al.
Incidence and mortality of sarcomas in Shanghai, China, during 2002-2014.
Front Oncol. 2019;9:662.
Wright et al. BMC Cancer
(2020) 20:625
28. Ressing M, Wardelmann E, Hohenberger P, Jakob J, Kasper B, Emrich K, et al.
Strengthening health data on a rare and heterogeneous disease: sarcoma
incidence and histological subtypes in Germany. BMC Public Health. 2018;
18(1):235.
29. Australian and New Zealand Sarcoma Association. Clinical Trials and Studies:
Advanced Soft Tissue Sarcoma Study. 2020. />projects. Accessed 19 Feb 2020.
Publisher’s Note
Springer Nature remains neutral with regard to jurisdictional claims in
published maps and institutional affiliations.
Page 11 of 11