Intracellular expression of arginine deiminase activates the mitochondrial apoptosis pathway by inhibiting cytosolic ferritin and inducing chromatin autophagy
Bạn đang xem bản rút gọn của tài liệu. Xem và tải ngay bản đầy đủ của tài liệu tại đây (4.79 MB, 13 trang )
Feng et al. BMC Cancer
(2020) 20:665
/>
RESEARCH ARTICLE
Open Access
Intracellular expression of arginine
deiminase activates the mitochondrial
apoptosis pathway by inhibiting cytosolic
ferritin and inducing chromatin autophagy
Qingyuan Feng2†, Xuzhao Bian1†, Xuan Liu1†, Ying Wang1, Huiting Zhou1, Xiaojing Ma1, Chunju Quan1, Yi Yao3 and
Zhongliang Zheng1*
Abstract
Background: Based on its low toxicity, arginine starvation therapy has the potential to cure malignant tumors that
cannot be treated surgically. The Arginine deiminase (ADI) gene has been identified to be an ideal cancersuppressor gene. ADI expressed in the cytosol displays higher oncolytic efficiency than ADI-PEG20 (Pegylated
Arginine Deiminase by PEG 20,000). However, it is still unknown whether cytosolic ADI has the same mechanism of
action as ADI-PEG20 or other underlying cellular mechanisms.
Methods: The interactions of ADI with other protein factors were screened by yeast hybrids, and verified by coimmunoprecipitation and immunofluorescent staining. The effect of ADI inhibiting the ferritin light-chain domain
(FTL) in mitochondrial damage was evaluated by site-directed mutation and flow cytometry. Control of the
mitochondrial apoptosis pathway was analyzed by Western Blotting and real-time PCR experiments. The effect of
p53 expression on cancer cells death was assessed by siTP53 transfection. Chromatin autophagy was explored by
immunofluorescent staining and Western Blotting.
Results: ADI expressed in the cytosol inhibited the activity of cytosolic ferritin by interacting with FTL. The inactive
mutant of ADI still induced apoptosis in certain cell lines of ASS- through mitochondrial damage. Arginine
starvation also generated an increase in the expression of p53 and p53AIP1, which aggravated the cellular
mitochondrial damage. Chromatin autophagy appeared at a later stage of arginine starvation. DNA damage
occurred along with the entire arginine starvation process. Histone 3 (H3) was found in autophagosomes, which
implies that cancer cells attempted to utilize the arginine present in histones to survive during arginine starvation.
Conclusions: Mitochondrial damage is the major mechanism of cell death induced by cytosolic ADI. The process of
chromatophagy does not only stimulate cancer cells to utilize histone arginine but also speeds up cancer cell death
at a later stage of arginine starvation.
Keywords: Arginine deprivation, Arginine deiminase, Apoptosis, Mitochondrial damage, Chromatin autophagy
* Correspondence:
†
Qingyuan Feng, Xuzhao Bian and Xuan Liu contributed equally to this work.
1
State Key Laboratory of Virology, College of Life Sciences, Wuhan University,
Wuhan 430072, China
Full list of author information is available at the end of the article
© The Author(s). 2020 Open Access This article is licensed under a Creative Commons Attribution 4.0 International License,
which permits use, sharing, adaptation, distribution and reproduction in any medium or format, as long as you give
appropriate credit to the original author(s) and the source, provide a link to the Creative Commons licence, and indicate if
changes were made. The images or other third party material in this article are included in the article's Creative Commons
licence, unless indicated otherwise in a credit line to the material. If material is not included in the article's Creative Commons
licence and your intended use is not permitted by statutory regulation or exceeds the permitted use, you will need to obtain
permission directly from the copyright holder. To view a copy of this licence, visit />The Creative Commons Public Domain Dedication waiver ( applies to the
data made available in this article, unless otherwise stated in a credit line to the data.
Feng et al. BMC Cancer
(2020) 20:665
Background
Tumor starvation therapy has become a mainstream
strategy for cancer therapy in clinic. In addition to
starvation therapy through inhibition of angiogenesis [1],
the deprivation of specific amino acids is also a potential
cancer therapy. As a potential anti-cancer drug, ADIPEG20 has already demonstrated some promising results
in Phase I and II clinical studies [2, 3]. ADI-PEG20
exhausts the serum arginine thus starving some specific
tumors. Those tumors are unable to synthesize arginine
due to a deficiency of the enzyme argininosuccinate
synthetase (ASS) [4]. David K. Ann and Hsing-Jien Kung
[5, 6] et al. described the mechanism through which
ADI-PEG20 leads to arginine deprivation in vitro to specifically kill tumor cells, which is actually a novel mechanism involving mitochondrial dysfunction, generation
of reactive oxygen species, nuclear DNA leakage, and
chromatin autophagy. DNA damage caused by chromatin
autophagy triggered the death of cancer cells. However,
ADI-PEG20 displayed a lower efficiency in oncolysis.
Arginine deprivation in blood only persisted for 2 weeks in
an ASS1-methylated malignant pleural mesothelioma [7].
Subsequently, plasma arginine levels recovered due to the
development of anti-ADI neutralizing antibodies during the
fourth week [7]. ADI-PEG20 monotherapy did not exhibit
an overall survival benefit for hepatocellular carcinoma
(HCC) patients in Phase III clinical studies [8]. Therefore,
new strategies are needed to synergize the effect of ADIPEG20 in vivo or transform the application methods of the
ADI gene in clinical practice.
The ADI gene is a potential cancer suppressor gene [9].
ADI expressed in cytosol displayed a higher apoptosisinducing efficiency than ADI-PEG20. Cytosolic ADI
quickly eliminated cytosolic arginine in the cytoplasm [9]
to cause rapid cancer cell death. ADI adenovirus also
presented an excellent oncolytic efficiency [9]. Moreover,
the promoter of human telomerase reverse transcriptase
(hTERT) was utilized to control ADI expression in adenovirus, which ensured higher safety levels for normal cells
[9]. Nonetheless, the underlying interaction mechanisms
of ADI expressed in the cytosol, or the cellular response
to rapid endogenous arginine deprivation are yet to be
completely understood. The solution to these issues would
effectively prevent side effects when the ADI gene is used
for cancer gene therapy in the future.
Here, we aimed to exploit intracellular components
that may interact with ADI and figure out whether these
interactions are lethal. We sought to identify the
molecular determinants of cancer cell death induced by
cytosolic ADI, which could serve as a guide for application of the ADI gene in clinic and highlight the choice
of agents to be used in combination therapy. We found
out that cytosolic ADI interacted with FTL in the
cytoplasm and we also detected minor mitochondrial
Page 2 of 13
damage. Notwithstanding, arginine deprivation activated
the apoptosis pathway of mitochondria control. The
increased expression of p53 and p53AIP1 led to mitochondrial damage at the early stage of arginine
deprivation. At the later stages of arginine deprivation,
chromatin autophagy became worse, which in turn aggravated the mitochondrial damage. Thus, we defined the
mechanism underlying the sensitivity of mitochondrial
damage to cytosolic ADI and then identified the role of
autophagy during arginine deprivation.
Methods
Plasmid construction
To construct the pcDNA4-ADI, which is an ADIoverexpressing plasmid, an ADI coding sequence was
synthesized using the Nanjing Genscript LTD and then subcloned into the EcoR I/Xho I sites of a pcDNA™4/TO/mycHis vector. The c-myc tag was fused at the c-terminal of the
ADI protein. Two primers were used (5′- GATATGAATT
CACCATGTCCGTCTTCGAT AGCAAGT − 3′ and 5′GATATCTCGAG TCACCATTT GACATCTTTTCTGG
ACA − 3′). The pcDNA4-ADI△(cysteine398alanine) plasmid
was created through an overlapping extension method. Two
mutant primers were used (5′ GTATGGGTAACG CTCG
TGCCATGTCAATGCCTTTATC 3′ and 5′ GATAAAGG
CATTGACATGG CACGAGCGTTACCCATAC 3′).
In order to build the pGBKT7-ADI plasmid serving
as screening bait through a yeast hybrid experiment,
an ADI coding sequence was inserted into the Nde I/
BamH I sites of a pGBKT7 vector which expresses
proteins fused to amino acids 1–147 of the GAL4
DNA binding domain. Two primers were used (5′GATATCATATGTCCGTCTTCGATAGCAAG TT −
3′ and 5′- GATATCTCGAGTCACCATTT GACATC
TTTTCTGGACA − 3′).
Other plasmids were donated by Dr. Youjun Li from
the College of Life Sciences at Wuhan University.
Cell culture and cell lines
Human liver cancer cell lines (HepG2), Prostate cancer
cell lines (PC3), and human embryo lung cell lines
(MRC5) were cultured with DMEM supplemented with
10% fetal bovine serum (FBS), penicillin (100 IU/ml) and
streptomycin (100 μg/ml). Cells were then grown in a
5% CO2 cell culture incubator at 37 °C. All the culture
reagents were purchased from Life Technologies LTD.
Three cell lines including HepG2 (Cat. #GDC141), PC3
(Cat. #GDC095) and MRC5 (Cat. #GDC032) were
purchased from China Center for Type Culture Collection (CCTCC) in July 2017. No mycoplasma contamination was detected in these cells. STR genotypes of three
cell lines were tested again in August 2019. The proofs
of purchase and the test reports were described in
Supplementary information 2.
Feng et al. BMC Cancer
(2020) 20:665
Yeast two-hybrid assay
A yeast two-hybrid analysis was performed in yeast
strain AH109 according to the manufacturer’s instructions ( The pGBKT7-ADI
plasmid, used as bait plasmid was co-transformed into
the AH109 yeast strain with the yeast two-hybrid cDNA
library of the human liver (Cat. #630468) from Clontech
Laboratories Inc. A quadruple dropout medium (without
tryptophan, leucine, histidine, and adenine) containing 4
mg/ml x-a-gal was used to test the activation of reported
genes MEL1 (MDS1/EVI1-like gene 1).
Page 3 of 13
Fluorescence assay for mitochondrial permeability
transition pore (MPTP)
MPTP activation assay followed the manuscript of LIVE
Mitochondrial Transition Pore Assay Kit (GMS10095.1
v.A) from GENMED SCIENTIFICS INC. U.S.A. The
cells were inoculated in 96-well plates at a density of 5 ×
104 cells per well and transfected with the pcDNA4-ADI
plasmid. After incubation for 48 h, the cells were then
stained with 50 μg calcein-AM (Calcein acetoxymethyl
ester), washed with a 0.1 M phosphate buffer solution
(PBS), and neutralized with a 0.1 M cobalt (II) chloride
hexahydrate. Finally, the cells’ fluorescence intensity was
detected in a Thermo Multiskan™ FC Microplate Reader.
RNA isolation and quantitative RT-PCR
Total RNA was extracted from the cells using Trizol (Invitrogen) following the manufacturer’s instructions. RNA
concentration and purity were both determined by spectrophotometry (NanoDrop Technologies Inc., LLC). One
microgram of total RNA was utilized as template for synthesizing complementary DNA strands (cDNA) by using
the cDNA Synthesis Kit (Thermo Scientific). Quantitative
RT-PCR (qRT-PCR) was performed by using SYBR Green
PCR Master Mix with the StepOne Real-Time PCR System (Bio-Rad). 2-△△Ct in the relative quantification analysis
method was used to calculate the change fold of mRNA
among the different cells. GAPDH was implemented as an
internal control for normalization. The primers used for
RT-PCR were listed in supplementary Tab S1.
GFP-LC3 reporter fluorescence assay for autophagy in live
cells
Expression of the GFP-LC3 fusion gene allows for real-time
visualization of autophagosome formation in live cells.
Firstly, the cells were inoculated in twelve-well plates with
coverslips at a density of 1 × 10⁵ cells per well, and cotransfected with pcDNA4-ADI and pEGFP-LC3 plasmids.
Secondly, the cells were starved with in a serum-free
medium for 72 h. Thirdly, the cells were fixed with 4%
paraformaldehyde, and permeabilized with 0.2% Triton X100. Cellular nuclei were stained by DAPI for 10 min.
Finally, the plates were sealed and stored at 4 °C. GFP
fluorescent signals were observed by using a confocal
microscope (Leica microsystems, Mannheim, Germany).
Chromatin autophagy assay by fluorescence co-localization
Western blot analysis
Five micrograms of protein were electrophoresed in 10%
SDS-PAGE gels and blotted to polyvinylidene difluoride
membranes. Specific primary antibodies were detected
with peroxidase-labeled secondary antibodies (ProteinTech Group Inc.) by using SuperSignal West Dura
Extended Duration Substrate (Pierce Chemical) per the
manufacturer’s instructions. The antibodies used from
ProteinTech Group Inc. included the myc-tag antibody
(Cat. #66036–1-Ig), ASS antibody (Cat. #66036–1-Ig),
GAPDH antibody (Cat. #60004–1-Ig), FTL antibody (Cat.
#10727–1-AP), Flag-tag antibody (Cat. # 66008–3-Ig), p53
antibody (Cat. #60283–2-Ig), Bcl-2 antibody (Cat.
#60178–1-Ig), PUMA antibody (Cat. # 55120–1-AP), Bax
antibody (Cat. #60267–1-Ig), caspase 9 antibody (Cat. #
66169–1-Ig), caspase 3 antibody (Cat. # 66470–2-Ig),
Histone H3 antibody (Cat. # 17168–1-AP), HRPconjugated goat anti-mouse IgG (Cat. #SA00001–1) and
HRP-conjugated goat anti-rabbit IgG (Cat. #SA00001–2).
The p53AIP1 antibody (Cat. # ABP56144) was supplied by
Abbkine Inc., while the Noxa antibody (Cat. # ab13654)
and the Bak antibody (Cat. # ab69404) were both from
Abcam Inc. The TRITC conjugated goat anti-rabbit antibody (Cat. # AS10–1018) was from Agrisera Inc.
The cells were inoculated in twelve-well plates with
coverslips at a density of 1 × 10⁵ cells per well, and cotransfected with pcDNA4-ADI and pEGFP-LC3
plasmids. Then, 2% FBS was added into the DMEM
medium to prevent the cells from dying too quickly.
After a culture duration of 96 h, the cells were fixed with
4% paraformaldehyde, and permeated with 0.2% Triton
X-100. Afterwards, the cells were incubated with the
TRITC-labeled anti-H3 antibody for 4 h at 4 °C. After
washing, cellular nuclei were stained by DAPI for 10 min.
Eventually, the plates were sealed and stored at 4 °C. Fluorescent signals were detected using a confocal microscope.
Statistical analysis
Data with error bars are presented as mean ± S.D. The
student’s two-tailed t-test was used to determine the pvalue. Differences were considered statistically significant
when the p-value was < 0.05.
Results
Cancer cells apoptosis induced by ADI expressed in the
cytosol
ADI expressed in the cytosol was able to efficiently
deplete intracellular arginine and lead to cell death.
Feng et al. BMC Cancer
(2020) 20:665
Thus, we transfected the pcDNA4-ADI plasmid into
cancer cells to express ADI and determine the apoptosis
rate. Based on the cancer tissue specificity of ASS gene
expression [4], the MRC5 cell line (ASS+) was used as
the negative control, whereas the PC3 (ASS-) and
HepG2 (ASS-) cell lines were used as research targets.
As indicated by the immunoblotting dots illustrated in
Fig. 1c, Fig. 1d and supplementary Fig. S1, the ASS gene
was silent in HepG2 and PC3 cells, but highly expressed
in MRC5 cells. After 2 days of plasmid transfection, ADI
expressed in cytosol efficiently induced the death of the
PC3 and HepG2 cells. The apoptosis rate was calculated
by summing the rates of early apoptotic cells, late apoptotic cells and dead cells. The PC3 cell line displayed a
cell death rate of nearly 17%. The HepG2 cell line also
exhibited a cell death rate of roughly 15%. However,
ADI demonstrated almost no level of toxicity on normal
cells given that the MRC5 cell line experienced a death
Page 4 of 13
rate of approximately 4%. 200 mg/L of arginine was used
to counteract arginine deprivation induced by cytosolic
ADI. The DMEM medium containing 200 mg/L of
arginine was replaced every 24 h after transfection of the
pcDNA4-ADI plasmid. The high arginine concentration
obviously reduced the death rates caused by cytosolic
ADI. For example, the HepG2 cells and PC3 cells
decreased their death rates to about 7.7 and 8.0%,
respectively.
The interaction between ADI and FTL promoted
mitochondrial damage
To understand whether cytosolic ADI has a unique antitumor mechanism in cancer cells, we screened several
protein factors possibly interacting with ADI by the
yeast hybrid method. A cDNA library of human liver
from Clontech Laboratories Inc., was used as screening
target in the yeast hybrid experiment. As portrayed in
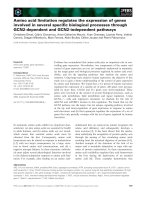
Fig. 1 Apoptosis efficiency induced by ADI expressed in MRC5, HepG2 and PC3 cells. Cells were separately transfected by pcDNA4, pcDNA4-ADI
plasmids. Cell apoptosis rates were detected by flow cytometry after the static cell culture for 48 h. a: Representative images of FACS analysis of
annexin V and PI staining of MRC5, HepG2 and PC3 cells. b: Death ratio summary of FACS analysis from Fig. 1a. c: Immunoblots of ADI and ASS
expression in MRC5, HepG2 and PC3 cells. C-myc-tag antibody was used to detect c-myc-tag-fused ADI. The blot of GAPDH was from the same
gel as the blot of ADI. Full-length blots are presented in Supplementary Fig. S1. d: the relative quantification for protein expressions in MRC5, PC3
and HepG2 cell lines. Grey scales of protein bands from Fig. 1c were detected by ImageJ 1.52. P values were calculated by comparing pcDNA4ADI plasmids-treated cells with pcDNA4 plasmid-treated cells in the respective cell lines. **P < 0.01; ***P < 0.001
Feng et al. BMC Cancer
(2020) 20:665
Fig. 2a, FTL was screened out and made yeasts display
an obvious green color on the selecting plate (SD/Gal/
Raf/−Ura, −His, −Trp, −Leu) by interacting with ADI.
Next, an immunofluorescence staining was applied to
detect intracellular co-localization of ADI and FTL on a
confocal microscope. As delineated in Fig. 2c, FTL was
located in the cytoplasm and labeled with FITC-green
fluorescence. ADI was distributed across the entire cell
and labeled with TRITC-red fluorescence. The cytoplasm was clearly their site of interaction as depicted
from merged pictures. Co-immunoprecipitation (co-IP)
was done to further verify the intracellular interaction
between ADI and FTL in ADI-transfected cells. As
presented in Fig. 2b and supplementary Fig. S2, FTL was
checked out by Western Blotting when ADI was used as
IP bait. ADI was also detected by Western Blotting when
FTL played the role of IP bait.
The enzymatic activity of ADI was withdrawn to
explore whether ADI could inhibit cytoplasmic FTL
through interaction. Considering that the amino acid
residue of cysteine398 is the catalytic residue of ADI
[10], we mutated cysteine398 into alanine398 to remove
the enzymatic activity of ADI. The pcDNA4-ADI△(C398A)
plasmid was transfected into PC3 and HepG2 cells to detect
cell apoptosis. Subsequently, the pCMV-FTL plasmid was
Page 5 of 13
co-transfected to neutralize the action of cytosolic
ADI△. As laid out in Fig. 3a, b, d, and supplementary
Fig. S3, cytosolic ADI△ still led to 13% of PC3 cell
death, and 10% of HepG2 cell death after 3 days of
transfection. However, the over-expressed FTL obviously neutralized the death-induced effects in these
two cell lines. Co-transfection of the pcDNA4ADI(C398△A398) and pCMV-FTL plasmids reduced
the death rate of PC3 cells to about 7% and HepG2
cells to about 3%. MPTP experiments were further
performed to corroborate the mitochondrial damage
caused by the cytosolic ADI△. As shown in Fig. 3c,
the cytosolic ADI△ decreased half of the fluorescence
intensity of the living cells stained by calcein-AM.
The co-transfected cells almost kept the same fluorescence intensity as the control cells. Hence, FTL overexpression in vivo prevented mitochondrial damage
induced by cytosolic ADI.
Mitochondria apoptosis pathway induced by arginine
deprivation in vivo
Mitochondrial apoptosis control pathways were evaluated by fluorescent quantitation RT-PCR and Western
Blot experiments. As illustrated in Fig. 4a, after 2 days of
ADI expression in cells, the mRNA levels of some
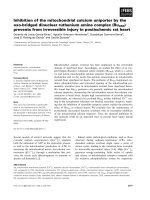
Fig. 2 The interaction of ADI and FTL in vivo. a: Yeast were co-transformed with pBD-ADI and pAD-T-FTL plasmid, and grew on an SD agar plate with
high-stringency nutrient selection (SD/−Leu/−Trp/−His/−Ade). pBD-LamC/pAD-T-antigen plasmids were used as negative control. pBD-p53/pAD-Tantigen plasmids were used as positive control. b: Co-IP of ADI or FTL was applied by antibodies specific for ADI or FTL. Images represent the
immuneprecipitates separated by SDS-PAGE and incubated with the indicated antibodies. The blots of each line were from the same gel. Full-length
blots are presented in Supplementary Fig. S2. c: Immunofluorescence staining of HepG2 and PC3 cells with antibody against ADI (red) and antibody
against FTL (green). Cells were transfected with pcDNA4-ADI plasmid. The fluorescence was detected on an inverted fluorescence microscope
Feng et al. BMC Cancer
(2020) 20:665
Page 6 of 13
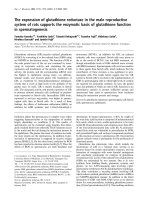
Fig. 3 Apoptosis efficiency induced by ADI△(C398A) expressed in MRC5, HepG2 and PC3 cells. Cells were separately transfected by pcDNA4,
pcDNA4-ADI△ and pCMV-FTL plasmids. Cell apoptosis rates were detected by flow cytometry after the static cell culture for 72 h. a:
Representative images of FACS analysis of annexin V and PI staining of MRC5, HepG2 and PC3 cells. b: Death ratio summary of FACS analysis
from Fig. 3a. c: Fluorescence assay for mitochondrial permeability transition pore (MPTP) from Fig. 3a. d: Immunoblots of ADI△ and ASS
expression in MRC5, HepG2 and PC3 cells. C-myc-tag antibody was used to detect c-myc-tag-fused ADI△. FLAG tag was used to detect
overexpressed FTL. The blot of GAPDH was from the same gel as the blot of FTL. Full-length blots are presented in Supplementary Fig. S3
important factors increased, such as FTL (about 1.5
fold), p53 (about 1.5 fold), p53AIP1 (about 4.5 fold),
Noxa (about 6.0 fold), PUMA (about 1.5 fold), CASP9
(about 3.0 fold) and CASP3 (about 7.0 fold). As shown
in Fig. 4b, e, f, and supplementary Fig. S4, the protein
levels of these factors also rose after 2 days of arginine
deprivation in vivo. Nevertheless, Bax and Bak increased
their protein levels on the fourth day of ADI expression.
As presented in Fig. 4c, mitochondrial damage was
verified by MPTP experiments. The fluorescence intensity of living cells stained by calcein-AM decreased
sharply after 2 days or 4 days of arginine deprivation
in vivo. As depicted in Fig. 4d and e, the activities of
CASP3 and CASP9 simultaneously increased by roughly
1.5 to 2.0 fold.
Furthermore, increased levels of p53AIP1 expression
activated p53-dependent apoptosis [11]. As a result, we
respectively knocked down p53 mRNA and p53AIP1
mRNA to verify their functions in mitochondrial damage
during arginine deprivation in vivo. As observed in Fig. 5d
and e, the protein levels of p53 and p53AIP1 decreased in
the PC3 and HepG2 cell lines after 2 days of arginine
deprivation in vivo and siRNA transfection. Knock-down
of the p53 mRNA level effectively decreased cell death
rates, as displayed by the flow cytometry results in Fig. 5a
and b. siTP53AIP1 also reduced cell death rates in PC3
and HepG2 cells. MPTP experiments yielded the same
results, revealed in Fig. 5c. The fluorescence intensity of
living cells stained by calcein-AM was much higher in
siRNA-treated cells than in scrRNA-treated cells.
Cellular autophagy induced by ADI expressed in the
cytosol
Cellular autophagy was detected because nutrient starvation is the major reason to trigger excessive autophagy
[12]. Assay for microtubule-associated protein 1A/1Blight chain 3 (LC3) is the basic protocol for the detection
of autophagosomes. A cytosolic form of LC3 (LC3-I) is
conjugated to phosphatidylethanolamine to generate an
LC3-phosphatidylethanolamine conjugate (LC3-II) during
autophagy, which is recruited in autophagosomal membranes. Thus, an assay for the formation of GFP-LC3-II
can reliably reflect the starvation-induced autophagic
activity [13].
The pcDNA4-ADI and pEGFP-LC3 plasmids were
co-transfected into MRC5, PC3, and HepG2 cell lines.
After 96 h of co-transfection, GFP fluorescence was
detected using a confocal microscope. The protein
levels of LC3 were directly verified by Western Blotting. As highlighted in Fig. 6b, c, and supplementary
Fig. S6A, LC3-II proteins were only checked out in
HepG2 and PC3 cells that expressed ADI proteins. Autophagosomes also appeared in the cytoplasm of the same
starved cells as shown in Fig. 6a. Withal, the MRC5 cells
Feng et al. BMC Cancer
(2020) 20:665
Page 7 of 13
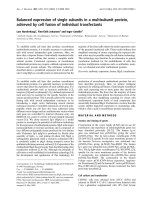
Fig. 4 Molecular mechanism of cell apoptosis induced by arginine deprivation. a: mRNA level detection of some factors related with
mitochondria apoptosis pathway by Quantitative RT-PCR in PC3 and HepG2 cells. b: Immunoblot of the factors related with apoptosis pathway in
PC3 and HepG2 cells. Full-length blots are presented in Supplementary Fig. S4. c: Fluorescence assay for mitochondrial permeability transition
pore (MPTP). d: Activity assay of Caspase 3 through caspase 3 assay kit (Colorimetric) (abcam. ab39401). e: Activity assay of Caspase 9 through
caspase 9 assay kit (Colorimetric) (abcam. Ab65608). f/g: The relative quantification for protein expressions in PC3 and HepG2 cell lines. Grey
scales of protein bands from Fig. 4b were detected by ImageJ 1.52. P values were calculated by comparing pcDNA4-ADI plasmids-treated cells
with pcDNA4 plasmid-treated cells in the respective cell lines. **P < 0.01; ***P < 0.001
did not present any autophagosomes during starvation. At
the same time, the protein expression of histone 3 (H3)
was inspected by Western Blotting. H3 protein levels
decreased hardly after 96 h of arginine deprivation in cells
as shown in Fig. 6d, e, and supplementary Fig. S6B.
Chromatin autophagy was further detected through
fluorescence co-localization technology. As shown in
Fig. 6f, the cell nuclei depicted the budding phenomenon
in HepG2 and PC3 cells. There were some autophagosomes appearing in the cytoplasm. The merged pictures
revealed that DNA fragments, GFP-LC3-II and histone
H3 were located in the same autophagosomes.
Discussion
Tumors tend to adapt to the microenvironmental
changes when they are threatened by death. In clinical
practice, some tumors remain in quiescent conditions
due to hypoplasia of their supplying blood vessels.
Meanwhile, some tumor tissues remain dystrophic since
they cannot obtain enough nutrients from hypoplastic
blood vessels. Besides, selectively starving cancer cells
can also make tumor cells to be malnourished, which is
a metabolic-based therapy for cancers with tiny side effects. Cancer-starving therapies, such as dietary modification, inhibition of tumor angiogenesis, and aspartic
Feng et al. BMC Cancer
(2020) 20:665
Page 8 of 13
Fig. 5 The effect of knock-down of p53 and p53AIP1 genes on apoptosis efficiency induced by ADI. Cells were separately co-transfected by pcDNA4ADI plasmids with siTP53 or siTP53AIP1. Cell apoptosis rates were detected by flow cytometry after the static cell culture for 48 h. a: Representative
images of FACS analysis of annexin V and PI staining of HepG2 and PC3 cells. b: Death ratio summary of FACS analysis from Fig. 5a. c: Fluorescence
assay for mitochondrial permeability transition pore (MPTP) from Fig. 3a. d: Immunoblots of ADI, p53 and p53AIP1 protein expression in HepG2 and
PC3 cells. C-myc-tag antibody was used to detect c-myc-tag-fused ADI. Full-length blots are presented in Supplementary Fig. S5. e: the relative
quantification for protein expressions in PC3 and HepG2 cell lines. Grey scales of protein bands from Fig. 5d were detected by ImageJ 1.52. P values
were calculated by comparing siRNA-treated cells with scrRNA-treated cells in the respective cell lines. **P < 0.01; ***P < 0.001
acid deficiency, can effectively decrease the incidence of
spontaneous tumors and slow the growth of primary
tumors [14].
ADI is a suitable gene to be targeted for cancer gene therapy. As a description of our preliminary work [9], cytosolic
ADI expression displayed a higher apoptosis-inducing efficiency, tumor-targeting specificity, and oncolytic activity
[9]. In order to exclude the actions of adenovirus on cells,
we just used a pcDNATM4/TO/myc-His vector as an ADI
expression vector without replacing the pCMV promoter
with a phTERT promoter. The rapid growth of tumors requires a tremendous supply of nutrients including arginine.
Tumor cells exhibiting ASS gene deficiency such as endometrial cancer are more sensitive to arginine deprivation
than normal cells [15]. Based on the cancer tissue specificity
of ASS expression [4], we used MRC5 (ASS+), PC3 (ASS-),
and HepG2 (ASS-) cell lines to explore whether ADI had
the same effect on different cancer cell lines. As illustrated
in Fig. 1, ADI expressed in the cytosol eventually induced
cellular apoptosis of PC3 and HepG2 cells.
ADI-PEG20 has been proved to induce cellular autophagy and caspase-independent apoptosis by exhausting the arginine in the peripheral microenvironment of
tumors [16]. Notwithstanding, it is unknown whether
cytosolic ADI has the same anti-tumor mechanism. We
aimed at understanding whether ADI has a unique antitumor mechanism in vivo. Consequently, we screened
the protein factors that would interact with ADI using
the yeast hybrid method. FTL was screened out as
revealed in Fig. 2. Co-IP results confirmed the interaction between ADI and FTL in cells. Fluorescence colocalization demonstrated that the interaction happened
in the cytoplasm.
Ferritin is considered as the major iron storage protein, which participates in the regulation of cellular iron
homeostasis [17]. Mitochondrial function also requires
Feng et al. BMC Cancer
(2020) 20:665
Fig. 6 (See legend on next page.)
Page 9 of 13
Feng et al. BMC Cancer
(2020) 20:665
Page 10 of 13
(See figure on previous page.)
Fig. 6 Chromatin autophagy assay at the later time point of arginine deprivation. a: GFP-LC3 reporter fluorescence assay for autophagy in MRC5,
HepG2 and PC3 cells. Cells were co-transfected with pcDNA4-ADI plasmid and pEGFP-LC3 plasmid. The fluorescence of EGFP protein was
detected by OLIMPUS inverted fluorescence microscope SteREO Discovery V12. b: Immunoblot of LC3-I and LC3-II in MRC5, HepG2 and PC3 cells.
Cells were treated as the description of Fig. 6a. LC3 antibody was used to detect LC3-I and LC3-II proteins. C-myc-tag antibody was used to
detect c-myc-tag-fused ADI. Full-length blots are presented in Supplementary Fig. S6A. c: the relative quantification for protein expressions in
MRC5, PC3 and HepG2 cell lines. Grey scales of protein bands from Fig. 6b were detected by ImageJ 1.52. P values were calculated by comparing
pcDNA4-ADI plasmids-treated cells with pcDNA4 plasmid-treated cells in the respective cell lines. **P < 0.01; ***P < 0.001. d: Immunoblots of H3
protein expression in HepG2 and PC3 cells. Cells were transfected with pcDNA4-ADI plasmid. Histone H3 antibody (Cat. # 17168–1-AP) were used
to detect H3 protein. Full-length blots are presented in Supplementary Fig. S6B. e: the relative quantification for protein expressions in MRC5, PC3
and HepG2 cell lines. Grey scales of protein bands from Fig. 6d were detected by ImageJ 1.52. P values were calculated by comparing other cells
with 24 h-treated cells in the respective cell lines. **P < 0.01; ***P < 0.001. f: Immunofluorescence assay for chromatin autophagy. Cells were
cultured in DMEM medium with 2% FBS. Histone H3 antibody (Cat. # 17168–1-AP) were used to detect H3 protein in cells. TRITC conjugated goat
anti-rabbit antibody (Cat. # AS10–1018) was used to detect H3 antibody and display the immunofluorescence
iron replenishment from cytoplasmic ferritin. Thus,
inhibition of ferritin directly results in dysfunction of the
mitochondrial electron transport chain [18]. To exclude
the effect of ADI’s enzymatic activity on cellular metabolism, the catalytic residues of ADI were mutated into
alanine residues. Cysteine398, the catalytic residue of
ADI [10], was mutated into alanine398. Since alamine398 as an inert residue has no nucleophilic catalytic
capacity, the mutation (C398△A398) effectively terminated the enzymatic activity of ADI [19]. As presented
in Fig. 3, ADI△(C398△A398) still induced a small number of cell death in PC3 and HepG2 cells. Overexpression of FTL neutralized the apoptotic effects on these
two cells. Based on these facts, we speculated that FTL
overexpression constituted the part of cytosolic FTL that
had lost its function due to interaction with ADI. That
said, ADI△(C398△A398) needs 3 days to induce cancer
cell death, while ADI only needs 2 days as pointed out in
Fig. 2. It can be seen that cytosolic ADI△ just induces a
limited level of apoptosis through interacting with cytosolic FTL. The interaction between ADI and FTL is not
the main reason for mitochondrial damage. In addition,
as represented in Fig. 1, high concentration of arginine
in the culture medium counteracted the cell death
caused by cytosolic ADI expression. This result further
suggests that arginine deprivation in the cytosol is the
predominant mechanism for cytosolic ADI suppressing
the growth of cancer cells.
Collected pieces of evidence in research papers have
proven that arginine deprivation in vitro exerts its anticancer effects on various tumors by inducing mitochondrial damage and autophagy [5, 6, 20, 21]. Additionally,
arginine deprivation inhibits nitric oxide synthesis in
cells [22, 23]. Thus, arginine deprivation cannot damage
the mitochondria by increasing nitric oxide biosynthesis
in cells. David K. Ann and Hsing-Jien Kung [24] also
reported that mitochondrial damage is the principal
explanation for cancer cell apoptosis induced by ADIPEG20. Our MPTP experiments also confirmed that
cytosolic ADI led to serious mitochondrial damage as
presented in Fig. 4c. However, the exact mechanism
regarding the apoptosis pathway induced by mitochondrial damage during arginine deprivation in vivo is still
not clear.
Next, we checked the expression of some protein
factors associated to the mitochondrial apoptosis
pathway. As demonstrated in Fig. 4a and b, 2 days of
arginine deprivation in vivo increased the expression of
p53 and p53AIP1 proteins in PC3 and HepG2 cells.
Ectopic expression of the p53AIP1 protein induced
down-regulation of the mitochondrial Δψm (transmembrane potential) and release of cytochrome c from the
mitochondria by interacting and inhibiting Bcl-2 in the
outer membrane of the mitochondria [25]. Clearly, after
2 days of starvation, increase in the expression of the
p53AIP1 protein activated p53-dependent apoptosis by
interacting with the same upregulated expression of the
p53 protein [11, 26]. Ultimately, cytochrome C was
released from the mitochondria. Casp3 and Casp9 were
activated as delineated in Fig. 4d and e. At the latest
stage of arginine deprivation in cells (for 4 days), the
PC3 and HepG2 cells seemed to enter the initiative
apoptosis process, due to the fact that increasing expression of Noxa, PUMA, Bax and Bak proteins would
further aggravate mitochondrial damage [27, 28] as
shown in Fig. 4a and b.
We further knocked down the mRNA levels of p53
and p53AIP1 to verify their action during arginine
deprivation in cells. As portrayed in Fig. 5a, b, d, and
supplementary Fig. S5, the knockdown effectively
reduced the apoptosis rates in PC3 and HepG2 cells.
p53 knockdown displayed better effects in terms of
apoptosis inhibition compared to the p53AIP1 knockdown. Mitochondrial damage was also prevented by p53
knockdown, due to the higher fluorescence intensity of
living cells exhibited in Fig. 5c. Consequently, p53dependent apoptosis pathway was the major pathway
induced by cytosolic ADI.
It is worth mentioning that mitochondrial damage was
not the only factor leading to cancer cell death during
Feng et al. BMC Cancer
(2020) 20:665
arginine deprivation in the cytosol. Cellular autophagy
was also reported to be induced by ADI-PEG20 [16].
Autophagy, the process of cellular self-eating, is usually
triggered by starvation or stress, which is capable to
degrade long-lived proteins and organelles such as the
endoplasmic reticulum, mitochondria, peroxisomes,
ribosomes and the nucleus [29, 30]. We also proved that
autophagy was induced by cytosolic ADI. The pEGFPLC3 and pcDNA4-ADI plasmids were co-transfected into
cells. With the expression of ADI, more proteins were
converted from LC3-I to LC3-II as laid out in Fig. 6b.
Cytosolic GFP-LC3-I was conjugated to phosphatidylethanolamine to form GFP-LC3-II during autophagy. GFPLC3-II was subsequently recruited into autophagosomal
membranes during the formation of autophagosomes [31].
As depicted in Fig. 6a, green GFP fluorescent particles
presenting around the nucleus were autophagosomes in
two cancer cells. Thus, with the expression of ADI, the
autophagy induced by arginine starvation was indeed
taking place in these cells.
Hsing-Jien Kung reported that arginine deprivation
in vitro could lead to cancer cell chromatin autophagy
[32]. He equally stipulated that prolonged arginine
deprivation would cause mitochondrial dysfunction and
generation of ROS, eventually resulting in DNA damage
and nuclear membrane remodeling. Excessive autophagy
leads to a giant aggregate of autophagosomes/autolysosomes fusion in the late stage of arginine deprivation
in vitro. Stephen Gregory [33] disclosed that chromatophagy was necessary for the survival of chromosomal
instability in (CIN) cells. Chromatophagy is activated to
remove the defective mitochondria in response to DNA
damage. However, we had an additional view of chromatophagy. We reckon that arginine deprivation mobilizes cells
to utilize endogenous arginine storage. Nucleosomes, especially histone 3 (H3), contain abundant arginine residues.
Consequently, the cells attempt to obtain arginine from
chromatophagy to maintain basic physiology during arginine deprivation. As displayed in Fig. 6f, nucleus budding
occurred in HepG2 and PC3 cells 96 h after co-transfection
of the pcDNA4-ADI and pEGFP-LC3 plasmids. Chromatin
fragment (blue fluorescence) and H3 proteins (red fluorescence) were displayed to co-localize in autophagosomes
(GFP green fluorescence). This showed that ADI expressed
in the cytosol also induced chromatin autophagy. H3
proteins present in autophagosomes implied the utility of
histones arginine.
Conclusion
Based on the above discussion, we can see that the death
of cancer cells is primarily induced by rapid intracellular
arginine deprivation secondary to expression of the ADI
gene in the cytosol. Mitochondrial damage is the main
pathway of cellular death induced by cytosolic ADI as
Page 11 of 13
illustrated in Figure S7. Cytosolic ADI can interrupt the
activity of the mitochondrial electron transport chain by
interacting with cytosolic FTL. The interaction between
cytosolic ADI and FTL only accelerates mitochondrial
damage. DNA damage was demonstrated as the major
reason for mitochondrial damage. Cytosolic ADI leads to
rapid deprivation of cytosolic arginine, which stimulate
cancer cells to utilize endogenous sources of arginine.
Consequently, the cancer cells initiate chromatin autophagy so as to use the abundant levels of arginine existing in
nucleosomes. During the early stage of arginine
deprivation in vivo, chromatin autophagy is negligible, but
DNA damage induces the increased expression of p53 and
p53AIP1 proteins. Subsequently, the interaction between
p53 and p53AIP1 further aggravates mitochondrial damage. During the later stage of arginine deprivation in vivo,
the rise in chromatin autophagy worsens the DNA damage, which leads to the increased expression of Noxa,
PUMA, Bax, and Bak proteins. At this point, mitochondrial damage is far beyond repair, leading to apoptosis
(programmed cell death) of the cancer cells. Even though
our conclusion is still full of unknowns, we plan to provide
a comprehensive explanation of the molecular mechanism
regarding the role of arginine deprivation in the activation
of chromatin autophagy in the future.
Supplementary information
Supplementary information accompanies this paper at />1186/s12885-020-07133-4.
Additional file 1: Figure S1 is associated with Fig. 1c.
Additional file 2: Figure S2. is associated with Fig. 2b.
Additional file 3: Figure S3. is associated with Fig. 3d.
Additional file 4: Figure S4. is associated with Fig. 4b.
Additional file 5: Figure S5. is associated with Fig. 5d.
Additional file 6: Figure S6A. is associated with Fig. 6b.
Additional file 7: Figure S6B. is associated with Fig. 6d. Figure S7 is
mitochondrial apoptosis pathway induced by cytosolic ADI.
Additional file 8: Table S1. displays some primers for qPCR
experiments.
Additional file 9. Cell STR gene type test reports and cell purchase
certificate
Abbreviations
ADI: Arginine deiminase; ADI-PEG20: Pegylated Arginine Deiminase by PEG
20,000; FTL: Ferritin light-chain domain; H3: Histone 3; ASS: Argininosuccinate
synthetase; HCC: Hepatocellular carcinoma; hTERT: Human telomerase
reverse transcriptase; cDNA: Complementary DNA; qRT-PCR: Quantitative
reverse transcription-polymerase chain reaction; co-IP: Coimmunoprecipitation; LC3: Microtubule-associated protein 1A/1B-light chain
3; LC3-II: LC3-phosphatidylethanolamine conjugate; CIN cells: Chromosomal
instability cells
Acknowledgments
The authors thanks Youjun Li and Min Wu for plasmid supply.
Authors’ contributions
XB, QF and XL did most experiments, wrote the manuscript; YW and HZ
participated in plasmid construction and cell culture; XM participated in
Feng et al. BMC Cancer
(2020) 20:665
autophagy assay and flow cytometer assay; CQ helped to prepare real-time
PCR and Western Blot; YY performed the statistical analyses and revised the
manuscript; XB, QF, XL and ZZ conceived and designed the overall study,
supervised the experiments, and wrote the paper. All authors read and
approved the final manuscript.
Funding
This work was supported by Grants from National Natural Science
Foundation of China (Nos. 30800190, 81372441), and State Key Laboratory of
Virology of China. The funder played the role in designing the study, in
supervising the experiments, and in writing the manuscript.
Availability of data and materials
All data generated or analyzed during this study are included in this
published article [and its supplementary information files]. The gene
sequences for plasmid construction are all from NCBI. Accession number of
ADI gene is ‘GenBank: X54141.1’ ( />https-3A__www.ncbi.nlm.nih.gov_nuccore_X54141.1_&d=DwIGaQ&c=vh6
FgFnduejNhPPD0fl_yRaSfZy8CWbWnIf4XJhSqx8&r=Z3BY_DFGt24T_Oe13xHJ2
wIDudwzO_8VrOFSUQlQ_zsz-DGcYuoJS3jWWxMQECLm&m=4qSIQc8s5i3
dtCx-B-SQ8v47LEypiHbJHd_ZSDQ3qsA&s=txP9mFvMjiOiWgMIID8iL2
sijVDKem88fvhgbvuPcmw&e=). Accession number of p53 gene is ‘GenBank:
JQ694050.1’ ( />ncbi.nlm.nih.gov_nuccore_JQ694050.1&d=DwIGaQ&c=vh6
FgFnduejNhPPD0fl_yRaSfZy8CWbWnIf4XJhSqx8&r=Z3BY_DFGt24T_Oe13xHJ2
wIDudwzO_8VrOFSUQlQ_zsz-DGcYuoJS3jWWxMQECLm&m=4qSIQc8s5i3
dtCx-B-SQ8v47LEypiHbJHd_ZSDQ3qsA&s=9AY8CMN-ZcJNclmIec4A9szS1
JsVtbJmkGubKPb4yDA&e=). Accession number of FTL gene is ‘GenBank:
NM_000146.4’ ( />ncbi.nlm.nih.gov_nuccore_NM-5F000146.4&d=DwIGaQ&c=vh6
FgFnduejNhPPD0fl_yRaSfZy8CWbWnIf4XJhSqx8&r=Z3BY_DFGt24T_Oe13xHJ2
wIDudwzO_8VrOFSUQlQ_zsz-DGcYuoJS3jWWxMQECLm&m=4qSIQc8s5i3
dtCx-B-SQ8v47LEypiHbJHd_ZSDQ3qsA&s=fU3MQSzjGMGnAEkTI5
UZXcvCaVd9qqiQ6VK7FuFq5fw&e=).
Ethics approval and consent to participate
The report data in this manuscript were collected from three cell lines
including HepG2, PC3 and MRC5. The Ethics Committee of Wuhan University
(ECWU) in China authorized all of the experiments in the manuscript. We
consent to participate under the ‘Ethics, consent and permissions’ heading.
Consent for publication
Not applicable.
Page 12 of 13
5.
6.
7.
8.
9.
10.
11.
12.
13.
14.
15.
16.
17.
18.
Competing interests
The authors declare that they have no competing interests.
Author details
1
State Key Laboratory of Virology, College of Life Sciences, Wuhan University,
Wuhan 430072, China. 2Department of Otorhinolaryngology Head and Neck
Surgery, the First Affiliated Hospital of Guangxi Medical University, Nanning
530021, Guangxi, China. 3Department of Oncology, Renmin Hospital of
Wuhan University, Wuhan 430060, China.
19.
20.
21.
Received: 2 February 2020 Accepted: 2 July 2020
22.
References
1. Yadav L, Puri N, Rastogi V, Satpute P, Sharma V. Tumour angiogenesis and
Angiogenic inhibitors: a review. J Clin Diagn Res. 2015;9(6):XE01–5.
2. Izzo F, Marra P, Beneduce G, Castello G, Vallone P, Rosa VD, Cremona F,
Ensor CM, Holtsberg FW, Bomalaski JS, et al. Pegylated arginine Deiminase
treatment of patients with metastatic melanoma: results from phase I and II
studies. J Clin Oncol. 2005;23(30):7660–8.
3. Glazer ES, Piccirillo M, Albino V, Giacomo RD, Palaia R, Mastro AA, Beneduce
G, Castello G, Rosa VD, Petrillo A, et al. Phase II study of Pegylated arginine
Deiminase for Nonresectable and metastatic hepatocellular carcinoma. J
Clin Oncol. 2010;28(13):2220–6.
4. Dillon BJ, Prieto VG, Curley SA, Ensor CM, Holtsberg FW, Bomalaski JS, Clark
MA. Incidence and distribution of argininosuccinate synthetase deficiency in
23.
24.
25.
26.
human cancers, a method for identifying cancers sensitive to arginine
deprivation. Cancer. 2004;100(4):826–33.
Changou CA, Chen Y-R, Xing L, Yen Y, Chuang FYS, Cheng H, Bold RJ, Ann
DK, Kung H-J. Arginine starvation-associated atypical cellular death involves
mitochondrial dysfunction, nuclear DNA leakage, and chromatin autophagy.
PNAS. 2014;111(39):14147–52.
Qiu F, Chen Y-R, Liu X, Chu C-Y, Shen L-J, Xu J, Gaur S, Forman HJ, Zhang H,
Zheng S, et al. Arginine starvation impairs mitochondrial respiratory
function in ASS1-deficient breast Cancer cells. Sci Signal. 2014;7(319):1–10.
Szlosarek PW, Luong P, Phillips MM, Baccarini M, Ellis S, Szyszko TA, Sheaff
M, Avril N. Metabolic response to Pegylated arginine Deiminase in
mesothelioma with promoter methylation of Argininosuccinate Synthetase.
J Clin Oncol. 2013;31(7):111–3.
Abou-Alfa GK, Qin S, Ryoo BY, Lu SN, Yen CJ, Feng YH, Lim HY, Izzo F, Colombo
M, Sarker D, et al. Phase III randomized study of second line ADI-PEG 20 plus best
supportive care versus placebo plus best supportive care in patients with
advanced hepatocellular carcinoma. Ann Oncol. 2018;29(6):1402–8.
Jiang H, Guo S, Xiao D, Bian X, Wang J, Zheng Z. Arginine deiminase
expressed in vivo displayed higher hepatoma targeting and oncolytic
efficiency, which was driven by human telomerase reverse transcriptase
promoter. Oncotarget. 2017;8(23):37694–704.
Das K, Butler GH, Kwiatkowski V, Arthur D. Clark J, Yadav P, Arnold E: Crystal
structures of arginine Deiminase with covalent reaction intermediates:
implications for catalytic mechanism. Struture 2004, 12:657–667.
Oda K, Arakawa H, Tanaka T, Matsuda K, Tanikawa C, Mori T, Nishimori H,
Tamai K, Tokino T, Nakamura Y, et al. p53AIP1, a potential mediator of p53dependent apoptosis, and its regulation by Ser-46-phosphorylated p53. Cell.
2000;102:849–62.
Rabinowitz JD, White E. Autophagy and metabolism. Science. 2010;
330(6009):1344–8.
Tanida I, Waguri S. Measurement of autophagy in cells and tissues. Methods
Mol Biol. 2010;648:193–214.
Simone BA, Champ CE, Rosenberg AL, Berger A, Monti DA, Dicker AP,
Simone NL. Selectively starving cancer cells through dietary manipulation:
methods and clinical implications. Future Oncol. 2013;9(7):959–76.
Ohshima K, Nojima S, Tahara S, Kurashige M, Hori Y, Hagiwara K, Okuzaki D,
Oki S, Wada N, Ikeda J-i, et al. Argininosuccinate synthase 1-deficiency
enhances the cell sensitivity to arginine through decreased DEPTOR
expression in endometrial Cancer. Sci Rep. 2017;30(7):45504–18.
Randie HK, Jodi MC, Tawnya LB, Gregory PM, Julie S, Kung HJ, et al. Arginine
Deiminase as a novel therapy for prostate Cancer induces autophagy and
Caspase-independent apoptosis. Cancer Res. 2009;69(2):700–8.
Arosio P, Elia L, Poli M. Ferritin, cellular iron storage and regulation. IUBMB
Life. 2017;69(6):414–22.
Richardson DR, Lane DJR, Becker EM, Huang ML-H, Whitnall M, Rahmanto
YS, Sheftel AD, Ponkac P. Mitochondrial iron trafficking and the integration
of iron metabolism between the mitochondrion and cytosol. PNAS. 2010;
107(24):10775–82.
Lu X, Galkin A, Herzberg O, Dunaway-Mariano D. Arginine Deiminase uses
an active-site cysteine in Nucleophilic catalysis of l-arginine hydrolysis. J Am
Chem Soc. 2004;126(17):5374–5.
Szlosarek PW. Arginine deprivation and autophagic cell death in cancer.
PNAS. 2014;111(39):14015–6.
Savaraj N, You M, Wu C, Wangpaichitr M, Kuo MT, Feun LG. Arginine
deprivation, autophagy, apoptosis (AAA) for the treatment of melanoma.
Curr Mol Med. 2010;10(4):405–12.
Sezgin N, Torun T, Yalcin F. Biochemical characterization of the arginine
degrading enzymes arginase and arginine deiminase and their effect on
nitric oxide production. Med Sci Monit. 2002;8(10):LE44–0.
Zou S, Wang X, Liu P, Ke C, Xu S. Arginine metabolism and deprivation in
cancer therapy. Biomed Pharmacother. 2019;118:1–11.
Cheng C-T, Qi Y, Wang Y-C, Chi KK, Chung Y, Ouyang C, Chen Y-R, Oh ME,
Sheng X, Tang Y, et al. Arginine starvation kills tumor cells through
aspartate exhaustion and mitochondrial dysfunction. Commun Biol. 2018;
1(178):1–19.
Matsuda K, Yoshida K, Taya Y, Nakamura K, Nakamura Y, Arakawa H. p53AIP1
regulates the mitochondrial apoptotic pathway. Cancer Res. 2002;62(10):
2883–9.
O’Prey J, Crighton D, Martin AG, Vousden KH, O. Fearnhead H, Ryan KM:
p53-mediated induction of Noxa and p53AIP1 requires NFκB. Cell Cycle
2010, 9(5):947–952.
Feng et al. BMC Cancer
(2020) 20:665
27. Vaseva AV, Moll UM. The mitochondrial p53 pathway. Biochim Biophys Acta.
1787;2009:414–20.
28. Brenner C, Galluzzi L, Kepp O, Kroemer G. Decoding cell death signals in
liver inflammation. J Hepatol. 2013;59(3):583–94.
29. Stolz A, Ernst A, Dikic I. Cargo recognition and trafficking in selective
autophagy. Nat Cell Biol. 2014;16:495–501.
30. Kaur J, Debnath J. Autophagy at the crossroads of catabolism and
anabolism. Mol Cell Biochem. 2015;16:461–72.
31. Zhang Z, Singh R, Aschner M. Methods for the detection of autophagy in
mammalian cells. Curr Protoc Toxicol. 2016;69(1):20.12.21–6.
32. Kung H-J, Changou CA, Li C-F, Ann DK. Chromatophagy: autophagy goes
nuclear and captures broken chromatin during arginine-starvation.
Autophagy. 2015;11(2):419–21.
33. Liu D, Shaukat Z, Xu T, Denton D. Robert Saint3, Gregory S: autophagy
regulates the survival of cells with chromosomal instability. Oncotarget.
2016;7(39):63913–23.
Publisher’s Note
Springer Nature remains neutral with regard to jurisdictional claims in
published maps and institutional affiliations.
Page 13 of 13