Comprehensive analysis of spread through air spaces in lung adenocarcinoma and squamous cell carcinoma using the 8th edition AJCC/UICC staging system
Bạn đang xem bản rút gọn của tài liệu. Xem và tải ngay bản đầy đủ của tài liệu tại đây (1.28 MB, 11 trang )
Jia et al. BMC Cancer
(2020) 20:705
/>
RESEARCH ARTICLE
Open Access
Comprehensive analysis of spread through
air spaces in lung adenocarcinoma and
squamous cell carcinoma using the 8th
edition AJCC/UICC staging system
Meng Jia, Shili Yu, Jiaqi Yu, Yuemin Li, Hongwen Gao and Ping-Li Sun*
Abstract
Background: This study aimed to comprehensively investigate the effect of spread through air spaces (STAS) on
clinicopathologic features, molecular characteristics, immunohistochemical expression, and prognosis in lung
adenocarcinomas (ADC) and squamous cell carcinomas (SQCC) based on the 8th edition AJCC/UICC staging
system.
Methods: In total, 303 ADC and 121 SQCC cases were assessed retrospectively. Immunohistochemical staining was
performed for E-cadherin, vimentin, Ki67, survivin, Bcl-2, and Bim. Correlations between STAS and other parameters
were analyzed statistically.
Results: STAS was observed in 183 (60.4%) ADC and 39 (32.2%) SQCC cases. In ADC, the presence of STAS was
associated with wild-type EGFR, ALK and ROS1 rearrangements, low E-cadherin expression, and high vimentin and
Ki67 expression. In SQCC, STAS was associated with low E-cadherin expression and high vimentin and survivin
expression. Based on univariate analysis, STAS was associated with significantly shorter disease-free survival (DFS)
and overall survival (OS) in ADC. In SQCC, STAS tended to be associated with shorter OS. By multivariate analysis,
STAS was an independent poor prognostic factor in ADC for DFS but not OS. Stratified analysis showed that STAS
was correlated with shorter DFS for stage I, II, IA, IB, and IIA ADC based on univariate analysis and was an
independent risk factor for DFS in stage I ADC cases based on multivariate analysis.
Conclusions: Our findings revealed that STAS is an independent negative prognostic factor for stage I ADC using
the new 8th edition AJCC/UICC staging system. Stage I patients with STAS should be followed up more closely and
might need different treatment strategies.
Keywords: Non-small cell lung cancer, Adenocarcinoma, Squamous cell carcinoma, Spread through air spaces
(STAS), 8th edition AJCC/UICC staging system
* Correspondence:
Department of pathology, The Second Hospital of Jilin University, 218
Ziqiang Road, Changchun 130041, Jilin, China
© The Author(s). 2020 Open Access This article is licensed under a Creative Commons Attribution 4.0 International License,
which permits use, sharing, adaptation, distribution and reproduction in any medium or format, as long as you give
appropriate credit to the original author(s) and the source, provide a link to the Creative Commons licence, and indicate if
changes were made. The images or other third party material in this article are included in the article's Creative Commons
licence, unless indicated otherwise in a credit line to the material. If material is not included in the article's Creative Commons
licence and your intended use is not permitted by statutory regulation or exceeds the permitted use, you will need to obtain
permission directly from the copyright holder. To view a copy of this licence, visit />The Creative Commons Public Domain Dedication waiver ( applies to the
data made available in this article, unless otherwise stated in a credit line to the data.
Jia et al. BMC Cancer
(2020) 20:705
Background
Spread through air spaces (STAS) is a phenomenon of
lung cancer spread, which is defined as tumor cells
within air spaces in the lung parenchyma beyond the
edge of the main tumor. STAS was first named by
Kadota and colleagues in 2015 [1] and has received
widespread attention since its identification. The significance of STAS is predominantly due to its predictive
value on prognosis. The presence of STAS was found to
be correlated with aggressive clinicopathologic features
and poor prognosis in several histological types of lung
cancers. Moreover, according to 2015 World Health
Organization (WHO) classification [2], this morphological manifestation was listed as an exclusion criterion
for the diagnosis of adenocarcinoma in situ and minimally invasive adenocarcinoma (MIA). Although the clinicopathologic features and prognostic significance of
STAS have been investigated, the published studies were
mainly conducted according to the 7th edition of
American Joint Committee on Cancer (AJCC)/Union for
International Cancer Control (UICC) staging system;
few studies have analyzed the association between STAS
and pathological stage (p-stage) using the new 8th edition AJCC/UICC staging system. Compared with the 7th
edition of AJCC/UICC staging system, the change in the
new TNM staging criteria mainly concerns the description of T. T stage is subdivided at a 1-cm cut-off when
the tumor size is less than or equal to 5 cm [3], and this
improved T staging results in a better correlation with
prognosis. However, although STAS has been reported
to be significant with respect to the prediction of survival for early-stage tumors, few studies have analyzed
the significance of STAS based on a single subdivided
stage exclusively.
In addition to the aforementioned challenges, the association between STAS and molecular characteristics of
lung adenocarcinoma (ADC) has not been clearly explicated, and this issue has been barely studied in Chinese
patients. Meanwhile, little progress has been achieved in
elucidating the association between STAS and the
immunohistochemical expression of epithelial–mesenchymal transition (EMT), proliferation, and apoptosisrelated markers. The purpose of this study was to
comprehensively investigate the effect of STAS on clinicopathologic features, molecular characteristics, immunohistochemical expression, and prognosis in lung ADC
and squamous cell carcinomas (SQCCs) based on the
8th edition AJCC/UICC staging system.
Methods
This study was approved by the ethics committee of The
Second Hospital of Jilin University (Changchun, China).
Written informed consent was also obtained from all
patients.
Page 2 of 11
Patients and sample collection
We retrospectively collected the data and tissue
specimens of patients who underwent surgical resection
(limited resection or lobectomy) for primary lung ADCs
and SQCCs between 2010 and 2014. In our institution,
limited resection (including wedge resection and segmentectomy) was performed based on a comprehensive
consideration of the following issues: (1) tumors smaller
than 3 cm with radiologically ground glass node (consolidation/tumor ratio < 0.5); (2) tumor location within
the outer third of the lung parenchyma; (3) general status and respiratory function of the patients. Cases with
neoadjuvant therapy, positive surgical margins, a diagnosis of multiple primary lung cancers, a diagnosis of in
situ or MIA, and no available tumor slides for review
were excluded from this study. In total, 303 cases of
ADCs and 121 cases of SQCCs were assessed. Clinical
parameters including patient age, sex, smoking history,
tumor size, p-stage, and follow-up were collected from
the original medical records. The tumor p-stage was
restaged using the 8th edition AJCC/UICC staging system. The period of follow-up ranged from 1 to 65
months.
Histological review
All tissue specimens were reviewed retrospectively.
Pathological parameters including pleural invasion,
blood and lymphatic vessel invasion, perineural invasion, and necrosis were recorded. For ADCs, comprehensive histologic subtyping was also performed.
ADCs were classified as lepidic, acinar, papillary,
micropapillary, or solid subtypes according to the
2015 WHO classification [2].
Tumor STAS was defined according to the descriptions summarized by Kadota et al. [1]. In each case, at
least four slides were observed to detect STAS. The
presence of STAS was recorded as “present” or “absent,”
regardless of the subtypes of STAS cells. Artificial
fragments and other mimics including a micropapillary
pattern of invasion and intra-alveolar macrophages were
strictly evaluated and excluded.
Immunohistochemistry
Immunohistochemical staining was performed automatically using PT Link Pre-Treatment system (DAKO, CA,
USA) and Autostainer Link 48 system (DAKO, CA,
USA). Endogenous peroxidases were quenched with 3%
H2O2 for 10 min. The sections were incubated with
primary antibodies (Additional file 1) for 30 min. The
samples was then incubated with the secondary biotinylated antibody for 20 min. The slides were stained using
3, 3′-diaminobenzidine and counterstained with
hematoxylin.
Jia et al. BMC Cancer
(2020) 20:705
Page 3 of 11
Scoring of immunostained tissue sections
Statistical analysis
The expression of markers was quantified based on the
extent of staining (by percentage of positive tumor cells:
0–100%; for E-cadherin, only tumor cells with complete
membranous staining were counted) and the intensity of
staining (graded on a scale of 0–3 as follows: 0, no staining; 1, weak staining; 2, moderate staining; and 3, strong
staining). A semi-quantitative score was obtained by
multiplying the grades of intensity by the percentage of
positively stained cells. The median value of all the
scores was chosen as the cut-off value to divide patients
into high and low expression categories [4]. All specimens were evaluated under light microscopy by two independent pathologists (M.J. and P.L.S.).
Statistical analyses were performed using the software
Statistical Package for Social Sciences, version 22.0, for
Windows (SPSS, IL, USA). Chi-squared or Fisher’s exact
tests were used to determine if any associations were
evident between STAS and clinicopathologic parameters
and the expression of immunohistochemical markers.
Survival curves were determined using the Kaplan–
Meier method, and statistical differences in survival
times were determined using the log-rank test. The Cox
proportional hazards model was applied for multivariate
survival analysis. A p value < 0.05 was considered statistically significant.
Results
Patient clinicopathologic characteristics and outcome
Analysis of adenocarcinoma-associated mutations and
rearrangement
Samples were analyzed for epidermal growth factor receptor (EGFR) mutations within exons 18 to 21 and
KRAS (Kirsten rat sarcoma viral oncogene homolog)
mutations at codons 12 and 13 using an amplification
refractory mutation system (Super-ARMS EGFR
Mutation Detection Kit and KRAS Mutation Detection
Kit, Amoy Diagnostics Co. Ltd., Xiamen, China). The
presence of anaplastic lymphoma kinase (ALK) and
ROS1 (ROS proto-oncogene 1, receptor tyrosine kinase)
translocation was evaluated by fluorescence in situ
hybridization as described previously [5, 6].
In the cohort of 303 ADC cases, there were 150 male
and 153 female patients, ranging in age from 23 to 83
years (median of 65 years). The predominant invasive
pattern was acinar in 154 (50.8%), papillary in 82
(27.1%), lepidic in 45 (14.8%), solid in six (2.0%), and
micropapillary in 16 (5.3%) cases. P-stage was IA in 86,
IB in 87, IIA in 46, IIB in 11, IIIA in 48, IIIB in five, and
IV in 20 cases. The follow-up period was from 1 to 65
months with a median of 30 months. Ninety-one patients showed recurrence, and 32 patients died of disease
in the last follow-up.
In the cohort of 121 SQCC cases, patient age ranged
from 31 to 85 years (median 69 years). Most patients
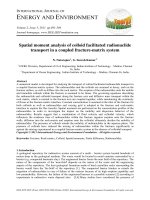
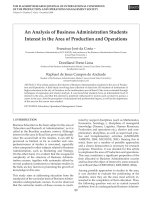
Fig. 1 Tumor spread through air spaces (STAS). a, b: STAS in lung adenocarcinoma (ADC); c, d: STAS in squamous cell carcinoma (SQCC). (a-d:
H&E staining; a, c: 40×; b, d: 100×)
Jia et al. BMC Cancer
(2020) 20:705
Page 4 of 11
Table 1 Correlations between clinicopathological parameters
and STAS in ADC
Table 1 Correlations between clinicopathological parameters
and STAS in ADC (Continued)
Parameters
In
total
STAS
Parameters
Positive(n(%))
Negative(n(%))
In total
303
183(60.4)
120(39.6)
p
Gender
Female
153
91(49.7)
62(51.7)
Male
150
92(50.3)
58(48.3)
≤ 65
157
91(49.7)
66(55.0)
> 65
146
92(50.3)
54(45.0)
0.741
Age
0.369
Smoking history
Non-smoker
183
112(61.2)
71(59.2)
Smoker
120
71(38.8)
49(40.8)
≤ 3 cm
177
94(51.4)
83(69.2)
> 3 cm
126
89(48.6)
37(30.8)
0.723
Tumor size
0.002
Predominant subtype
Acinar
154
89(48.6)
65(54.2)
Papillary
82
54(29.5)
28(23.3)
Lepidic
45
27(14.8)
18(15.0)
Solid
6
1(0.5)
5(4.2)
Micropapillary
16
12(6.6)
4(3.3)
0.104
229
115(62.8)
114(95.0)
Present
74
68(37.2)
6(5.0)
Absent
168
93(50.8)
75(62.5)
Present
135
90(49.2)
45(37.5)
< 0.001
Pleural invasion
0.045
Vascular invasion
Absent
189
92(50.3)
97(80.8)
Present
114
91(49.7)
23(19.2)
Absent
148
58(31.7)
90(75.0)
Present
155
125(68.3)
30(25.0)
Absent
280
163(89.1)
117(97.5)
Present
23
20(10.9)
3(2.5)
Absent
196
103(56.3)
93(77.5)
Present
107
80(43.7)
27(22.5)
Absent
212
110(60.1)
102(85.0)
Present
91
73(39.9)
18(15.0)
230
128(69.9)
102(85.0)
< 0.001
Lymphatic invasion
< 0.001
Perineural invasion
0.007
Tumor necrosis
< 0.001
Tumor relapse
< 0.001
Pathological stage
Stage I-II
STAS
Positive(n(%))
Negative(n(%))
StageIA
86
39(21.3)
47(39.2)
StageIB
87
50(27.3)
37(30.8)
StageIIA
46
29(15.8)
17(14.2)
StageIIB
11
10(5.5)
1(0.8)
Stage III-IV
73
55(30.1)
18(15.0)
p
0.111
0.146
EGFR mutation
Negative
143
96(52.5)
47(39.2)
Positive
160
87(47.5)
73(60.8)
Negative
243
148(91.9)
95(96.0)
Positive
17
13(8.1)
4(4.0)
0.023
KRAS mutation
0.201
ALK rearrangement
Negative
279
160(87.4)
119(99.2)
Positive
24
23(12.6)
1(0.8)
< 0.001
ROS1 rearrangement
Negative
294
174(95.1)
120(100.0)
Positive
9
9(4.9)
0(0)
0.013
*Correlation between stage I-II and stage III-IV
Presence of micropapillary
Absent
In
total
0.003*
were men (n = 119). P-stage was IA in 28, IB in 21, IIA
in 26, IIB in 14, IIIA in 28, IIIB in one, and IV in three
cases. The follow-up period was from 1 to 65 months
with a median of 34 months. Thirty-two patients showed
recurrence, and 16 patients died of disease in the last
follow-up.
Tumor STAS and its association with clinicopathologic
parameters
In the ADC cohort, tumor STAS was observed in 183
(60.4%) cases (Fig. 1). The association between clinicopathologic parameters and STAS is summarized in
Table 1. STAS was more frequently identified in tumors
with pathological features characteristic of aggressive
tumor behavior, such as larger tumor size (p = 0.002),
presence of micropapillary pattern (p < 0.001), pleural
invasion (p = 0.045), vascular invasion (p < 0.001),
lymphatic invasion (p < 0.001), perineural invasion (p =
0.007), presence of tumor necrosis (p < 0.001), and
higher p-stage (p = 0.003).
In the SQCC cohort, tumor STAS was observed in 39
(32.2%) cases (Fig. 1). The association between clinicopathologic parameters and STAS is summarized in
Table 2. STAS was significantly associated with the
presence of lymphatic invasion (p = 0.020). STASpositive cases were more likely to show perineural invasion, although this trend was not statistically significant
(p = 0.080). Other parameters including patient age,
Jia et al. BMC Cancer
(2020) 20:705
Page 5 of 11
Table 2 Correlations between clinicopathological parameters
and STAS in SQCC
Parameters
In
total
STAS
Positive(n(%))
Negative(n(%))
In total
121
39(32.2)
82(67.8)
Female
2
0(0)
2(2.4)
Male
119
39(100.0)
80(97.6)
≤ 65
38
15(38.5)
23(28.0)
> 65
83
24(61.5)
59(72.0)
p
Gender
1.000
Age
Tumor STAS and molecular alterations in ADC
The association between STAS and molecular alterations
was exclusively analyzed in the ADC cohort (Table 1).
STAS-positive cases were more likely to harbor wildtype EGFR (p = 0.023), ALK rearrangements (p < 0.001),
or ROS1 rearrangements (p = 0.013). KRAS mutations
were detected in 260 cases and no correlation was found
between STAS and KRAS mutations (p = 0.201).
Tumor STAS and immunohistochemical expression
0.249
Smoking history
Non-smoker
6
0(0)
6(7.3)
Smoker
115
39(100.0)
76(92.7)
≤ 3 cm
37
12(30.8)
25(30.5)
> 3 cm
84
27(69.2)
57(69.5)
Absent
82
28(71.8)
54(65.9)
Present
39
11(28.2)
28(34.1)
Absent
89
25(64.1)
64(78.0)
Present
32
14(35.9)
18(22.0)
Absent
68
16(41.0)
52(63.4)
Present
53
23(59.0)
30(36.6)
Absent
103
30(76.9)
73(89.0)
Present
18
9(23.1)
9(11.0)
Absent
12
3(7.7)
9(11.0)
Present
109
36(92.3)
73(89.0)
Absent
89
29(74.4)
60(73.2)
Present
32
10(25.6)
22(26.8)
0.175
Tumor size
0.975
Pleural invasion
0.513
Vascular invasion
0.104
Lymphatic invasion
0.020
Perineural invasion
0.080
Tumor necrosis
0.750
Tumor relapse
0.890
Pathological stage
Stage I-II
89
26(66.7)
63(76.8)
0.236*
StageIA
28
8(20.5)
20(24.4)
0.443
StageIB
21
4(10.3)
17(20.7)
StageIIA
26
11(28.2)
15(18.3)
StageIIB
14
3(7.7)
11(13.4)
Stage III-IV
32
13(33.3)
19(23.2)
0.299
*Correlation between stage I-II and stage III-IV
smoking history, tumor size, pleural invasion, vascular
invasion, tumor necrosis, and p-stage showed no differences between STAS-positive and STAS-negative cases.
The association between STAS and immunohistochemical expression is summarized in Table 3. For both ADC
and SQCC, the expression of E-cadherin and vimentin
was significantly different between STAS-positive and
STAS-negative cases. STAS-positive cases were more
likely to show low E-cadherin expression (p = 0.001 and
0.012 for ADC and SQCC, respectively) and high vimentin expression (p = 0.003 and 0.034 for ADC and SQCC,
respectively). In ADC, Ki67 expression was higher in
STAS-positive cases (p < 0.001), whereas this correlation
was not observed in SQCC. The expression of survivin
was significantly higher in STAS-positive SQCC (p <
0.001) than in STAS-negative cases; however, this trend
was not observed in ADC. The expression of Bcl-2 and
Bim showed no correlation with the status of STAS in
either ADC or SQCC.
Survival analysis
By univariate analysis, we first analyzed the association
between conventional clinicopathologic factors and patient outcomes for ADC and SQCC separately. In ADC,
patient age > 65, tumor size > 3 cm, the presence of
pleural invasion, vascular invasion, lymphatic invasion,
and more advanced p-stage were associated with a significantly worse disease-free survival (DFS) and/or overall survival (OS) (Table 4). In SQCC, the presence of
lymphatic invasion and more advanced p-stage was associated with a significantly worse DFS (Additional file 2).
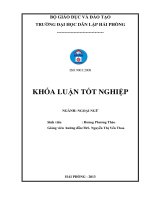
Thereafter, we analyzed the prognostic significance of
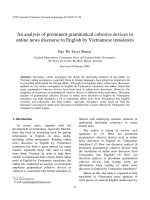
STAS. In ADC, STAS was associated with significantly
shorter DFS (40.42 vs. 55.73 months; p < 0.001) and
shorter OS (56.79 vs. 60.72 months; p = 0.025; Fig. 2,
Table 4). In SQCC, STAS was associated with shorter
OS, although this trend was not statistically significant
(48.90 vs. 59.67 months; p = 0.050). STAS was not found
to be associated with DFS in the SQCC cohort (44.95 vs.
48.72 months; p = 0.795; Fig. 2, Additional file 2). Multivariate Cox analysis showed that STAS was an independent poor prognostic factor for ADC regarding DFS
but not OS (DFS: hazard ratio (HR), 2.460; 95% confidence interval (CI), 1.398–4.327; p = 0.002; OS: HR,
1.187; 95% CI, 0.466–3.026; p = 0.719; Table 5). Given
the lack of a statistically significant association between
clinicopathologic parameters and survival in patients
Jia et al. BMC Cancer
(2020) 20:705
Page 6 of 11
Table 3 Correlations between immunohistochemical expression and STAS
Antibodies
In
total
STAS in ADC
Positive(n(%))
Negative(n(%))
Low
171
119(66.9)
52(47.3)
High
117
59(33.1)
58(52.7)
Low
143
76(42.7)
67(60.9)
High
145
102(57.3)
43(39.1)
Low
113
67(37.6)
46(41.8)
High
175
111(62.4)
64(58.2)
Low
125
62(34.8)
63(57.3)
High
163
116(65.2)
47(42.7)
Low
115
76(42.7)
39(35.5)
High
173
102(57.3)
71(64.5)
Low
135
87(48.9)
48(43.6)
High
153
91(51.1)
62(56.4)
In
total
p
STAS in SQCC
Positive(n(%))
p
Negative(n(%))
E-cadherin
0.001
32
16(41.0)
16(19.5)
89
23(59.0)
66(80.5)
54
12(30.8)
42(51.2)
67
27(69.2)
40(48.8)
0.012
Vimentin
0.003
0.034
Survivin
0.481
77
15(38.5)
62(75.6)
44
24(61.5)
20(24.4)
59
22(56.4)
37(45.1)
62
17(43.6)
45(54.9)
< 0.001
Ki67
< 0.001
0.246
Bcl-2
0.223
71
22(56.4)
49(59.8)
50
17(43.6)
33(40.2)
61
23(59.0)
38(46.3)
60
16(41.0)
44(53.7)
0.727
Bim
with SQCC, we did not subject the outcomes of patients
in this group to multivariate analyses.
To investigate the significance of STAS in ADC of different stages, we analyzed the prognostic significance
stratified by tumor stage. STAS was associated with
shorter DFS and OS only in stage I-II tumors, but not in
stages III-IV (DFS: p < 0.001 vs. p = 0.736; OS: p = 0.015
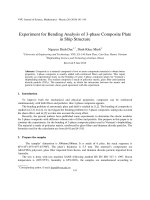
vs. p = 0.332; Table 4). Further stratification analysis
showed that STAS was correlated with shorter DFS for
stage I (p < 0.001), II (p = 0.007), IA (p = 0.009), IB (p =
0.025), and IIA (p = 0.003) tumors based on univariate
analysis (Fig. 3, Additional file 3). However, this observation was not observed with respect to OS. In
multivariate analysis, STAS was an independent risk
factor for DFS in stage I cases (p = 0.004, Additional file 4). Multivariate analysis was not performed
for stage II or IIA cases as STAS was the only risk
factor for DFS. Stratification analysis was not performed for other stages of ADC or SQCC because of
the small sample size in each stage.
Discussion
In this study, we investigated the association between
STAS and clinicopathologic features, molecular alterations, the expression of immunohistochemical markers,
and prognostic significance in both ADC and SQCC
based on Chinese patients. We found that STAS was associated with aggressive clinicopathologic features, wild-
0.387
0.194
type EGFR, rearranged ALK or ROS1, low expression of
E-cadherin and high expression of vimentin, Ki67, and
survivin. In the prognostic analysis, STAS was associated
with poor DFS and OS in ADC by univariate analysis
and was an independent risk factor for DFS by multivariate analysis. In addition, STAS was associated with poor
DFS in single stage I, II, IA, IB, and IIA ADC patients
according to the new 8th edition AJCC/UICC staging
system.
Since 2018, a few studies have discussed the significance of STAS based on the 8th edition AJCC/UICC staging system, and the reported results mainly focused on
ADC [7–15]. Some attention has been paid to the significance of STAS in stage I patients; however, few studies analyzed the significance of STAS in other stages
exclusively. Recently, Terada and colleagues found that
STAS was an independent predictor of recurrence in
stage III (N2) ADC [15]. In the current study, STAS was
found to be associated with poor DFS and OS in stage III patients but not in stage III-IV cases. This observation
indicates that the prognostic significance of STAS
mainly exists in early-stage ADC cases, and pathological
evaluation of STAS should be performed more cautiously for these tumors. In the analysis of single-stage
ADC, STAS was associated with poor DFS in stage I, II,
IA, IB, and IIA patients, but not OS. These results reveal
more details on the significance of STAS with respect to
recurrence. When STAS is observed in these lymph
Jia et al. BMC Cancer
(2020) 20:705
Page 7 of 11
Table 4 Univariate survival analysis of DFS and OS in ADC
Parameters
DFS
OS
Mean DFS (month) p
Mean OS (month) p
Age
≤ 65
44.34
0.228 58.92
> 65
49.46
56.52
≤ 3 cm
49.61
0.002 60.22
> 3 cm
41.87
55.70
0.033
Tumor size
0.054
Pleural invasion
Absent
51.14
< 0.001 60.15
Present
41.18
55.45
0.002
Vascular invasion
Absent
49.17
0.064 60.56
Present
41.21
50.79
0.009
Lymphatic invasion
Absent
52.00
< 0.001 59.75
Present
41.40
55.06
0.001
Perineural invasion
Absent
47.39
0.598 59.00
Present
43.89
52.78
0.266
Pathological stage
Stage I-II
49.93
< 0.001 61.47
Stage III-IV 37.65
47.59
< 0.001
Presence of micropapillary
Absent
48.77
0.120 58.81
Present
41.98
55.58
Absent
55.73
< 0.001 60.72
Present
40.42
56.79
0.655
STAS
0.025
STAS (in Stage I-II)
Absent
58.20
< 0.001 62.96
Present
41.91
59.57
0.015
STAS (in Stage III-IV)
Absent
30.75
0.736 35.30
Present
36.88
48.87
0.332
node-negative ADCs, close follow-up should be implemented. Further studies are needed to discuss whether
these patients need post-operative adjuvant therapy.
Only a few studies have analyzed STAS in SQCC. In
SQCC, the incidence of STAS was generally lower than
that in ADC, which was from 19.1% [16] to 40.3% [17].
Positive STAS was observed to be associated with larger
tumor size, lymphovascular invasion, tumor necrosis,
high-grade tumor budding, larger nuclear diameter,
higher mitotic counts, and higher T, N, and p-stages
[16–18]. In survival analyses, STAS was also reported to
be a significant predictive factor of DFS and OS [16–18],
especially in stage I patients [16]. In the current study,
STAS was associated with shorter OS, although this
trend was not statistically significant, and no correlation
was found between STAS and DFS. This could be because the simple size of the current study was smaller
than that of previous reports.
The association between STAS and molecular characteristics has not been clearly explicated. Molecular characteristics were exclusively studied in ADC. STAS was
frequently observed in tumors with ALK and ROS1 rearrangements, BRAF mutations, or wild-type HER2 [6, 7,
19–21]. In the current study, 95.8% (23/24) cases with
ALK rearrangements and all cases with ROS1 rearrangements demonstrated STAS, and this observation was
similar to that of previous results. Three articles reported the association between STAS and KRAS mutations; one study concluded that STAS was frequently
observed in tumors with KRAS mutations, whereas the
other two reported no association [7, 19, 20]. Our results
also concluded no association between STAS and KRAS
mutations. However, as the KRAS mutation rate is quite
low in Asian patients, more data are needed to clarify
this issue. Regarding EGFR mutations, the reported
results have varied among different studies. According
to Hu and colleagues, STAS is frequently observed in
tumors with EGFR mutations [7], whereas three other
studies demonstrated that STAS was associated with
wild-type EGFR [19–21]. In contrast, in some studies, no
correlation was observed between STAS and EGFR [22–
24]. In the current study, STAS was observed to be
associated with wild-type EGFR. One possible explanation for the different frequencies of STAS based on different driver gene alterations could be that STAS is
more frequently observed in poorly differentiated tumors
including those with a solid/micropapillary pattern [25],
and ALK or ROS1 rearrangements mainly exist in ADC
with a predominant solid pattern [1, 26]. In contrast,
STAS is also associated with a non-lepidic pattern [1, 7,
19, 20], whereas EGFR mutations were more frequently
detected in ADC with lepidic growth [25].
The association between STAS and the expression of
immunohistochemical markers was barely understood
and the correlation between STAS and EMT has been
poorly discussed. In ADC, positive STAS was reported
to be significantly associated with tumor stroma
metastasis-associated protein 1 expression levels [8] but
was not significantly correlated with programmed death
ligand 1, thyroid transcription factor 1, napsin, or CK7
expression, as well as Ki67 activity [19, 22, 23]. In the
present study, STAS was found to be associated with
lower E-cadherin and higher vimentin and Ki67 expression. In SQCC, previous reports concluded that STAS is
associated with an increased tendency for high vimentin
Jia et al. BMC Cancer
(2020) 20:705
Page 8 of 11
Fig. 2 Kaplan–Meier curves according to spread through air spaces (STAS) in all-stage lung adenocarcinoma (ADC) and squamous cell carcinoma
(SQCC). a: Disease-free survival (DFS) in ADC (p < 0.001); b: Overall survival (OS) in ADC (p = 0.025); c: DFS in SQCC (p = 0.795); d: OS in
SQCC (p = 0.050)
Table 5 Multivariate Cox analysis of DFS and OS in ADC
Parameters
DFS
OS
p
HR (95% CI)
p
HR (95% CI)
Age
> 65 vs. ≤65
–
–
0.009
2.637 (1.275–5.455)
Tumor size
> 3 cm vs. ≤3 cm
0.137
1.383 (0.902–2.119)
–
–
Pleural invasion
Present vs. absent
0.022
1.729 (1.084–2.757)
0.158
1.878 (0.783–4.504)
Vascular invasion
Present vs. absent
–
–
0.459
1.341 (0.617–2.916)
Lymphatic invasion
Present vs. absent
0.388
1.259 (0.746–2.123)
0.289
1.792 (0.610–5.266)
STAS
Present vs. absent
0.002
2.460(1.398–4.327)
0.719
1.187 (0.466–3.026)
Pathological stage
III, IV vs. I, II
0.241
1.321 (0.830–2.102)
0.001
3.766 (1.710–8.296)
Jia et al. BMC Cancer
(2020) 20:705
Page 9 of 11
Fig. 3 Disease-free survival (DFS) according to spread through air spaces (STAS) in single-stage lung adenocarcinoma (ADC) cases. a: Stage I (p <
0.001); b: stage II (p = 0.007); c: stage IA (p = 0.009); d: stage IB (p = 0.025); e: stage IIA (p = 0.003)
and Ki67 expression in comparison with levels in patients without STAS; however, the expression of p53
and E-cadherin was not associated with the status of
STAS [16–18]. In the present study, STAS was
found to be associated with lower E-cadherin and
higher vimentin and survivin expression in the
SQCC cohort. These results indicate that STAS
might be more likely to be present in tumors exhibiting EMT features. EMT is a process by which epithelial cells transform into mesenchymal stem cells
by losing their cell polarity and cell-to-cell adhesion
and gaining migratory and invasive properties, and
this process has been identified as an indicator of
poor prognosis in non-small cell lung cancer [27].
Even though a relationship was found between the
presence of STAS and EMT features, whether STAS
cells underwent EMT remains unclear. According to
Yagi and colleagues [28], the survival of STAS cells
relies on blood vessel co-option, and these cells are
E-cadherin-positive. This result, to some extent,
challenged the opinion that STAS cells undergo
EMT. In agreement with previous reports, the
present results suggest that EMT might be a risk
factor but not a mechanism for STAS, as tumors
with EMT features were found to be more discohesive with fewer intercellular adhesions; this, it would
be easier for the malignant cells to detach from the
main tumor.
Our study had some limitations. On one hand,
some early-stage patients in the present study received limited resection, and some patients with latestage tumors received adjuvant therapy. These conditions might have influenced the prognosis and could
affect the results of survival analysis. On the other
hand, the sample size involved in the present study
was small, especially for SQCC, and the patients were
from one single institution.
Conclusions
STAS is a risk factor for poor DFS and OS in lung ADC,
and this significance mainly exists for early-stage (I-II)
ADC cases. STAS is also associated with poor DFS for
single-stage I, II, IA, IB, and IIA ADC patients. In
SQCC, STAS-positive patients tended to have a poorer
OS. Patients with STAS are more likely to harbor wildtype EGFR and rearranged ALK or ROS1. In both ADC
and SQCC, STAS-positive tumors frequently showed
EMT features. Our findings provide a better understanding of the implications of STAS with respect to
clinicopathologic features, molecular characteristics, immunohistochemical expression, and prognosis in ADC
and SQCC patients.
Jia et al. BMC Cancer
(2020) 20:705
Supplementary information
Page 10 of 11
2.
Supplementary information accompanies this paper at />1186/s12885-020-07200-w.
3.
Additional file 1: Supplementary Table 1. Primary antibodies used
for immunohistochemistry
Additional file 2: Supplementary Table 2. Univariate survival analysis
of DFS and OS in SQCC.
4.
Additional file 3: Supplementary Table 3. Univariate survival analysis
of DFS and OS in single stage ADC.
Additional file 4: Supplementary Table 4. Multivariate Cox analysis of
DFS in single stage ADC.
Abbreviations
ADC: Adenocarcinoma; AJCC: American Joint Committee on Cancer;
ALK: anaplastic lymphoma kinase; CI: Confidence interval; DFS: Disease-free
survival; EGFR: Epidermal growth factor receptor; EMT: Epithelial–
mesenchymal transition; HR: Hazard ratio; KRAS: Kirsten rat sarcoma viral
oncogene homolog; MIA: Minimally invasive adenocarcinoma; OS: Overall
survival; p-stage: Pathological stage; ROS1: ROS proto-oncogene 1, receptor
tyrosine kinase; SQCC: Squamous cell carcinoma; STAS: Spread through air
spaces; UICC: Union for International Cancer Control; WHO: World Health
Organization
5.
6.
7.
8.
Acknowledgements
Not applicable.
Authors’ contributions
MJ: investigation, formal analysis, writing - original draft; SLY: formal analysis;
JQY: resources; YML: resources; HWG: project administration, writing - review
& editing, funding acquisition; PLS: conceptualization, writing - review &
editing, project administration, funding acquisition. All authors read and
approved the final manuscript.
Funding
This work was supported by Science and Technology of Jilin Province, Jilin
Province Key Laboratory (3D517K363429); The Role and Molecular
Mechanism of EMT in the Resistance of ROS1-positive Lung Cancer
(20180101014JC/3D518PS23429); Jilin Province Department of Finance Project (3D5197398429); Jilin Province Department of Finance Project
(3D5197464429); and Youth Program of National Natural Science Foundation
of China (3A4197642429). The research fund was used for data collection
and immunohistochemical staining.
Availability of data and materials
The datasets used and/or analysed during the current study are available
from the corresponding author on reasonable request.
9.
10.
11.
12.
13.
Ethics approval and consent to participate
This study was approved by the ethics committee of The Second Hospital of
Jilin University (2018–066). Written informed consent was also obtained from
all patients.
14.
Consent for publication
Not applicable.
15.
Competing interests
The authors declare that they have no competing interests.
16.
Received: 4 February 2020 Accepted: 21 July 2020
17.
References
1. Kadota K, Nitadori J, Sima CS, Ujiie H, Rizk NP, Jones DR, Adusumilli PS,
Travis WD. Tumor spread through air spaces is an important pattern of
invasion and impacts the frequency and location of recurrences after
limited resection for small stage I lung adenocarcinomas. J Thorac Oncol.
2015;10:806–14.
18.
Travis WD, Brambilla E, Burke AP, Marx A, Nicholson AG. WHO classification
of Tumours of the lung, pleura, Thymus and heart. 4th ed. Lyon: IARC Press;
2015.
Rami-Porta R, Bolejack V, Crowley J, Ball D, Kim J, Lyons G, Rice T, Suzuki K,
Thomas CF Jr, Travis WD, Wu YL. The IASLC lung Cancer staging project:
proposals for the revisions of the T descriptors in the forthcoming eighth
edition of the TNM classification for lung Cancer. J Thorac Oncol. 2015;10:
990–1003.
Sun PL, Jin Y, Kim H, Seo AN, Jheon S, Lee CT, Chung JH. Survivin
expression is an independent poor prognostic marker in lung
adenocarcinoma but not in squamous cell carcinoma. Virchows Arch. 2013;
463:427–36.
Kim H, Yoo SB, Choe JY, Paik JH, Xu X, Nitta H, Zhang W, Grogan TM, Lee
CT, Jheon S, Chung JH. Detection of ALK gene rearrangement in non-small
cell lung cancer: a comparison of fluorescence in situ hybridization and
chromogenic in situ hybridization with correlation of ALK protein
expression. J Thorac Oncol. 2011;6:1359–66.
Jin Y, Sun PL, Park SY, Kim H, Park E, Kim G, Cho S, Kim K, Lee CT, Chung JH.
Frequent aerogenous spread with decreased E-cadherin expression of
ROS1-rearranged lung cancer predicts poor disease-free survival. Lung
Cancer. 2015;89:343–9.
Hu SY, Hsieh MS, Hsu HH, Tsai TM, Chiang XH, Tsou KC, Liao HC, Lin MW,
Chen JS. Correlation of tumor spread through air spaces and
clinicopathological characteristics in surgically resected lung
adenocarcinomas. Lung Cancer. 2018;126:189–93.
Liu Y, Chen D, Qiu X, Duan S, Zhang Y, Li F, Chen C, Zhou Y, Chen Y.
Relationship between MTA1 and spread through air space and their joint
influence on prognosis of patients with stage I-III lung adenocarcinoma.
Lung Cancer. 2018;124:211–8.
Yang L, Yang Y, Ma P, Zheng B, Liu W, Zhang Z, Ding N, Liu L, Mao Y, Lv N.
Spread through air spaces predicts a worse survival in patients with stage I
adenocarcinomas >2 cm after radical lobectomy. J Thorac Dis. 2018;10:
5308–17.
Bains S, Eguchi T, Warth A, Yeh YC, Nitadori JI, Woo KM, Chou TY,
Dienemann H, Muley T, Nakajima J, Shinozaki-Ushiku A, Wu YC, Lu S, Kadota
K, Jones DR, Travis WD, Tan KS, Adusumilli PS. Procedure-specific risk
prediction for recurrence in patients undergoing lobectomy or sublobar
resection for small (analysis. J Thorac Oncol. 2019;14:72–86.
Eguchi T, Kameda K, Lu S, Bott MJ, Tan KS, Montecalvo J, Chang JC,
Rekhtman N, Jones DR, Travis WD, Adusumilli PS. Lobectomy is associated
with better outcomes than sublobar resection in spread through air spaces
(STAS)-positive T1 lung adenocarcinoma: a propensity score-matched
analysis. J Thorac Oncol. 2019;14:87–98.
Kadota K, Kushida Y, Kagawa S, Ishikawa R, Ibuki E, Inoue K, Go T, Yokomise
H, Ishii T, Kadowaki N, Haba R. Limited resection is associated with a higher
risk of Locoregional recurrence than lobectomy in stage I lung
adenocarcinoma with tumor spread through air spaces. Am J Surg Pathol.
2019;43:1033–41.
Qiu X, Chen D, Liu Y, Duan S, Zhang F, Zhang Y, Li F, Chen C, Chen Y.
Relationship between stromal cells and tumor spread through air spaces in
lung adenocarcinoma. Thorac Cancer. 2019;10:256–67.
Ren Y, Xie H, Dai C, She Y, Su H, Xie D, Zheng H, Zhang L, Jiang G, Wu C,
Chen C. Prognostic impact of tumor spread through air spaces in sublobar
resection for 1A lung adenocarcinoma patients. Ann Surg Oncol. 2019;26:
1901–8.
Terada Y, Takahashi T, Morita S, Kashiwabara K, Nagayama K, Nitadori JI,
Anraku M, Sato M, Shinozaki-Ushiku A, Nakajima J. Spread through air
spaces is an independent predictor of recurrence in stage III (N2) lung
adenocarcinoma. Interact Cardiovasc Thorac Surg. 2019;29:442–8.
Yanagawa N, Shiono S, Endo M, Ogata SY. Tumor spread through air spaces
is a useful predictor of recurrence and prognosis in stage I lung squamous
cell carcinoma, but not in stage II and III. Lung Cancer. 2018;120:14–21.
Kadota K, Kushida Y, Katsuki N, Ishikawa R, Ibuki E, Motoyama M, Nii K,
Yokomise H, Bandoh S, Haba R. Tumor spread through air spaces is an
independent predictor of recurrence-free survival in patients with resected
lung squamous cell carcinoma. Am J Surg Pathol. 2017;41:1077–86.
Lu S, Tan KS, Kadota K, Eguchi T, Bains S, Rekhtman N, Adusumilli PS, Travis
WD. Spread through air spaces (STAS) is an independent predictor of
recurrence and lung Cancer-specific death in squamous cell carcinoma. J
Thorac Oncol. 2017;12:223–34.
Jia et al. BMC Cancer
(2020) 20:705
19. Warth A, Muley T, Kossakowski CA, Goeppert B, Schirmacher P, Dienemann
H, Weichert W. Prognostic impact of intra-alveolar tumor spread in
pulmonary adenocarcinoma. Am J Surg Pathol. 2015;39:793–801.
20. Lee JS, Kim EK, Kim M, Shim HS. Genetic and clinicopathologic
characteristics of lung adenocarcinoma with tumor spread through air
spaces. Lung Cancer. 2018;123:121–6.
21. Kim SK, Kim TJ. Lung adenocarcinoma: CT features associated with spread
through air spaces. Radiology. 2018;289:831–40.
22. Toyokawa G, Yamada Y, Tagawa T, Kinoshita F, Kozuma Y, Matsubara T,
Haratake N, Takamori S, Akamine T, Hirai F, Oda Y, Maehara Y. Significance
of spread through air spaces in resected lung adenocarcinomas with lymph
node metastasis. Clin Lung Cancer. 2018;19:395–400 e1.
23. Toyokawa G, Yamada Y, Tagawa T, Kozuma Y, Matsubara T, Haratake N,
Takamori S, Akamine T, Oda Y, Maehara Y. Significance of spread through
air spaces in resected pathological stage I lung adenocarcinoma. Ann
Thorac Surg. 2018;105:1655–63.
24. Toyokawa G, Yamada Y, Tagawa T, Oda Y. Significance of spread through air
spaces in early-stage lung adenocarcinomas undergoing limited resection.
Thorac Cancer. 2018;9:1255–61.
25. Kim J, Jang SJ, Choi CM, Ro JY. Correlation of histologic subtypes and
molecular alterations in pulmonary adenocarcinoma: therapeutic and
prognostic implications. Adv Anat Pathol. 2016;23:330–8.
26. Masai K, Sakurai H, Sukeda A, Suzuki S, Asakura K, Nakagawa K, Asamura H,
Watanabe SI, Motoi N, Hiraoka N. Prognostic impact of margin distance and
tumor spread through air spaces in limited resection for primary lung
Cancer. J Thorac Oncol. 2017;12:1788–97.
27. Tsoukalas N, Aravantinou-Fatorou E, Tolia M, Giaginis C, Galanopoulos M,
Kiakou M, Kostakis ID, Dana E, Vamvakaris I, Korogiannos A, Tsiambas E,
Salemis N, Kyrgias G, Karameris A, Theocharis S. Epithelial-Mesenchymal
transition in non small-cell lung Cancer. Anticancer Res. 2017;37:1773–8.
28. Yagi Y, Aly R, Tabata K, Rekhtman N, Eguchi T, Montecalvo J, Manova K,
Adusumilli P, Hameed M, Travis W. OA03.07 Three-Dimensional
Immunofluorescence Analysis of Dynamic Vessel Co-Option of Spread
Through Air Spaces (STAS) in Lung Cancer. J Thorac Oncol. 2018;13:S327.
Publisher’s Note
Springer Nature remains neutral with regard to jurisdictional claims in
published maps and institutional affiliations.
Page 11 of 11