Proteomic characterization of paired nonmalignant and malignant African-American prostate epithelial cell lines distinguishes them by structural proteins
Bạn đang xem bản rút gọn của tài liệu. Xem và tải ngay bản đầy đủ của tài liệu tại đây (1.81 MB, 18 trang )
Myers et al. BMC Cancer (2017) 17:480
DOI 10.1186/s12885-017-3462-7
RESEARCH ARTICLE
Open Access
Proteomic characterization of paired nonmalignant and malignant African-American
prostate epithelial cell lines distinguishes
them by structural proteins
Jennifer S. Myers1, Karin A. Vallega1, Jason White2, Kaixian Yu3, Clayton C. Yates2 and Qing-Xiang Amy Sang1*
Abstract
Background: While many factors may contribute to the higher prostate cancer incidence and mortality experienced
by African-American men compared to their counterparts, the contribution of tumor biology is underexplored
due to inadequate availability of African-American patient-derived cell lines and specimens. Here, we characterize
the proteomes of non-malignant RC-77 N/E and malignant RC-77 T/E prostate epithelial cell lines previously established
from prostate specimens from the same African-American patient with early stage primary prostate cancer.
Methods: In this comparative proteomic analysis of RC-77 N/E and RC-77 T/E cells, differentially expressed proteins
were identified and analyzed for overrepresentation of PANTHER protein classes, Gene Ontology annotations, and
pathways. The enrichment of gene sets and pathway significance were assessed using Gene Set Enrichment Analysis
and Signaling Pathway Impact Analysis, respectively. The gene and protein expression data of age- and stage-matched
prostate cancer specimens from The Cancer Genome Atlas were analyzed.
Results: Structural and cytoskeletal proteins were differentially expressed and statistically overrepresented between
RC-77 N/E and RC-77 T/E cells. Beta-catenin, alpha-actinin-1, and filamin-A were upregulated in the tumorigenic
RC-77 T/E cells, while integrin beta-1, integrin alpha-6, caveolin-1, laminin subunit gamma-2, and CD44 antigen
were downregulated. The increased protein level of beta-catenin and the reduction of caveolin-1 protein level in
the tumorigenic RC-77 T/E cells mirrored the upregulation of beta-catenin mRNA and downregulation of caveolin-1
mRNA in African-American prostate cancer specimens compared to non-malignant controls. After subtracting
race-specific non-malignant RNA expression, beta-catenin and caveolin-1 mRNA expression levels were higher in
African-American prostate cancer specimens than in Caucasian-American specimens. The “ECM-Receptor Interaction”
and “Cell Adhesion Molecules”, and the “Tight Junction” and “Adherens Junction” pathways contained proteins are
associated with RC-77 N/E and RC-77 T/E cells, respectively.
Conclusions: Our results suggest RC-77 T/E and RC-77 N/E cell lines can be distinguished by differentially expressed
structural and cytoskeletal proteins, which appeared in several pathways across multiple analyses. Our results indicate
that the expression of beta-catenin and caveolin-1 may be prostate cancer- and race-specific. Although the RC-77 cell
model may not be representative of all African-American prostate cancer due to tumor heterogeneity, it is a unique
resource for studying prostate cancer initiation and progression.
Keywords: Prostate cancer, RC-77 T/E, African-American cell line model, Comparative proteomics, Differentially
expressed proteins, Cancer health disparity, Beta-catenin, Caveolin-1, Integrins
* Correspondence:
1
Department of Chemistry and Biochemistry and Institute of Molecular
Biophysics, Florida State University, 95 Chieftan Way, Tallahassee, FL
32306-4390, USA
Full list of author information is available at the end of the article
© The Author(s). 2017 Open Access This article is distributed under the terms of the Creative Commons Attribution 4.0
International License ( which permits unrestricted use, distribution, and
reproduction in any medium, provided you give appropriate credit to the original author(s) and the source, provide a link to
the Creative Commons license, and indicate if changes were made. The Creative Commons Public Domain Dedication waiver
( applies to the data made available in this article, unless otherwise stated.
Myers et al. BMC Cancer (2017) 17:480
Background
Prostate cancer continues to be a substantial burden in
the American population. It remains the second leading
cause of cancer death among American men, and
model-based estimates continue to predict prostate cancer
to be most frequently diagnosed among new cancer cases
in American men [1]. Prostate cancer is particularly intriguing because of the striking racial health disparity
between African-American and Caucasian-American
patients. In the most recent data, African-American
men have had the highest prostate cancer incidence
and mortality of any race and ethnicity in the United
States [1]. Race is a significant risk factor for prostate
cancer: African-American men are more likely to receive a
prostate cancer diagnosis, with a reported incidence rate
between 1.5 and 1.86 times higher in African-American
men than in Caucasian-American men [1–3]. AfricanAmerican men are also more likely to receive that
diagnosis at a younger age, 3 years younger than
Caucasian-American men [4, 5]. Furthermore, prostate
cancer mortality is twice as high in African-American
men compared to Caucasian-American men [1, 6].
Prostate cancer racial disparities between AfricanAmerican and Caucasian-American patients often reflect
more advanced or aggressive cancer in African-American
men. African-American men present with higher grade tumors, report more treatment-related side effects, and have
shorter progression-free survival [5]. Men with high-risk
prostate cancer were more likely to be African-American,
even in patients with low prostate-specific antigen
levels [7]. Tumor volumes were reported to be larger in
African-American men compared to matched CaucasianAmerican specimens [8]. Higher Gleason scores and
cancer volumes were also reported in African-American
men compared to Caucasian-Americans [9]. Gene and
microRNA profiling of African-American and CaucasianAmerican tumor tissue have demonstrated racial variation
[10–17]. In light of this, it is increasingly important to
study prostate cancer in the context of race, as tumor
characteristics have been shown to vary by race. Although socioeconomic factors, treatment choices, comorbidities, and quality of medical care factor into
higher incidence and mortality rates, increased prostate
cancer-specific mortality is largely attributed to tumor
characteristics [18].
One approach to exploring the mechanisms of prostate cancer development and progression is the use of
prostate cancer-derived cell lines as in vitro models of
the disease. PC-3, DU145, and LNCaP cell lines are
popular, well-established, and well-characterized prostate
cancer research models [19–21]. The gene and protein
expression profiles of these cell lines and their derivatives have also been outlined [19–25]. According to
American Type Culture Collection data sheets, PC-3,
Page 2 of 18
DU145, and LNCaP cell lines were established from
Caucasian prostate cancer patients aged 59 to 69 years
old. The PC-3 cell line was established from a prostatic
adenocarcinoma metastatic to bone, and PC-3 cells have
features common to neoplastic cells and do not respond
to androgen [23]. The DU145 cell line was established
from a brain metastasis of human prostate carcinoma,
and DU145 cells do not express androgen receptors
[19, 21]. The LNCaP cell line was established from a
supraclavicular lymph node metastatic lesion of prostate adenocarcinoma. While LNCaP cells express androgen receptors and grow in response to androgen,
they lose this requirement for growth in later passages
[23]. Cell lines derived from non-African-American
backgrounds may be less beneficial in providing an
understanding of the factors leading to high prostate
cancer risk in African-American men. They may also
be inadequate for explaining the aggressiveness of
prostate cancer in African-American men. However,
few prostate cancer models have been established from
African-American patients. E006AA is an epithelial
cell line with low tumorigenicity derived from cancerous tissue of an African-American patient diagnosed
with clinically localized T2aN0M0 prostate cancer
[26]. Another cell line, E006AA-hT, which was derived
from E006AA cells, is highly tumorigenic [27]. The
non-neoplastic RC-165 N cell line was derived from
benign tissue of an African-American patient and immortalized by telomerase [28]. MDA PCa 2a and
MDA PCA 2b cell lines were derived from a bone metastasis of an androgen-independent cancer from an
African-American patient [29]. These cell lines are
tumorigenic but have deviated from the androgen insensitive phenotype from which they were derived
(i.e., the cells behave differently in vivo and in vitro).
None of the above-mentioned models is a malignant
and non-malignant pair.
The human malignant and non-malignant immortalized prostate epithelial cell lines RC-77 T/E and RC77 N/E were established previously from prostate tissue
from an African-American patient [30]. This primary
tumor was a stage T3c poorly differentiated adenocarcinoma of Gleason score 7. RC-77 cell lines have epithelial character, have functioning androgen receptors, are
immortalized, and form a malignant and non-malignant
pair. There are few studies on RC-77 cell lines. To date,
the RC-77 cell lines have been characterized in terms of
miRNA expression, ATP-binding cassette sub-family D
member 3 (ABCD3) gene expression, roundabout homolog 1 (ROBO1) mRNA and protein expression, and B
lymphoma Mo-MLV insertion region 1 homolog (BMI1)
protein levels [17, 31–34]. This work is the only comprehensive proteomic characterization of RC-77 T/E and
RC-77 N/E cell lines.
Myers et al. BMC Cancer (2017) 17:480
Methods
Cell culture and lysis
Both RC-77 N/E and RC-77 T/E cell lines were cultured
in Keratinocyte–SFM medium supplemented with bovine pituitary extract and recombinant epidermal growth
factor (Life Technologies, Inc., Gaithersburg, MD) in a
fully humidified incubator containing 95% air and 5%
CO2 at 37 °C. After aspirating culture medium, cells
were washed twice with phosphate-buffered saline. The
washed cells were collected and lysed on ice for 10 min
in NP-40 lysis buffer (50 mM Tris-HCl pH 7.2; 150 mM
NaCl; 1% Triton X-100; 0.1% sodium dodecyl sulfate;
0.2% sodium deoxycholate in water) containing an
EDTA-free protease and phosphatase inhibitor cocktail
(Thermo-Pierce, Rockford, IL) at a ratio of 20 μL buffer/
500,000 cells. Cell lysates were spun at 14,000 rpm at
4 °C for 10 min. The supernatant was collected and the
pellet discarded.
Page 3 of 18
a built-in R function. Differentially expressed proteins
(DEPs) were defined as those proteins whose mean spectral count differed between the two comparison sets with
at least 90% confidence after adjusting for the false discovery rate using the Benjamini-Hochberg function. Next,
fold changes in protein expression levels between RC77 T/E and RC-77 N/E cell lines were calculated by taking
the base 2 logarithm (log2) of the ratio of the mean spectral count of RC-77 T/E samples to the mean spectral
count of RC-77 N/E samples. In this way, proteins downregulated in RC-77 T/E showed negative fold changes,
whereas proteins upregulated in RC-77 T/E showed positive fold changes. For samples with zero means, the data
was transformed by adding one to both means, which did
not substantially affect the results of downstream analysis.
A MA plot was constructed to confirm that variance
remained stable (see Additional file 2).
Overrepresentation analysis
Mass spectrometry
Cell lysates were desalted on Zeba™ Desalt Spin Columns
(Thermo-Pierce, Rockford, IL). Using a ProteoExtract™
All-in-One Trypsin Digestion Kit (Calbiochem, Darmstadt,
Germany), vacuum-dried cell lysates were re-suspended,
and proteins were extracted into a mass spectrometrycompatible buffer then digested with trypsin. Protein
expression was analyzed by high-resolution electrospray tandem mass spectrometry (MS/MS) with an externally calibrated Thermo LTQ Orbitrap Velos mass
spectrometer. For each of three biological replicates,
nanospray liquid chromatography-MS/MS was run in
technical triplicate, and all measurements were performed
at room temperature. Technical details of the mass spectrometry analyses can be found in the Additional Files (see
Additional file 1). The threshold for peptide identification
was set at 95% confidence and the stringency for protein
identification was set at 99% confidence with at least 2
peptide matches.
Data processing and analysis
Protein expression data was captured in the form of
spectral counts, and any non-integer values were rounded
up to the nearest whole integer. Each identified protein
was mapped to a single gene symbol and Entrez ID. For
protein isoforms, expression counts were summed to generate a single dataset for each gene. Such 1:1 mapping was
required in downstream analyses. The R programming environment (version 3.2.1) [35] was used to process the
spectral count data as described above, to perform statistical calculations, and to plot data. Differential protein expression between RC-77 T/E and RC-77 N/E cell lines
was assessed using the processed spectral count data by
an unpaired Wilcoxon rank-sum test with an applied continuity correction and two-sided alternative hypothesis via
To reveal any patterns in the classes or functions of
proteins differentially expressed between RC-77 T/E
and RC-77 N/E cell lines, DEPs were subjected to overrepresentation analysis using Protein ANalysis THrough
Evolutionary Relationships (PANTHER) analysis tools
[36]. The list of DEPs was loaded into the PANTHER
Classification System data analysis tool (version 11.1),
which sorted the DEPs by PANTHER protein class and
Gene Ontology (GO) annotations. Using the same list of
DEPs, the PANTHER statistical overrepresentation tool
(release 20,161,024) was used to assess the probability that
the number of DEPs belonging to each protein class or
GO category was greater than the number expected in
each category picked at random based on a reference
human genome. Additionally, the overrepresentation of
entire pathways among DEPs was assessed using the
National Cancer Institute-Nature Pathway Interaction
Database [37]. The list of DEPs was uploaded and
searched against this database, and the overrepresentation
of pathways was calculated, adjusting probabilities for
multiple-hypotheses testing. To determine if the results
obtained for DEPs were due to random chance, the same
overrepresentation analyses were conducted for 1000 random sets containing the same number of proteins as DEPs
sampled from the remaining non-differentially expressed
proteins and from the total number of identified proteins
detected by mass spectrometry.
Gene set enrichment analysis
Gene Set Enrichment Analysis (GSEA) (version 2.2.0),
which is a type of correlation analysis that uses expression
data to associate gene sets with a particular phenotype
[38], was used to identify groups of genes associated with
either RC-77 T/E or RC-77 N/E cells. So as not to bias
against small changes in expression, the processed protein
Myers et al. BMC Cancer (2017) 17:480
spectral count data were inputted into the software without filtering for differential expression, and the log2 fold
change was ignored. Proteins that could not be mapped to
an Entrez ID were excluded from this analysis. Gene sets
containing a minimum of 5 genes and up to a maximum
of 500 genes were pulled from BioCarta and Reactome
databases (downloaded from the GSEA’s Molecular Signatures Database, version 5) and from a customized
database of relevant KEGG (Kyoto Encyclopedia of
Genes and Genomes) pathways (see Additional file 3).
The GSEA software interrogated each gene set against
a list of the protein data ranked by correlation to RC77 T/E or RC-77 N/E samples to determine which proteins from the ranked list appeared in a given pathway and
whether they were randomly distributed or clustered
among a phenotype. Enrichment (relative to RC-77 N/E)
was based on the number of highly correlated genes from
the ranked list that appeared in the pathway with a chosen
FDR cut-off of q < 0.25.
Signaling pathway impact analysis
Signaling Pathway Impact Analysis (SPIA) was used to
provide a system-level assessment of pathway significance by incorporating overrepresentation, a function of
differential expression and the magnitude of expression
change (as a log2 ratio), and topology, the position of the
protein in a pathway [39]. Pathway topology is important
because it distinguishes genes or proteins that may be at
trigger, regulatory, divergent, or end positions. SPIA was
completed using the “SPIA” R package (version 2.18.0).
The processed protein spectral count data including the
results of the differential expression analysis and log2
fold changes were uploaded. Proteins that could not be
mapped to an Entrez ID were excluded from this analysis. The threshold for differential expression was set to
q < 0.1. The same relevant KEGG pathways used in
GSEA were used for SPIA (see Additional file 3). KEGG
pathways were chosen because they contain information
about pathway topology. SPIA calculated the overrepresentation and perturbation probabilities and combined them
into a global probability that a pathway was activated or
inhibited in RC-77 T/E cells. The overrepresentation probability reflects the likelihood the number of DEPs observed
in a pathway was larger than that observed by random
chance. The perturbation probability reflects whether the
positions of DEPs in a particular pathway were at crucial
junctions that could perturb the pathway. The false discovery rate-adjusted global probability was the metric used to
rank the significance of the pathways.
Analysis of DEPs relevance in human prostate cancer
patient specimens
Using The Cancer Genome Atlas (TCGA) prostate
adenocarcinoma (PRAD) cohort, a dataset of 12 age-
Page 4 of 18
and stage-matched African-American and CaucasianAmerican specimen pairs (24 specimens total) was created. These specimen pairs were used to investigate how
the protein and RNA expression of the 63 DEPs differed
by race. To generate the dataset, TCGA protein data was
downloaded from CBioportal, and TCGA RNA expression
data was downloaded from FireBrowse.org. Both are repositories for TCGA data. The protein data available from
the TCGA PRAD cohort was obtained via Reverse Phase
Protein Array and was limited to 219 proteins. TCGA
RNA expression data was obtained through Illumina
HiSeq (RNA sequencing) and comprised over 20,000 gene
transcripts. Only DEPs present in both datasets were carried forward for further analysis. Because the RC-77 T/E
cell line was generated from an early stage primary tumor,
only tumors with a Gleason score of 6 or 7 were included
(see Additional file 4). Data frames of extracted protein
and RNA expression data were created with Microsoft
Excel.
Because protein data for non-malignant PRAD specimens was not available in TCGA data and non-malignant
PRAD tissue was not collected from all patients, direct
tumor-to-non-malignant comparisons could not be performed. In order to compare expression distributions, the
average of the race-specific non-malignant PRAD RNA
expression was subtracted from the age- and stagematched tumor specimens (see Additional file 4). Of the
499 individuals in TCGA PRAD patient cohort, 51 had
non-malignant PRAD tissue RNA expression data. After
filtering for Gleason score (≤ 7), 34 (4 African-American
and 30 Caucasian-American) non-malignant prostate
tissue specimens were included in the non-malignantexpression-normalized analysis (see Additional file 4).
The statistical significance of differences between African-American and Caucasian-American patient specimens
were analyzed using the “t.test” function in R.
Results
Overall, 843 proteins were identified by mass spectrometry, and 833 proteins remained in the dataset after processing to consolidate isoforms (see Additional files 5
and 6, respectively). These 833 proteins formed the dataset used in GSEA and SPIA analysis. Between RC-77 T/
E and RC-77 N/E cell lines, 744 proteins were shared, 74
proteins were detected in RC-77 T/E cells but not RC77 N/E cells, and 15 proteins were detected in RC-77 N/
E but not RC-77 T/E cells. In total, expression levels of
200 proteins varied between RC-77 T/E and RC-77 N/E
cells (p < 0.05, Wilcoxon rank-sum test); but after correcting for the false-discovery rate, only 63 proteins
retained significance (q < 0.1). These 63 proteins formed
the list of DEPs: 17 proteins downregulated in RC-77 T/
E cells and 46 proteins upregulated in RC-77 T/E cells
(Table 1). A full listing of protein expression changes
Myers et al. BMC Cancer (2017) 17:480
Page 5 of 18
Table 1 Differentially expressed proteins between RC-77 T/E and RC-77 N/E cell lines
Identified Proteins (Gene Symbol)
p-value
CD166 antigen (ALCAM)
5.90E-04 4.91E-02 −2.12
Downregulated
*Caveolin-1 (CAV1)
2.98E-04 4.91E-02 −1.72
Downregulated
*Vimentin (VIM)
4.09E-04 4.91E-02 −1.61
Downregulated
q-value
Log2 Fold Status in RC-77 T/E Cells Significant Pathway or Gene Set
Change
Involvement
*Myosin heavy chain-9 (MYH9)
4.04E-04 4.91E-02 1.58
Upregulated
SH3 domain-binding glutamic
acid-rich-like protein 3 (SH3BGRL3)
2.68E-04 4.91E-02 2.70
Upregulated
Eukaryotic translation initiation
factor 4B (EIF4B)
5.78E-04 4.91E-02 2.77
Upregulated
Calpastatin (CAST)
3.55E-04 4.91E-02 3.09
Upregulated
Nucleolar RNA helicase 2 (DDX21)
4.16E-04 4.91E-02 3.20
Upregulated
Focal Adhesion; Proteoglycans in Cancer
Creatine kinase U-type (CKMT1A)
3.36E-04 4.91E-02 3.46
Upregulated
Thioredoxin domain-containing
protein 17 (TXNDC17)
4.92E-04 4.91E-02 1.69
RC-77 T/E only
*Type I cytoskeletal keratin 19 (KRT19)
7.77E-04 5.40E-02 −2.49
Downregulated
Serotransferrin (TF)
7.29E-04 5.40E-02 −2.30
Downregulated
Integrin alpha-6 (ITGA6)
1.44E-03 5.40E-02 −1.93
Downregulated
Cell Adhesion Molecules; ECM-Receptor
Interaction; Small Cell Lung Cancer
Laminin subunit gamma-2 (LAMC2)
9.86E-04 5.40E-02 −1.72
Downregulated
ECM-Receptor Interaction; Small Cell
Lung Cancer; Focal Adhesion
CD59 glycoprotein (CD59)
9.15E-04 5.40E-02 −1.65
Downregulated
Squalene synthase (FDFT1)
1.23E-03 5.40E-02 −1.31
Downregulated
*Filamin-A (FLNA)
1.06E-03 5.40E-02 1.21
Upregulated
Hydroxyacyl-coenzyme A dehydrogenase
(HADH)
1.61E-03 5.40E-02 1.22
Upregulated
X-ray repair cross-complementing protein
5 (XRCC5)
1.42E-03 5.40E-02 1.35
Upregulated
Prothymosin alpha (PTMA)
1.49E-03 5.40E-02 1.65
Upregulated
Cytosolic acyl coenzyme A thioester
hydrolase (ACOT7)
1.37E-03 5.40E-02 1.74
Upregulated
High mobility group protein HMG-I/HMG-Y
(HMGA1)
1.58E-03 5.40E-02 1.79
Upregulated
Putative pre-mRNA-splicing factor ATPdependent RNA helicase DHX15 (DHX15)
1.10E-03 5.40E-02 2.10
Upregulated
Scaffold attachment factor B1 (SAFB)
1.59E-03 5.40E-02 2.27
Upregulated
Nucleoprotein TPR (TPR)
1.62E-03 5.40E-02 3.52
Upregulated
Hemoglobin subunit alpha (HBA1)
1.80E-03 5.54E-02 −1.87
RC-77 N/E only
Protein PML (PML)
1.77E-03 5.54E-02 1.69
RC-77 T/E only
Ribosome-binding protein 1 (RRBP1)
1.89E-03 5.63E-02 1.64
Upregulated
Adenosylhomocysteinase (AHCY)
2.00E-03 5.75E-02 1.68
Upregulated
Gamma-interferon-inducible protein 16 (IFI16)
2.37E-03 6.59E-02 1.39
Upregulated
Phosphoenolpyruvate carboxykinase (PCK2)
2.51E-03 6.75E-02 3.04
Upregulated
14–3-3 protein sigma (SFN)
2.60E-03 6.76E-02 1.49
Upregulated
*Lamin-B1 (LMNB1)
3.04E-03 7.26E-02 −0.87
Downregulated
*Alpha-actinin-1 (ACTN1)
3.05E-03 7.26E-02 1.06
Upregulated
High mobility group protein HMGI-C (HMGA2) 2.95E-03 7.26E-02 2.19
Upregulated
Focal Adhesion, Proteoglycans in Cancer
Tight Junction; Adherens Junction;
Hippo Signaling Pathway; Focal Adhesion
Myers et al. BMC Cancer (2017) 17:480
Page 6 of 18
Table 1 Differentially expressed proteins between RC-77 T/E and RC-77 N/E cell lines (Continued)
Voltage-dependent anion-selective
channel protein 1 (VDAC1)
4.59E-03 7.67E-02 −1.00
Downregulated
Integrin beta-1 (ITGB1)
3.48E-03 7.67E-02 −0.92
Downregulated
Non-histone chromosomal protein
HMG-17 (HMGN2)
4.22E-03 7.67E-02 1.34
Upregulated
*PDZ and LIM domain protein 1 (PDLIM1)
4.40E-03 7.67E-02 1.61
Upregulated
T-complex protein 1 subunit epsilon (CCT5)
4.72E-03 7.67E-02 1.66
Upregulated
Aminopeptidase N (ANPEP)
5.25E-03 7.67E-02 −2.38
RC-77 N/E only
Prefoldin subunit 2 (PFDN2)
4.96E-03 7.67E-02 1.35
RC-77 T/E only
40S ribosomal protein S24 (RPS24)
4.96E-03 7.67E-02 1.35
RC-77 T/E only
Serine/arginine-rich splicing factor 1 (SRSF1)
4.96E-03 7.67E-02 1.35
RC-77 T/E only
S-formylglutathione hydrolase (ESD)
5.05E-03 7.67E-02 1.42
RC-77 T/E only
RNA-binding protein EWS (EWSR1)
5.15E-03 7.67E-02 1.47
RC-77 T/E only
Hepatoma-derived growth factor (HDGF)
5.15E-03 7.67E-02 1.47
RC-77 T/E only
Non-histone chromosomal protein
HMG-14 (HMGN1)
4.96E-03 7.67E-02 1.47
RC-77 T/E only
S-methyl-5′-thioadenosine
phosphorylase (MTAP)
4.96E-03 7.67E-02 1.47
RC-77 T/E only
Phosphoserine aminotransferase (PSAT1)
5.15E-03 7.67E-02 1.53
RC-77 T/E only
60S ribosomal protein L10 (RPL10)
4.99E-03 7.67E-02 1.53
RC-77 T/E only
Proteasome activator complex subunit
3 (PSME3)
5.22E-03 7.67E-02 1.58
RC-77 T/E only
40S ribosomal protein S11 (RPS11)
4.99E-03 7.67E-02 1.64
RC-77 T/E only
tRNA-splicing ligase RtcB homolog (RTCB)
5.25E-03 7.67E-02 1.64
RC-77 T/E only
Double-stranded RNA-specific adenosine
deaminase (ADAR)
5.25E-03 7.67E-02 1.92
RC-77 T/E only
Eukaryotic translation initiation factor 3
subunit I (EIF3I)
5.22E-03 7.67E-02 1.96
RC-77 T/E only
60S ribosomal protein L35 (RPL35)
5.18E-03 7.67E-02 2.08
RC-77 T/E only
Cytochrome c oxidase subunit 5A (COX5A)
5.74E-03 8.24E-02 −1.38
Downregulated
*Beta-catenin (CTNNB1)
5.93E-03 8.37E-02 1.40
Upregulated
*Type II cytoskeletal keratin 8 (KRT8)
6.14E-03 8.52E-02 −1.79
Downregulated
CD44 antigen (CD44)
6.44E-03 8.60E-02 −0.77
Downregulated
Plasminogen activator inhibitor 1
RNA-binding protein (SERBP1)
6.51E-03 8.60E-02 1.58
Upregulated
60S ribosomal protein L6 (RPL6)
6.38E-03 8.60E-02 2.14
Upregulated
Cell Adhesion Molecules; ECM-Receptor
Interaction; Small Cell Lung Cancer
Tight Junction; Adherens Junction;
Hippo Signaling Pathway;
Focal Adhesion
Proteoglycans in Cancer; ECM-Receptor
Interaction
*Carries a “Structural” or “Cytoskeletal” annotation in PANTHER. P-value is the probability the protein differs between RC-77 N/E and RC-77 T/E as calculated by an
unpaired Wilcoxon rank-sum test, and q-value is the probability adjusted for multiple hypotheses testing using the Benjamini-Hochberg method. The log2 fold
change was calculated using the RC-77 T/E to RC-77 N/E ratio. Significant pathway or gene set involvement reflects the results of Gene Set Enrichment Analysis
and Signaling Pathway Impact Analysis
between RC-77 N/E and RC-77 T/E cells is found in the
Additional files (see Additional file 6). The distribution
of log2 fold changes for all proteins was plotted in a 1-D
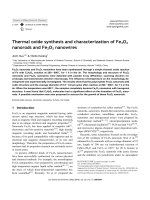
scatter plot (Fig. 1). DEPs tended to have greater than
two-fold changes in expression levels, and most log2
fold changes clustered around −2.0 and +1.5. The
reproducibility among biological replicates was good
(see Additional files 7 and 8).
Overrepresentation analysis
For each of the 63 DEPs, PANTHER protein class and GO
annotations were pulled from the PANTHER database,
Myers et al. BMC Cancer (2017) 17:480
Page 7 of 18
Fig. 1 Magnitude of protein expression changes between RC-77 T/E and RC-77 N/E cell lines. In this one-dimensional scatter plot, the magnitude
of protein expression changes is represented by log2 fold ratio. Red diamonds represent differentially expressed proteins. Black squares represent
other identified proteins that were not significantly different
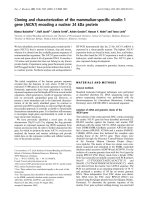
and the number of annotations in each category were
counted (Fig. 2). No annotations were found for 12 DEPs;
however, a pattern of nucleic acid binding and structural
proteins emerged among the annotations for the 51
remaining DEPs. “Nucleic Acid Binding” was the most
populated PANTHER protein class category with 15
DEPs, while 10 DEPs were classified as “Structural” and/or
“Cytoskeletal Proteins”, and another 6 DEPs were classified as hydrolases (Table 2). The remaining DEPs were
spread nearly evenly across 20 other categories (Fig. 2a).
When DEPs were sorted by GO Molecular Function notation (Fig. 2c), the “Binding” and “Catalytic Activity” GO
Molecular Function labels each covered over 40% (21 of
51 DEPs) of the annotated DEPs, and the “Structural Molecule Activity” label was also highly populated (13 of 51
DEPs) (Table 3). Overrepresentation analysis supported
the pattern of structural/cytoskeletal proteins among proteins differentially expressed between RC-77 T/E and RC77 N/E cells (Table 4). Only the “Cytoskeletal Protein”
PANTHER protein class category (q = 0.033) was statistically overrepresented among the DEPs compared to the reference human genome/proteome (20,814 genes/proteins).
Because structural and cytoskeletal proteins are highly
abundant, we verified the results of the enrichment and
overrepresentation of this protein class by comparing
the results to those obtained using an equivalent number
of randomly sampled proteins. We repeated the overrepresentation analysis on 1000 subsets of 63 proteins (the
number of DEPs identified) randomly sampled from the
770 non-differentially expressed proteins and from all
833 proteins identified by mass spectrometry compared
to the reference human genome/proteome. Among the
repeated sets of proteins pulled from the 770 non-DEPs,
structural/cytoskeletal proteins protein were significantly
overrepresented in only 2 sets; there were no sets from
the proteins sampled from all 833 proteins with significant overrepresentation of the structural/cytoskeletal
protein class (Table 4). Therefore, we conclude with high
probability (99.8%) that the overrepresentation of the
structural/cytoskeletal protein class among the 63 DEPs
is not by random chance. In contrast, many DEPs were
labeled with the “Catalytic Activity” GO Molecular
Function; however, enzyme protein classes were not
overrepresented according to the enrichment test and
were more frequent among the random samples. These
results verified that the differences between RC-77 T/E
and RC-77 N/E cell lines are specifically linked to
structural/cytoskeletal proteins because none of the
1000 random subsets of proteins from 770 non-DEPs
were enriched in structural proteins relative to the genome/
proteome.
There was a deviation from the pattern of structural/
cytoskeletal protein overrepresentation when DEPs were
analyzed by GO Biological Process annotations. Metabolic and cellular processes were the most common
GO Biological Process annotation, with 37 and 23 proteins, respectively (Fig. 2B and Table 5). The GO Biological Process category “Metabolic Process” encompasses
carbohydrate, lipid, protein, amino acid, and nucloeobasecontaining compound metabolism; and the GO Biological
Process term “Cellular Process” is an umbrella heading for
cell communication, cell cycle, cytokinesis, and cellular
component movement. The GO Biological Process categories “Biological Regulation”, “Developmental Process”,
and “Cellular Component Organization or Biogenesis”
were evenly populated (Fig. 2b).
In addition to grouping by PANTHER protein class or
GO annotations, pathway overrepresentation among the
DEPs was also assessed using the National Cancer
Institute-Nature Pathway Interaction Database. Again,
structural molecules featured prominently in these pathways, including integrin alpha-6, integrin beta-1, and
beta-catenin (Table 6).
Gene set enrichment analysis
Although overrepresentation analysis showed that structural proteins and pathways related to structural proteins
differed between RC-77 T/E and RC-77 N/E cells, this
Myers et al. BMC Cancer (2017) 17:480
Page 8 of 18
analysis did not link these differences directly to either
of the cell lines. GSEA identified groups of genes specifically associated with either RC-77 T/E or RC-77 N/E
cells. For this analysis, all protein data were used as the
input, not just data for the 63 DEPs. Multiple gene sets
were enriched in RC-77 T/E and RC-77 N/E cells (Table
7). A complete listing of GSEA results is presented in
the Additional files (see Additional file 9). An enriched
gene set contained a significant number of proteins
whose expression most correlated with either RC-77 T/E
or RC-77 N/E cells. The most significantly enriched gene
set in RC-77 T/E cells was the KEGG “Tight Junction”
gene set. Additionally, the KEGG “Adherens Junction”
gene set was highly enriched in RC-77 T/E cells. The
most significant gene set enriched in RC-77 N/E cells
was the KEGG “Cell Adhesion Molecules”, and the
KEGG “ECM-Receptor Interaction” gene set was also
highly enriched in RC-77 N/E cells. Interestingly, structural proteins contributed to the enrichment of each of
these gene sets in their respective cell lines. While
alpha-actinin-1 and beta-catenin were associated with
RC-77 T/E cells, integrin alpha-6, integrin beta-1, laminin subunit gamma-2, and CD166 antigen were associated with RC-77 N/E cells. These results corroborate the
overrepresentation of structural proteins in these cell
lines. Furthermore, this enrichment analysis differentiates which structural protein was associated with each
cell line.
Signaling pathway impact analysis
Fig. 2 Functional classification of differentially expressed proteins
between RC-77 T/E and RC-77 N/E cell lines. DEPs in RC-77 T/E and
RC-77 N/E cell lines were classified according to (A) PANTHER protein
class, (B) Biological Process Gene Ontology terms, and (C) Molecular
Function Gene Ontology terms. Note: No annotations were found for
12 DEPs (laminin subunit gamma-2, SH3 domain-binding glutamic
acid-rich-like protein 3, serine/arginine-rich splicing factor 1, CD44
antigen, tRNA-splicing ligase RtcB homolog, ribosome-binding protein
1, scaffold attachment factor B1, nucleoprotein TPR, integrin alpha-6,
protein PML, squalene synthase, and X-ray repair cross-complementing
protein 5). DEP = differentially expressed protein; PANTHER = PANTHER:
Protein ANalysis THrough Evolutionary Relationships
SPIA was conducted to address both the overrepresentation and pathway topology of DEPs to determine
whether the DEPs found in a pathway have a meaningful
impact within that pathway. SPIA differs from GSEA in
two key ways. First, it considers the magnitude of expression and establishes a difference in impact between
small and large fold changes. Second, by including a
measure of perturbation, SPIA more fully captures the
interactions of proteins, which can be lost in overrepresentation analyses and correlation analyses like GSEA.
Four KEGG pathways were significantly impacted in the
RC-77 T/E cell line: “Focal Adhesion” (false discovery
rate-adjusted global probability [pGFdr] = 0.00934),
“Small Cell Lung Cancer” (pGFdr = 0.0246), “Proteoglycans in Cancer” (pGFdr = 0.0246), and “ECM-Receptor
Interaction” (pGFdr = 0.0246) (Table 8). Based on the
expression pattern of the DEPs found in the pathway,
SPIA predicted these four pathways were inhibited in
RC-77 T/E cells. In corroboration, “ECM-Receptor
Interaction” and “Small Cell Lung Cancer” were
enriched in RC-77 N/E cells according to GSEA results.
Pathway images with DEPs highlighted can be found in
the full SPIA results presented in the Additional files
(see Additional file 10). Note that not all components of
Myers et al. BMC Cancer (2017) 17:480
Page 9 of 18
Table 2 Categorization of differentially expressed proteins according to PANTHER protein class
PANTHER Protein Class (Number of Differentially Expressed Proteins)
Nucleic Acid Binding Proteins (15)
• eukaryotic translation initiation factor 4B
• RNA-binding protein EWS
• high mobility group protein HMG-I/HMG-Y
• high mobility group protein HMGI-C
• non-histone chromosomal protein HMG-14
• non-histone chromosomal protein HMG-17
• 40S ribosomal protein S24
• nucleolar RNA helicase 2
• 60S ribosomal protein L35
• 60S ribosomal protein L6
• 40S ribosomal protein S11
• 60S ribosomal protein L10
• plasminogen activator inhibitor 1
RNA-binding protein
• putative pre-mRNA-splicing factor
ATP-dependent RNA helicase DHX15
• double-stranded RNA-specific adenosine deaminase
• beta-catenin
• filamin-A
• vimentin
• lamin-B1
• alpha-actinin-1
• caveolin-1
• PDZ and LIM domain protein 1
• type I cytoskeletal keratin 19
• type II cytoskeletal keratin 8
• serotransferrin
• aminopeptidase N
• adenosylhomocysteinase
• double-stranded RNA-specific adenosine
deaminase
• cytosolic acyl coenzyme A thioester hydrolase
• S-formylglutathione hydrolase
Structural and/or Cytoskeletal Proteins (10)
• myosin heavy chain-9
Hydrolases (6)
Table 3 Categorization of differentially expressed proteins according to Gene Ontology Molecular Function
Gene Ontology Molecular Function Annotation (Number of Differentially Expressed Proteins)
Binding Proteins (21)
• eukaryotic translation initiation factor 4B
• RNA-binding protein EWS
• high mobility group protein HMG-I/HMG-Y
• double-stranded RNA-specific adenosine
deaminase
• plasminogen activator inhibitor 1 RNA-binding protein
• non-histone chromosomal protein HMG-17
• alpha-actinin-1
• nucleolar RNA helicase 2
• 60S ribosomal protein L35
• hepatoma-derived growth factor
• gamma-interferon-inducible protein 16
• 60S ribosomal protein L10
• PDZ and LIM domain protein 1
• non-histone chromosomal protein HMG-14
• high mobility group protein HMGI-C
• caveolin-1
• calpastatin
• beta-catenin
• 60S ribosomal protein L6
• filamin-A
• myosin heavy chain-9
• serotransferrin
• aminopeptidase N
• calpastatin
• double-stranded RNA-specific adenosine
deaminase
• putative pre-mRNA-splicing factor ATP-dependent RNA • type I cytoskeletal high mobility group protein
helicase DHX15
HMG-I/HMG-Y
• cytosolic acyl coenzyme A thioester
hydrolase
• hydroxyacyl-coenzyme A dehydrogenase
• S-formylglutathione hydrolase
• phosphoenolpyruvate carboxykinase
• cytochrome c oxidase subunit 5A
• S-methyl-5′-thioadenosine phosphorylase
• creatine kinase U-type
• 60S ribosomal protein L35
• caveolin-1
• myosin heavy chain-9
• adenosylhomocysteinase
• nucleolar RNA helicase 2
• high mobility group protein HMGI-C
• phosphoserine aminotransferase
• RNA-binding protein EWS
• filamin-A
• 60S ribosomal protein L10
• 60S ribosomal protein L35
• Type I cytoskeletal keratin 19
• type II cytoskeletal keratin 8
• PDZ and LIM domain protein 1
• Myosin heavy chain-9
• 60S ribosomal protein L6
• 40S ribosomal protein S11
• alpha-actinin-1
• vimentin
• lamin-B1
Catalytic Activity Proteins (21)
Structural Molecule Activity (13)
• caveolin-1
Myers et al. BMC Cancer (2017) 17:480
Page 10 of 18
Table 4 Overrepresentation analysis by PANTHER protein class of differentially expressed proteins and random sets of proteins
Protein Class
cytoskeletal protein
Size of
Class
Overrepresentation Analysis
# Sets per 1000 in Which Significantly Overrepresented
p-value
q-value
Using non-DEPs
Using all Proteins
198
0.001
0.033
2
0
storage protein
25
0.011
0.123
0
7
chaperone
183
0.027
0.209
100
107
transmembrane receptor regulatory
65
0.062
0.312
0
1
lyase
151
0.068
0.312
28
33
nucleic acid binding
2332
0.182
0.697
1
7
cell junction protein
140
0.216
0.71
0
0
isomerase
162
0.266
0.766
21
16
cell adhesion molecule
458
0.317
0.81
0
0
extracellular matrix protein
363
0.393
0.825
0
0
transfer/carrier protein
364
0.395
0.825
3
3
protease
586
0.497
0.953
0
0
membrane traffic protein
372
0.677
0.992
1
1
oxidoreductase
593
0.72
0.992
94
61
kinase
699
0.818
0.992
0
0
hydrolase
1482
0.832
0.992
0
0
defense/immunity protein
561
0.87
0.992
0
0
transferase
1198
0.879
0.992
0
0
signaling molecule
1083
0.915
0.992
0
0
transporter
920
0.933
0.992
0
0
enzyme modulator
1353
0.935
0.992
0
0
transcription factor
1451
0.957
0.992
0
0
receptor
1813
0.992
0.992
0
0
The PANTHER overrepresentation analysis was run on the subset of 63 DEPs and on 1000 subsets of 63 proteins (the number of DEPs identified) randomly
sampled from the 770 non-differentially expressed proteins and from all 833 proteins identified by mass spectrometry. Overrepresentation was based on comparison to
the reference human genome/proteome. DEP differentially expressed protein, PANTHER PANTHER: Protein ANalysis THrough Evolutionary Relationships
the significantly impacted pathways were differentially
expressed.
Differentially expressed proteins with recurring pathway
involvement
Many of the significant pathways featured a small recurring group of DEPs: beta-catenin, alpha-actinin-1, integrin
beta-1, integrin alpha-6, caveolin-1, filamin-A, laminin
subunit gamma-2, and CD44 antigen (Table 1). Betacatenin and alpha-actinin-1 contributed to the significance
of the “Tight Junction”, “Adherens Junction”, “Hippo Signaling Pathway”, and “Focal Adhesion” pathways. Integrin
beta-1 and integrin alpha-6 were included in the “Cell Adhesion Molecules”, “Small Cell Lung Cancer”, and “ECMReceptor Interaction” pathways. Caveolin-1 and filamin A
were included in the “Focal Adhesion” and “Proteoglycans
in Cancer” pathways. Laminin subunit gamma-2 appeared
in the “ECM-Receptor Interaction”, “Small Cell Lung
Cancer”, and “Focal Adhesion” pathways. Finally, CD44
antigen appeared in the “Proteoglycans in Cancer” and
“ECM-Receptor Interaction”. Experimental, co-expression,
co-occurrence, and homology interactions between DEPs
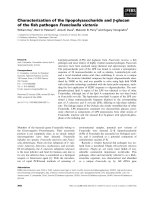
were visualized using STRING (Search Tool for the Retrieval of Interacting Genes/Proteins) [40] (Fig. 3). This
plot displays direct interactions between DEPs. Nodes
were centered on integrin beta-1, beta-catenin, and
caveolin-1, suggesting these proteins have the potential to
affect other proteins and may be involved in functional
networks.
Differentially expressed proteins and genes in human
prostate cancer patient specimens
To determine the relevance of the 63 DEPs identified in
the RC-77 cell line series in human prostate cancer specimens, we extracted protein and RNA expression data
from TCGA PRAD cohort. We compared the protein
and RNA expression of the 63 DEPs between AfricanAmerican and Caucasian-American prostate cancer
specimens; only caveolin-1, beta-catenin, myosin heavy
chain-9, serine/arginine-rich splicing factor 1/splicing
Myers et al. BMC Cancer (2017) 17:480
Page 11 of 18
Table 5 Categorization of differentially expressed proteins according to Gene Ontology Biological Process
Gene Ontology Biological Process Annotation (Number of Differentially Expressed Proteins)
Metabolic Process (37)
• eukaryotic translation initiation factor 4B
• double-stranded RNA-specific adenosine
deaminase
• plasminogen activator inhibitor 1
RNA-binding protein
• serotransferrin
• 60S ribosomal protein L6
• nucleolar RNA helicase 2
• proteasome activator complex subunit 3
• non-histone chromosomal protein HMG-14
• cytosolic acyl coenzyme A thioester
hydrolase
• phosphoenolpyruvate carboxykinase
• non-histone chromosomal protein HMG-17
• cytochrome c oxidase subunit 5A
• prothymosin alpha
• 40S ribosomal protein S11
• 40S ribosomal protein S24
• high mobility group protein HMG-I/HMG-Y
• gamma-interferon-inducible protein 16
• T-complex protein 1 subunit epsilon
• RNA-binding protein EWS
• PDZ and LIM domain protein 1
• high mobility group protein HMGI-C
• calpastatin
• 60S ribosomal protein L35
• aminopeptidase N
• creatine kinase U-type
• myosin heavy chain-9
• 60S ribosomal protein L10
• S-formylglutathione hydrolase
• hepatoma-derived growth factor
• phosphoserine aminotransferase
• thioredoxin domain-containing protein 17
• S-methyl-5′-thioadenosine phosphorylase
• hydroxyacyl-coenzyme A dehydrogenase
• adenosylhomocysteinase
• prefoldin subunit 2
• caveolin-1
• PDZ and LIM domain protein 1
• type I cytoskeletal keratin 19
• non-histone chromosomal protein HMG-17
• lamin-B1
• integrin beta-1
• CD166 antigen
• non-histone chromosomal protein HMG-14
• double-stranded RNA-specific adenosine
deaminase
• high mobility group protein HMG-I/HMG-Y
• myosin heavy chain-9
• 40S ribosomal protein S11
• caveolin-1
• vimentin
• 40S ribosomal protein S24
• filamin-A
• high mobility group protein HMGI-C
• type II cytoskeletal keratin 8
• hepatoma-derived growth factor
• CD59 glycoprotein
• alpha-actinin-1
• 14–3-3 protein sigma
• adenosylhomocysteinase
• putative pre-mRNA-splicing factor
ATP-dependent RNA helicase DHX15
• putative pre-mRNA- splicing factor ATP-dependent
RNA helicase DHX15
Cellular Process Proteins (23)
factor 2, double-stranded RNA-specific adenosine deaminase, and X-ray repair cross-complementing protein
5 had both protein and RNA data. X-ray repair crosscomplementing protein 5 protein levels were significantly higher in African-American prostate cancer
specimens than in Caucasian-American prostate cancer
specimens (p < 0.05) (Fig. 4a). The RNA expression of
caveolin-1 and myosin heavy chain-9 were significantly
downregulated in African-American prostate cancer
specimens compared to Caucasian-American prostate
cancer specimens (p < 0.01 and p < 0.05, respectively)
(Fig. 4b). After subtracting mRNA expression levels of
non-malignant specimens from human prostate cancer
specimens, caveolin-1 and beta-catenin mRNA expression
levels were significantly higher in African-American prostate cancer patient specimens compared to CaucasianAmerican prostate cancer specimens (Fig. 5). As indicated
by the negative RNA expression value, caveolin-1 was
downregulated in African American prostate cancer
specimens compared to African American non-malignant
control specimens; on the contrary, beta-catenin was upregulated. Therefore, the reduction of caveolin-1 protein
levels and the increased protein levels of beta-catenin seen
in the tumorigenic RC-77 T/E cells were mirrored in the
downregulation of caveolin-1 mRNA and upregulation of
beta-catenin mRNA in African-American prostate cancer
specimens.
Discussion
The paired non-malignant and malignant AfricanAmerican prostate epithelial cell lines RC-77 T/E and
RC-77 N/E represent one of only a few cell lines derived
from African-American prostate cancer patients [30].
E006AA, RC-165 N, and MDA-PCa 2a/2b are other
African-American patient-derived cell lines. E006AA
also has a highly tumorigenic derivative, E006AA-hT,
and an associated stroma cell line, S006AA [27]. While
the E006AA-hT model can be used to examine the differences between less and more highly tumorigenic cancers, it does not have a non-malignant paired epithelial
Myers et al. BMC Cancer (2017) 17:480
Page 12 of 18
Table 6 Pathways from the National Cancer Institute-Nature Pathway Interaction Database overrepresented in RC-77 cell lines
Pathway Name
Differentially Expressed Proteins in Pathway
p-value
q-value
α6β1 and α6β4 integrin signaling
ITGA6, ITGB1, LAMC2, SFN
5.75E-05
7.88E-03
α4β7 integrin signaling
CD44, ITGB1
7.79E-04
5.14E-02
α6β4 integrin-ligand interactions
ITGA6, LAMC2
1.18E-03
5.14E-02
Arf6 trafficking events
CTNNB1, ITGA6, ITGB1
1.50E-03
5.14E-02
TGF-beta receptor signaling
CAV1, CTNNB1, PML*
2.08E-03
5.70E-02
mTOR signaling pathway
EIF4B, PML*, SFN
4.07E-03
7.38E-02
β1 integrin cell surface interactions
ITGA6, ITGB1, LAMC2
4.07E-03
7.38E-02
Canonical Wnt signaling pathway
CAV1, CTNNB1
4.31E-03
7.38E-02
Plexin-D1 signaling
ITGA6, ITGB1
5.59E-03
8.51E-02
Integrin family cell surface interactions
ITGA6, ITGB1
6.52E-03
8.93E-02
BARD1 signaling events
EWSR1*, XRCC5
8.58E-03
1.07E-01
Syndecan-4-mediated signaling events
ACTN1, ITGB1
9.69E-03
1.11E-01
Signaling mediated by p38-alpha and p38-beta
KRT19, KRT8
1.34E-02
1.40E-01
E-cadherin signaling events
CTNNB1
1.43E-02
1.40E-01
Stabilization and expansion of the E-cadherin adherens junction
ACTN1, CTNNB1
1.75E-02
1.60E-01
Integrin-linked kinase signaling
ACTN1, CTNNB1
1.90E-02
1.63E-01
FoxO family signaling
CTNNB1, SFN
2.21E-02
1.78E-01
Direct p53 effectors
CAV1, PML*, SFN
2.46E-02
1.87E-01
Caspase cascade in apoptosis
LMNB1, VIM
2.79E-02
2.01E-01
Co-regulation of androgen receptor activity
CTNNB1, XRCC5
3.32E-02
2.17E-01
Signaling events mediated by focal adhesion kinase
ACTN1, ITGB1
3.32E-02
2.17E-01
Validated targets of C-MYC transcriptional repression
ITGA6, ITGB1
4.27E-02
2.54E-01
Signaling events mediated by VEGFR1 and VEGFR2
CAV1, CTNNB1
4.27E-02
2.54E-01
p73 transcription factor network
PML*, SFN
4.88E-02
2.79E-01
Proteins in bold font were upregulated in RC-77 T/E. Proteins in italic font were downregulated in RC-77 T/E. *Protein found in RC-77 T/E only. P-values were calculated
using a hypergeometric cumulative distribution function. Q-value is the p-value corrected for multiple hypotheses testing using the Benjamini-Hochberg method. ACTN1
alpha-actinin-1, CAV1 caveolin-1, CD44 CD44 antigen, CTNNB1 beta-catenin, EIF4B eukaryotic translation initiation factor 4B, EWSR1 RNA-binding protein EWS, ITGA6
integrin alpha-6, ITGB1 integrin beta-1, KRT8 type II cytoskeletal keratin 8, KRT19 = type I cytoskeletal keratin 19, LAMC2 laminin subunit gamma-2, LMNB1
lamin-B1, PML protein PML, SFN 14–3-3 protein sigma, VIM vimentin, XRCC5 X-ray repair cross-complementing protein 5
cell line. The RC-165 N cell line is unique because it
was derived from benign prostate tissue of an AfricanAmerican male and was immortalized by telomerase
[41]. This cell line is useful for understanding the functions of the androgen receptor in prostate epithelial
cells. MDA-PCa 2a/2b cells are tumorigenic but differ in
vivo and in vitro. These cell lines are a useful androgen
sensitive model, but, unlike RC-77 cells, they do not
have a paired non-malignant cell line from the same patient [29]. As RC-77 cell lines have epithelial-like characteristics, have functioning androgen receptors, and are
immortalized with both a malignant and non-malignant
pair, they represent a promising model for studying
prostate cancer.
Here, we report the global proteomic characterization
of RC-77 T/E and RC-77 N/E cell lines. Since RC-77 T/
E cells are tumorigenic and RC-77 N/E cells are not, we
analyzed DEPs between the two phenotypes. In overrepresentation analysis, GSEA, and SPIA, we consistently
found that beta-catenin, alpha-actinin-1, integrin beta-1,
integrin alpha-6, caveolin-1, laminin subunit gamma-2,
CD44 antigen, and filamin-A expression levels contributed to the significance of the pathways highlighted in
this report. Each of these proteins has structural roles or
roles in cell adhesion, which explains why structural proteins were more prevalent among DEPs than could be
expected by random chance and why many overrepresented pathways were related to cell adhesion (cell-cell
or cell-matrix) or integrin signaling. Beta-catenin forms
a complex with E-cadherin at adherens junctions to
mediate cell-cell adhesion [42]. Alpha-actinin-1 forms
focal adhesions, adherens junctions, tight junctions, and
hemidesmosomes; forms cell-cell or cell-matrix contacts;
and plays a scaffolding role for the cytoskeleton in a variety of signaling pathways [43]. Integrins interact with
extracellular matrix (ECM) components to form cellmatrix attachments and propagate extracellular signals
[44]. Caveolin-1 is an important component of caveolae,
Myers et al. BMC Cancer (2017) 17:480
Page 13 of 18
Table 7 Enriched gene sets in RC-77 T/E and RC-77 N/E cell lines
Pathway (Size)
NES
p-value
q-value
Proteins Contributing to Enrichment
KEGG: Tight Junction (16)
2.064
0.00E + 00
3.41E-03
alpha-actinin-1*, alpha-actinin-4*, alpha-catenin, beta-catenin*, casein
kinase II subunit beta, myosin heavy chain-9*, Src substrate cortactin*
KEGG: Cell Adhesion Molecules (6)
−1.836
0.00E + 00
1.34E-02
CD166 antigen, integrin alpha-6, integrin beta-1
KEGG: Hippo Signaling Pathway (9)
1.797
3.98E-03
2.73E-02
alpha-catenin*, beta-catenin*, 14–3-3 protein beta/alpha, 14–3-3
protein theta, 14–3-3 protein zeta/delta
KEGG: Transcriptional Misregulation in
Cancer (9)
1.733
1.54E-02
4.09E-02
high mobility group protein HMGI-C, junction plakoglobin*,
protein PML, RNA-binding protein EWS, RNA-binding protein FUS
KEGG: Adherens Junction (12)
1.704
1.27E-02
4.87E-02
alpha-actinin-1*, alpha-actinin-4*, alpha-catenin*, beta-catenin*,
epidermal growth factor receptor, casein kinase II subunit beta
BioCarta: ChREBP2 Pathway (7)
1.695
1.01E-02
8.11E-02
14–3-3 protein beta/alpha, 14–3-3 protein theta, 14–3-3 protein
zeta/delta, fatty acid synthase
KEGG: Cell Cycle (9)
1.627
2.49E-02
9.07E-02
DNA-dependent protein kinase catalytic subunit, DNA replication
licensing factor MCM6, 14–3-3 protein beta/alpha,
14–3-3 protein sigma, 14–3-3 protein theta, 14–3-3 protein zeta/delta,
KEGG: ECM-Receptor Interaction (8)
−1.557
6.09E-03
1.57E-01
CD44 antigen, integrin alpha-2, integrin alpha-3, integrin alpha-6,
integrin beta-1, integrin beta-4, laminin subunit beta-3,
laminin subunit gamma-2
KEGG: Small Cell Lung Cancer (7)
−1.488
5.20E-02
1.87E-01
integrin alpha-2, integrin alpha-3, integrin alpha-6, integrin beta-1,
laminin subunit beta-3, laminin subunit gamma-2
KEGG: Complement and Coagulation
Cascades (5)
−1.441
5.08E-02
2.02E-01
alpha-1-antitrypsin, alpha-2-macroglobulin, complement C3,
CD59 glycoprotein, tissue factor
Positive enrichment scores correspond to enrichment in RC-77 T/E samples. Negative enrichment scores correspond to enrichment in RC-77 N/E samples. Bolded
proteins were differentially expressed (q < 0.1, Wilcoxon rank-sum test). *Carries a “Structural” or “Cytoskeletal” annotation in PANTHER. ChREBP2 carbohydrate
responsive element binding protein, ECM extracellular matrix, KEGG Kyoto Encyclopedia of Genes and Genomes, NES normalized enrichment score (normalized to
size of the pathway); p-value = probability of significance after permutation, q-value = false discovery rate-adjusted p-value; size = total number of genes
in pathway
which are involved in molecular transport, cell adhesion,
motility, and signal transduction [45, 46]. Laminin forms
part of the basement membrane in some epithelial tissues
and functions in adhesion, migration, invasion, and differentiation [47]. The glycoprotein CD44 antigen mediates
cell adhesion and cytoskeleton binding through interactions with other proteins such as ankryin and ezrin,
radixin, and moesin (ERM) proteins [48] and mediates
hyaluronan-stimulated proliferation, apoptosis inhibition,
cell motility, invasion [49]. Filamin-A cross-links actin filaments and serves as a scaffolding protein to organize the
actin cytoskeleton [50], which affects cell motility, migration, and signaling [51].
Furthermore, expression levels of beta-catenin, caveolin1, integrin beta-1, integrin alpha-6, CD44 antigen, and
alpha-actinin-1 have been shown to differ by race. Here,
we have shown higher beta-catenin protein levels in
malignant RC-77 T/E cells compared to RC-77 N/E cells
and that its mRNA is upregulated in African-American
prostate cancer specimen compared to CaucasianAmerican specimen after subtracting the mRNA expression of race-specific non-malignant controls. These
results are consistent with previous reports that betacatenin is highly elevated in African-American prostate
tumors compared to Caucasian tumors [16, 52]. Integrin
alpha-6 and integrin beta-1 were downregulated in RC77 T/E cells compared to RC-77 N/E cells, and integrins
have been shown to be downregulated in AfricanAmerican prostate cancer tissue compared to Caucasian
specimens [12]. Thus, in these aspects, RC-77 T/E cells reflect in vivo characteristics of African-American prostate
cancer and may be useful in the study of malignant transformation in African-American prostate tumors. While
alpha-actinin-1 was upregulated in malignant RC-77 T/E
Table 8 Significantly inhibited pathways in RC-77 T/E cell lines
Name (KEGG ID)
NDE
pNDE
pPERT
pG
pGFdr
Focal Adhesion (hsa04510)
7
9.61E-04
2.00E-02
2.28E-04
9.34E-03
Small Cell Lung Cancer (hsa05222)
3
1.17E-02
1.40E-02
1.59E-03
2.46E-02
Proteoglycans in Cancer (hsa05205)
6
1.35E-03
1.78E-01
2.25E-03
2.46E-02
ECM-Receptor Interaction (hsa04512)
4
1.67E-03
1.55E-01
2.40E-03
2.46E-02
ECM extracellular matrix, NDE number of differentially expressed elements, pG global probability, pGFdr false discovery rate-adjusted global probability,
pNDE overrepresentation probability, pPERT, perturbation probability
Myers et al. BMC Cancer (2017) 17:480
Page 14 of 18
Fig. 3 Functional associations between differentially expressed proteins in RC-77 T/E and RC-77 N/E cell lines. STRING (Search Tool for the Retrieval of
Interacting Genes/Proteins) was used to visualize a network of functional associations between differentially expressed proteins. Interactions were
limited to only those supported by experimental evidence, co-expression or co-occurrence data, and gene homology data. See Table 1 for
the full names of proteins abbreviated here. Nodes centered on integrin beta-1, beta-catenin, and caveolin-1, suggesting these proteins have
the potential to affect other proteins and may be involved in functional networks
cells, it was downregulated in African-American prostate
cancer tissue compared to Caucasian specimens [12].
Our results also showed that caveolin-1 protein level
was lower in malignant RC-77 T/E cells than nonmalignant RC-77 N/E cells and that its mRNA expression was downregulated in African-American prostate
cancer patient specimen compared to non-malignant
African-American prostate specimen. After subtracting
race-specific non-malignant RNA expression, caveolin-1
mRNA expression was higher in African-American prostate cancer patient specimens than in specimens from
Caucasian-American patients. This result is in agreement
with another study reporting elevated caveolin-1 protein
expression in African-American prostate cancer specimens compared to Caucasian-American specimens [53].
African-American prostate cancer patients were also
found to have higher rates of methylation of the CD44
gene [54], which was downregulated in malignant RC77 T/E cells in this study.
To understand how differential expression of betacatenin, caveolin-1, integrin beta-1, integrin alpha-6,
CD44 antigen, and alpha-actinin-1 in RC-77 T/E cells
may be related to phenotypic differences between RC77 T/E and RC-77 N/E cell lines, we looked at the interactions between the DEPs using both STRING (to
visualize direct interactions) and pathway analyses. First,
the STRING network map revealed beta-catenin, integrin beta-1, and caveolin-1 in nodal positions, meaning
these proteins may interact with several other DEPs in
our dataset and may be a key regulator of the pathways
highlighted in our results. For example, interaction between filamin-A and integrin beta-1 or caveolin-1 promotes migration, cell spreading, or metastasis, while
interaction with other proteins results in inhibition of
metastasis [51]. While filamin-A was upregulated in RC77 T/E cells, integrin beta-1, caveolin-1 and vimentin,
three of its binding partners that promote metastasis,
were significantly downregulated. This is congruent
Myers et al. BMC Cancer (2017) 17:480
Page 15 of 18
Fig. 4 Expression of differentially expressed proteins by race in age- and stage-matched human prostate cancer specimens. In 12 age-and
stage-matched prostate cancer specimen pairs extracted from TCGA without subtracting the non-malignant controls, (A) XRCC5 protein was
found to be significantly different (p < 0.05) between African-American and Caucasian-American prostate cancer specimens and (B) RNA
expression of CAV1 and MYH9 were found to be significantly different (p < 0.01 and <0.05, respectively) between African-American and
Caucasian-American prostate cancer specimens. The p-values were generated using the “t.test” function in R. AA = African-American;
ADAR = double-stranded RNA-specific adenosine deaminase; CA = Caucasian-American; CAV1 = caveolin-1; CTNNB1 = beta-catenin; MYH9 = myosin
heavy chain-9; SRSF1 = serine/arginine-rich splicing factor 1; TCGA = The Cancer Genome Atlas; XRCC5 = X-ray repair cross-complementing protein 5
with our knowledge that RC-77 T/E cells are derived
from early stage primary prostate cancer (Gleason
score 7) and are not metastatic [30]. Second, pathway
analyses revealed that a common thread among the
significant pathways was the inclusion of structural
proteins, which could each be linked to invasion or
migration of cells. “Tight Junction” and “Adherens
Junction” pathways were enriched specifically in RC77 T/E cells. Tight junctions are composed of claudin
proteins, junctional adhesion molecules, integral
membrane proteins, and cytoplasmic proteins, while
adherens junctions are formed of cadherins and catenins [55]. Both hold together adjacent cells and help
with structural and mechanical cell-cell integrity. The
disruption of cell adhesion can facilitate the metastasis
of tumor cells to secondary locations and lead to cell
growth unchecked by contact inhibition [56]. The
“Focal Adhesions” and “Proteoglycans in Cancer”
pathways were significantly inhibited in RC-77 T/E
cells. Proteoglycans in the tumor microenvironment
associate with ECM proteins and affect proliferation,
adhesion, and metastasis [57]. While the significance
of the “Small Cell Lung Cancer” KEGG pathway may
seem odd, it was highlighted in this dataset because of
the role of ECM-receptor interactions and focal adhesions in cancer progression (see Additional file 10).
“Cell Adhesion Molecules” and “ECM-Receptor Interaction” pathways, which were enriched in RC-77 N/E cells
according to GSEA and shown to be significant by SPIA,
were primarily flagged because of integrin expression.
Myers et al. BMC Cancer (2017) 17:480
Page 16 of 18
tumor heterogeneity, it is a resource for studying prostate
cancer initiation and progression.
Additional files
Additional file 1: Operating Parameters for Mass Spectrometry
Experiments. This text file provides the technical operating parameters for
the mass spectrometry experiments
Additional file 2: MA Plot. This MA plot shows the data before (a) and
after (b) transformation. The variances of the data remained similar before
and after transformation, except for the larger average effects (> 40 in
original scale). (TIFF 347 kb)
Fig. 5 Tumor-to-non-malignant comparison of RNA expression of
the differentially expressed proteins by race in age- and stage-matched
human prostate cancer specimens. Race-specific non-malignant mRNA
expression levels of PRAD specimens were subtracted from 12 pairs of
age- and stage-matched prostate cancer specimens extracted from
TCGA, respectively. CAV1 and CTNNB1 mRNA expressions were found
to be significantly higher in African-American compared to CaucasianAmerican specimens (p < 0.05 and <0.01, respectively). The p-values
were generated using the “t.test” function in R. As indicated by the
negative RNA expression value on the y-axis, CAV1 was downregulated
in African American prostate cancer specimens compared to African
American non-malignant control specimens. On the contrary, CTNNB1
was upregulated. AA = African-American; ADAR = double-stranded
RNA-specific adenosine deaminase; CA = Caucasian-American;
CAV1 = caveolin-1; CTNNB1 = beta-catenin; MYH9 = myosin heavy
chain-9; PRAD = prostate cancer adenocarcinoma; SRSF1 = serine/
arginine-rich splicing factor 1; TCGA = The Cancer Genome Atlas;
XRCC5 = X-ray repair cross-complementing protein 5
Conclusion
We detected 63 differentially expressed proteins between
the malignant RC-77 T/E and the non-malignant RC77 N/E cell lines, with 18 proteins uniquely detected in
RC-77 T/E cells and 2 proteins uniquely detected in
RC-77 N/E cells. The STRING network map revealed
beta-catenin, integrin beta-1, and caveolin-1 in nodal
positions, suggesting these proteins interact with several
other DEPs and may be key regulators of the identified
pathways. The “Tight Junction”, “Cell Adhesion Molecules”, “Adherens Junction”, “ECM-Receptor interaction”,
“Focal Adhesion”, and “Proteoglycans in Cancer” pathways
were shown to correlate with either RC-77 T/E or RC77 N/E cells. Because structural proteins were overrepresented among DEPs and because several of the DEPs
common to the significant pathways identified are
structural proteins or have a structural role, our findings
suggest that structural proteins may significantly contribute to the phenotypic differences between RC-77 T/E and
RC-77 N/E cell lines. Based on data from both human
prostate cell lines and limited patient specimens, our results indicate that differential expression of caveolin-1 and
beta-catenin may be race- and prostate cancer-specific. A
larger number of patients will be required to verify these
findings. Although the RC-77 cell model may not be representative of all African-American prostate cancer due to
Additional file 3: KEGG Pathways Selected for Inclusion in All Pathway
Analyses. These are the KEGG pathways used in Gene Set Enrichment
Analysis and Signaling Pathway Impact Analysis. Pathways likely to have
little relevance to prostate cancer (e.g., parasitic, bacterial, and viral infectious
diseases; substance dependencies; and specific immune, neurodegenerative,
and cardiovascular diseases) were excluded from the set
Additional file 4: TCGA PRAD DEPs Protein and mRNA Expression Data.
This spreadsheet contains the patient demographics, tumor characteristics,
and protein and mRNA expression data for the 24 age- and stage-matched
African-American and Caucasian-American tumors used in this study.
Additional sheets present the data of patients used for the non-malignant
comparison and the expression values after subtracting the race-specific
averaged values from the tumor expression values. (XLSX 23 kb)
Additional file 5: Proteins Identified in RC77T/E and RC-77 N/E Cell Lines.
This table lists all protein assignments and raw spectral counts obtained by
high-resolution electrospray tandem mass spectrometry (nLC-ESI-LIT-Orbitrap)
for all biological replicates.
Additional file 6: Processed Proteomics Data. This table contains the working
dataset formed after processing the raw data. Processing included summing
isoform data, rounding expression data up to the nearest whole number, and
calculating log2 fold change ratios
Additional file 7: Reproducibility of Protein Fold Changes among Biological
Replicates. This figure shows the log2 fold changes of corresponding
biological replicates among RC-77 T/E and RC-77 N/E cell lines. The variations
are well-controlled, as the majority of the proteins having fold changes less
than 2 in both normal and tumor cell lines. (PDF 936 kb)
Additional file 8: Additional Analysis on Reproducibility of Protein Fold
Changes between Paired Malignant and Non-Malignant Replicates. The
differential expressions are stable across different pairs of tumor and nonmalignant cell lines. (PNG 695 kb)
Additional file 9: Complete Gene Set Enrichment Analysis Results. This
table lists the enriched gene sets identified from KEGG, BioCarta, and
Reactome databases using Gene Set Enrichment Analysis. Positive enrichment
scores correspond to enrichment in the malignant samples (RC-77 T/E).
Negative enrichment scores correspond to enrichment in the non-malignant
samples (RC-77 N/E). SIZE = total number of genes in pathway, ES = enrichment
score, NES = normalized enrichment score, NOM p-val = unadjusted probability of enrichment, FDR q-val = false discovery rate-adjusted probability.
Additional file 10: Complete Signaling Pathway Impact Analysis Results. This
table presents the complete results of Signaling Pathway Impact Analysis. For
each pathway, a link to a pathway diagram highlighting differentially
expressed proteins in red is provided. ID = KEGG ID, pSize = pathway size,
NDE = number of differentially expressed proteins in pathway, pNDE = probability of overrepresentation, tA = total accumulated perturbation,
pPERT = probability of perturbation, pG = combined global probability of
overrepresentation and perturbation, pGFdr = false-discovery rate-adjusted
global probability, pGFWER = familywise error rate-adjusted global probability.
Abbreviations
DEP: Differentially expressed protein; ECM: Extracellular matrix; FDR: False
discovery rate; GO: Gene Ontology; GSEA: Gene Set Enrichment Analysis;
KEGG: Kyoto Encyclopedia of Genes and Genomes; PANTHER: Protein
ANalysis THrough Evolutionary Relationships; pGFdr: False discovery rate-
Myers et al. BMC Cancer (2017) 17:480
Page 17 of 18
adjusted global probability; PRAD: Prostate adenocarcinoma; SPIA: Signaling
Pathway Impact Analysis; STRING: Search Tool for the Retrieval of Interacting
Genes/Proteins; TCGA: The Cancer Genome Atlas
Received: 28 December 2015 Accepted: 28 June 2017
Acknowledgements
The authors wish to thank Honghe Wang for cell culture, Kate Calvin and
Rakesh Singh of the Florida State University Translational Science Laboratory
for mass spectrometry assistance, and Ariana K. von Lersner and Charles J.
Robbins for technical assistance.
References
1. Siegel RL, Miller KD, Jemal A. Cancer statistics, 2015. CA Cancer J Clin.
2015;65:5–29.
2. Platz EA, Rimm EB, Willett WC, Kantoff PW, Giovannucci E. Racial variation in
prostate cancer incidence and in hormonal system markers among male
health professionals. J Natl Cancer Inst. 2000;92:2009–17.
3. Wells TS, Bukowinski AT, Smith TC, Smith B, Dennis LK, Chu LK, et al. Racial
differences in prostate cancer risk remain among US servicemen with equal
access to care. Prostate. 2010;70:727–34.
4. Karami S, Young HA, Henson DE. Earlier age at diagnosis: another
dimension in cancer disparity? Cancer Detect Prev. 2007;31:29–34.
5. Chornokur G, Dalton K, Borysova ME, Kumar NB. Disparities at presentation,
diagnosis, treatment, and survival in African American men, affected by
prostate cancer. Prostate. 2011;71:985–97.
6. American Cancer Society. Cancer Facts & Figures 2015. Atlanta: American
Cancer Society; 2015.
7. Zhang H, Messing EM, Travis LB, Hyrien O, Chen R, Milano MT, et al. Age
and racial differences among PSA-detected (AJCC stage T1cN0M0) prostate
cancer in the U.S.: a population-based study of 70,345 men. Front Oncol.
2013;3:312.
8. Tsivian M, Banez LL, Keto CJ, Abern MR, Qi P, Gerber L, et al. African-American
men with low-grade prostate cancer have higher tumor burdens: results from
the Duke prostate Center. Prostate Cancer Prostatic Dis. 2013;16:91–4.
9. Sanchez-Ortiz RF, Troncoso P, Babaian RJ, Lloreta J, Johnston DA, Pettaway
CA. African-American men with nonpalpable prostate cancer exhibit greater
tumor volume than matched white men. Cancer. 2006;107:75–82.
10. Farrell J, Petrovics G, McLeod DG, Srivastava S. Genetic and molecular
differences in prostate carcinogenesis between African American and
Caucasian American men. Int J Mol Sci. 2013;14:15510–31.
11. Farrell J, Young D, Chen Y, Cullen J, Rosner IL, Kagan J, et al. Predominance
of ERG-negative high-grade prostate cancers in African American men. Mol
Clin Oncol. 2014;2:982–6.
12. Kinseth MA, Jia Z, Rahmatpanah F, Sawyers A, Sutton M, Wang-Rodriguez J,
et al. Expression differences between African American and Caucasian
prostate cancer tissue reveals that stroma is the site of aggressive changes.
Int J Cancer. 2013;134:81–91.
13. Powell IJ, Dyson G, Land S, Ruterbusch J, Bock CH, Lenk S, et al. Genes
associated with prostate cancer are differentially expressed in African American
and European American men. Cancer Epidemiol Biomark Prev. 2013;22:891–7.
14. Reams RR, Agrawal D, Davis MB, Yoder S, Odedina FT, Kumar N, et al.
Microarray comparison of prostate tumor gene expression in AfricanAmerican and Caucasian American males: a pilot project study. Infect Agent
Cancer. 2009;4:S3.
15. Wallace TA, Prueitt RL, Yi M, Howe TM, Gillespie JW, Yfantis HG, et al. Tumor
immunobiological differences in prostate cancer between African-American
and European-American men. Cancer Res. 2008;68:927–36.
16. Venkatesh K, Lajwanti D, Kiran SP, Raje DV, Nayarisseri A. Differentially
expressed genes in tumors of prostate cancer in American patients with
European and African origin. J Pharm Res. 2013;6:583–8.
17. Theodore SC, Davis M, Zhao F, Wang H, Chen D, Rhim J, et al. MicroRNA
profiling of novel African American and Caucasian prostate cancer cell lines
reveals a reciprocal regulatory relationship of miR-152 and DNA
methyltranferase 1. Oncotarget. 2014;5:3512–25.
18. Taksler GB, Keating NL, Cutler DM. Explaining racial differences in prostate
cancer mortality. Cancer. 2012;118:4280–9.
19. van Bokhoven A, Varella-Garcia M, Korch C, Johannes WU, Smith EE, Miller
HL, et al. Molecular characterization of human prostate carcinoma cell lines.
Prostate. 2003;57:205–25.
20. Wolf M, Mousses S, Hautaniemi S, Karhu R, Huusko P, Allinen M, et al. Highresolution analysis of Gene copy number alterations in human prostate
cancer using CGH on cDNA microarrays: impact of copy number on Gene
expression. Neoplasia. 2004;6:240–7.
21. Bennett NC, Hooper JD, Johnson DW, Gobe GC. Expression profiles and
functional associations of endogenous androgen receptor and caveolin-1 in
prostate cancer cell lines. Prostate. 2014;74:478–87.
22. Meehan KL, Sadar MD. Quantitative profiling of LNCaP prostate cancer
cells using isotope-coded affinity tags and mass spectrometry.
Proteomics. 2004;4:1116–34.
Funding
This work was in part supported by the Leslie N. Wilson-Delores Auzenne
Graduate Assistantship for Minorities from the Graduate School at Florida
State University to JSM for study design, the collection, analysis, and
interpretation of data, and writing the manuscript; and in part by grants
from Florida State University and an Endowed Chair Professorship in
Cancer Research from anonymous donors to QXAS for study design,
directing the research, and writing the manuscript. This work was in part
supported by grants from the Department of Defense Prostate Cancer
Research Program (PC120913), NIH/NIMHD (G12 RR03059-21A1), NIH/NCI
(R21 CA188799–01), and NIH/NCI (U54 CA118623) to CCY for growing
and maintaining the cell lines and writing the manuscript. The funding
bodies played no direct role in the study design, data collection, data
analysis, data interpretation or the writing of the manuscript.
Availability of data and materials
The dataset supporting the conclusions of this article is included within the
article and its additional files.
Authors’ contributions
JSM participated in the study design, isolated and prepared proteins for
proteomic analysis, performed data analysis (including processing, statistical
calculations, programming, and pathway analyses), and prepared the
manuscript. KAV performed bioinformatics analyses and helped edit the
manuscript. JW performed bioinformatics analyses of patient tissue specimens
from TCGA. KY contributed to the programming and statistical analyses. CCY
cultured the African-American cell lines and helped revise the manuscript. QXAS
conceived of the study, directed the research, analyzed the data, and helped
write and revise the manuscript. All authors read and approved the final
manuscript.
Ethics approval and consent to participate
Not applicable. This work used existing and de-identified human cell lines
established many years ago as reported in the cited reference [30] by Theodore
et al. The use of these cell lines for this study was approved by the institutional
review board (IRB) at Tuskegee University. This work does not involve in making
any new cell lines. This Human Subjects Research falls under Exemption 4 as
described in 45 CFR § 46.101(b)(4) according to the U.S. Department of Health
& Human Services. “Research involving the collection or study of existing data,
documents, records, pathological specimens, or diagnostic specimens, if
these sources are publically available or if the information is recorded by
the investigator in such a manner that subjects cannot be identified, directly or
through identifiers linked to the subjects.”
Consent for publication
Not applicable.
Competing interests
The authors declare no competing interests.
Publisher’s Note
Springer Nature remains neutral with regard to jurisdictional claims in
published maps and institutional affiliations.
Author details
1
Department of Chemistry and Biochemistry and Institute of Molecular
Biophysics, Florida State University, 95 Chieftan Way, Tallahassee, FL
32306-4390, USA. 2Department of Biology and Center for Cancer Research,
Tuskegee University, Tuskegee, AL 36088, USA. 3Department of Biostatistics Unit 1411, University of Texas MD Anderson Cancer Center, Houston, TX
77030-1402, USA.
Myers et al. BMC Cancer (2017) 17:480
23. Dozmorov MG, Hurst RE, Culkin DJ, Kropp BP, Frank MB, Osban J, et al.
Unique patterns of molecular profiling between human prostate cancer
LNCaP and PC-3 cells. Prostate. 2009;69:1077–90.
24. Myung JK, Sadar MD. Large scale phosphoproteome analysis of LNCaP
human prostate cancer cells. Mol BioSyst. 2012;8:2174–82.
25. Glen A, Evans CA, Gan CS, Cross SS, Hamdy FC, Gibbins J, et al. Eight-plex
iTRAQ analysis of variant metastatic human prostate cancer cells identifies
candidate biomarkers of progression: an exploratory study. Prostate. 2010;
70:1313–32.
26. Koochekpour S, Maresh GA, Katner A, Parker-Johnson K, Lee T, Hebert FE,
et al. Establishment and characterization of a primary androgen-responsive
African-American prostate cancer cell line, E006AA. Prostate. 2004;60:141–52.
27. Koochekpour S, Willard SS, Shourideh M, Ali S, Liu C, Azabdaftari G, et al.
Establishment and characterization of a highly tumorigenic African
American prostate cancer cell line, E006AA-hT. Int J Biol Sci. 2014;10:834–45.
28. Gu Y, Kim KH, Ko D, Srivastava S, Moul JW, McLeod DG, et al. Androgen and
androgen receptor antagonist responsive primary African-American benign
prostate epithelial cell line. Anticancer Res. 2005;25:1–8.
29. Navone NM, Olive M, Ozen M, Davis R, Troncoso P, Tu SM, et al.
Establishment of two human prostate cancer cell lines derived from a single
bone metastasis. Clin Cancer Res. 1997;3:2493–500.
30. Theodore S, Sharp S, Zhou J, Turner T, Li H, Miki J, et al. Establishment and
characterization of a pair of non-malignant and malignant tumor derived
cell lines from an African American prostate cancer patient. Int J Oncol.
2010;37:1477–82.
31. Theodore SC, Rhim JS, Turner T, Yates C. MiRNA 26a expression in a novel
panel of African American prostate cancer cell lines. Ethn Dis. 2010;20:S196–00.
32. Reams R, Kalari K, Wang H, Odedina FT, Soliman KF, Yates C. Detecting
gene-gene interactions in prostate disease in African American men. Infect
Agent Cancer. 2011;6:S1.
33. Siddique HR, Parray A, Zhong W, Karnes RJ, Bergstralh EJ, Koochekpour S,
et al. BMI1, stem cell factor acting as novel serum-biomarker for Caucasian
and African-American prostate cancer. PLoS One. 2013;8:e52993.
34. Parray A, Siddique HR, Kuriger JK, Mishra SK, Rhim JS, Nelson HH, et al.
ROBO1, a tumor suppressor and critical molecular barrier for localized
tumor cells to acquire invasive phenotype: study in African-American and
Caucasian prostate cancer models. Int J Cancer. 2014;135:2493–506.
35. R Core Team. R: A language and environment for statistical computing.
2014. Version 3.1.2.
36. Mi H, Muruganujan A, Thomas PD. PANTHER in 2013: modeling the
evolution of gene function, and other gene attributes, in the context of
phylogenetic trees. Nucleic Acids Res. 2013;41:D377–86.
37. Schaefer CF, Anthony K, Krupa S, Buchoff J, Day M, Hannay T, et al. PID: the
pathway interaction database. Nucleic Acids Res. 2009;37:D674–9.
38. Subramanian A, Tamayo P, Mootha VK, Mukherjee S, Ebert BL, Gillette MA, et al.
Gene set enrichment analysis: a knowledge-based approach for interpreting
genome-wide expression profiles. Proc Natl Acad Sci U S A. 2005;102:15545–50.
39. Tarca AL, Draghici S, Khatri P, Hassan SS, Mittal P, Kim JS, et al. A novel
signaling pathway impact analysis. Bioinformatics. 2009;25:75–82.
40. Szklarczyk D, Franceschini A, Wyder S, Forslund K, Heller D, Huerta-Cepas J,
et al. STRING v10: protein-protein interaction networks, integrated over the
tree of life. Nucleic Acids Res. 2015;43:D447–52.
41. Kim KH, Dobi A, Shaheduzzaman S, Gao CL, Masuda K, Li H, et al.
Characterization of the androgen receptor in a benign prostate tissuederived human prostate epithelial cell line: RC-165N/human telomerase
reverse transcriptase. Prostate Cancer Prostatic Dis. 2007;10:30–8.
42. Yamada S, Pokutta S, Drees F, Weis WI, Nelson WJ. Deconstructing the
Cadherin-catenin-Actin complex. Cell. 2005;123:889–901.
43. Otey CA, Carpen O. Alpha-actinin revisited: a fresh look at an old player. Cell
Motil Cytoskeleton. 2004;58:104–11.
44. Hynes RO. Integrins: bidirectional, allosteric signaling machines. Cell. 2002;
110:673–87.
45. Sternberg PW, Schmid SL. Caveolin, cholesterol and Ras signalling. Nat Cell
Biol. 1999;1:E35–7.
46. Hill MM, Bastiani M, Luetterforst R, Kirkham M, Kirkham A, Nixon SJ, et al.
PTRF-Cavin, a conserved cytoplasmic protein required for caveola formation
and function. Cell. 2008;132:113–24.
47. Garg M, Braunstein G, Koeffler HP. LAMC2 as a therapeutic target for
cancers. Expert Opin Ther Targets. 2014;18:979–82.
48. Ponta H, Sherman L, Herrlich PA. CD44: from adhesion molecules to
signalling regulators. Nat Rev Mol Cell Biol. 2003;4:33–45.
Page 18 of 18
49. Sironen RK, Tammi M, Tammi R, Auvinen PK, Anttila M, Kosma VM.
Hyaluronan in human malignancies. Exp Cell Res. 2011;317:383–91.
50. Popowicz GM, Schleicher M, Noegel AA, Holak TA. Filamins: promiscuous
organizers of the cytoskeleton. Trends Biochem Sci. 2006;31:411–9.
51. Savoy RM, Ghosh PM. The dual role of filamin a in cancer: can't live with
(too much of) it, can't live without it. Endocr Relat Cancer. 2013;20:R341–56.
52. Timofeeva OA, Zhang X, Ressom HW, Varghese RS, Kallakury BV, Wang K,
et al. Enhanced expression of SOS1 is detected in prostate cancer epithelial
cells from African-American men. Int J Oncol. 2009;35:751–60.
53. Yang G, Addai J, Ittmann M, Wheeler TM, Thompson TC. Elevated caveolin-1
levels in African-American versus white-American prostate cancer. Clin
Cancer Res. 2000;6:3430–3.
54. Woodson K, Hayes R, Wideroff L, Villaruz L, Tangrea J. Hypermethylation of
GSTP1, CD44, and E-cadherin genes in prostate cancer among US blacks
and whites. Prostate. 2003;55:199–205.
55. Cavallaro U, Christofori G. Cell adhesion and signalling by cadherins and
Ig-CAMs in cancer. Nat Rev Cancer. 2004;4:118–32.
56. Cavallaro U, Christofori G. Multitasking in tumor progression: signaling
functions of cell adhesion molecules. Ann N Y Acad Sci. 2004;1014:58–66.
57. Iozzo RV, Sanderson RD. Proteoglycans in cancer biology, tumour
microenvironment and angiogenesis. J Cell Mol Med. 2011;15:1013–31.
Submit your next manuscript to BioMed Central
and we will help you at every step:
• We accept pre-submission inquiries
• Our selector tool helps you to find the most relevant journal
• We provide round the clock customer support
• Convenient online submission
• Thorough peer review
• Inclusion in PubMed and all major indexing services
• Maximum visibility for your research
Submit your manuscript at
www.biomedcentral.com/submit