Identification of cancer risk and associated behaviour: Implications for social marketing campaigns for cancer prevention
Bạn đang xem bản rút gọn của tài liệu. Xem và tải ngay bản đầy đủ của tài liệu tại đây (4.15 MB, 16 trang )
Kippen et al. BMC Cancer (2017) 17:550
DOI 10.1186/s12885-017-3540-x
RESEARCH ARTICLE
Open Access
Identification of cancer risk and associated
behaviour: implications for social marketing
campaigns for cancer prevention
Rebecca Kippen1* , Erica James2, Bernadette Ward1, Penny Buykx3, Ardel Shamsullah1, Wendy Watson4
and Kathy Chapman4
Abstract
Background: Community misconception of what causes cancer is an important consideration when devising
communication strategies around cancer prevention, while those initiating social marketing campaigns must decide
whether to target the general population or to tailor messages for different audiences. This paper investigates the
relationships between demographic characteristics, identification of selected cancer risk factors, and associated
protective behaviours, to inform audience segmentation for cancer prevention social marketing.
Methods: Data for this cross-sectional study (n = 3301) are derived from Cancer Council New South Wales’ 2013
Cancer Prevention Survey. Descriptive statistics and logistic regression models were used to investigate the
relationship between respondent demographic characteristics and identification of each of seven cancer risk factors;
demographic characteristics and practice of the seven ‘protective’ behaviours associated with the seven cancer risk
factors; and identification of cancer risk factors and practising the associated protective behaviours, controlling for
demographic characteristics.
Results: More than 90% of respondents across demographic groups identified sun exposure and smoking
cigarettes as moderate or large cancer risk factors. Around 80% identified passive smoking as a moderate/large risk
factor, and 40–60% identified being overweight or obese, drinking alcohol, not eating enough vegetables and not
eating enough fruit. Women and older respondents were more likely to identify most cancer risk factors as
moderate/large, and to practise associated protective behaviours. Education was correlated with identification of
smoking as a moderate/large cancer risk factor, and with four of the seven protective behaviours. Location
(metropolitan/regional) and country of birth (Australia/other) were weak predictors of identification and of
protective behaviours. Identification of a cancer risk factor as moderate/large was a significant predictor for five out
of seven associated cancer-protective behaviours, controlling for demographic characteristics.
Conclusions: These findings suggest a role for both audience segmentation and whole-of-population approaches
in cancer-prevention social marketing campaigns. Targeted campaigns can address beliefs of younger people and
men about cancer risk factors. Traditional population campaigns can enhance awareness of being overweight,
alcohol consumption, and poor vegetable and fruit intake as cancer risk factors.
Keywords: Cancer, Social marketing, Risk factors
* Correspondence:
1
School of Rural Health, Monash University, PO Box 666, Bendigo, VIC 3552,
Australia
Full list of author information is available at the end of the article
© The Author(s). 2017 Open Access This article is distributed under the terms of the Creative Commons Attribution 4.0
International License ( which permits unrestricted use, distribution, and
reproduction in any medium, provided you give appropriate credit to the original author(s) and the source, provide a link to
the Creative Commons license, and indicate if changes were made. The Creative Commons Public Domain Dedication waiver
( applies to the data made available in this article, unless otherwise stated.
Kippen et al. BMC Cancer (2017) 17:550
Background
In Australia, around one-third of cancer cases are due to
six modifiable lifestyle risks: tobacco use, ultraviolet
radiation exposure, inadequate diet, overweight and
obesity, alcohol consumption, and lack of physical
activity [1]. This reflects international research that finds
globally, around one-third of cancer deaths are due to
smoking, low fruit and vegetable intake, overweight and
obesity, alcohol consumption, and physical inactivity [2].
One obstacle that challenges cancer prevention is the
existing community scepticism that cancer can be prevented, [3] despite research indicating that only 5% of
cancers are hereditary [3, 4]. There is currently poor
community understanding of what causes cancer and
how to reduce risk [5, 6]. In an Australian study examining cancer patient beliefs surrounding the development
of cancer, almost half of respondents did not know what
factors contributed to their cancer, whilst few participants identified behavioural risks as causal factors [5].
Similarly, in a study investigating the beliefs and perceptions held by women regarding the causes of breast
cancer, results indicated that while most respondents
nominated factors that they believed contribute to the
development of breast cancer, a large number of these
factors are not supported by scientific evidence. The
authors conclude that such misunderstandings of the
causes of cancer could negatively affect the efficacy of
campaigns for cancer prevention [6].
Compared to tobacco and sun exposure, there is much
lower recognition of the carcinogenic effects of the other
main established lifestyle causes of cancer, especially
obesity, physical inactivity and alcohol [7–9]. Sun
exposure and diet show significant recognition in some
national surveys but not in others. One UK study that
examined public awareness of the associations with lifestyle of both cancer and heart disease found that awareness was significantly higher for the latter, with the
authors noting that the link between lifestyle factors and
cancer (bar lung cancer) has been publicised only recently [7]. In Australia, results from a series of surveys
largely parallel international findings, indicating high
awareness of the links between smoking and lung cancer
(96%) and sun exposure and melanoma (80%), but much
lower, although marginally improving, awareness of
other health-behaviour cancer risk factors [8]. The 2000
survey in this series found that fewer than 40% of people
believed that they could ‘greatly reduce’ their personal
risk of cancer. Awareness of lifestyle factors associated
with cancer were lower than for other common diseases
[8]. Knowledge of the cancer risks of too much alcohol
increased from 41% in 2006 to 48% in 2009, however
remained well below awareness that excessive drinking
could result in liver problems (98%) or being overweight
or obese (89%) [9].
Page 2 of 16
Community perceptions of avoidable cancer risk factors
are a vital consideration in the development of communication strategies for cancer prevention [5]. Public awareness of cancer risk is of significant importance if messages
about changing behaviour and engaging in screening are
to be seen as relevant by target groups. Whilst it is unrealistic to expect that public health campaigns could utterly
transform entrenched unhealthy lifestyles, they can make
a difference when their messages reach and are absorbed
by the public. Even modest improvements in health
behaviours, given the scale of the problem of unhealthy
lifestyles, can make a substantial improvement to population mortality and morbidity. International studies of
public awareness of cancer risks consistently show that
the primary problem is that many people have only patchy
appreciation of the gravity of cancer risks associated with
what may seem ‘normal’ lifestyles [6–8]. Multicomponent,
comprehensive health promotion is most likely to
effectively influence behaviour change [10] and this may
include social marketing campaigns.
Social marketing applies commercial marketing strategies to modify social behaviours for the benefit of the
community, including those behaviours related to public
health [11]. Methods are “drawn from behavioural theory,
persuasion psychology, and marketing science with regard
to health behaviour, human reactions to messages and
message delivery, and the ‘marketing mix’ or ‘four Ps’ of
marketing (place, price, product, and promotion)” [11, 12].
As a discipline, modern social marketing has started to incorporate the powerful tool set utilised by commercial
marketing professionals, such as analysing specific audiences and targeting them with customised messages [11].
Using mediums such as print media, television, radio,
digital media and billboards, health-related social marketing campaigns are implemented with intent of effecting
voluntary change in the health behaviours of large populations, often in part through provoking cognitive or
emotional responses within audiences as a result [13, 14].
Those initiating social marketing campaigns must
decide whether to target the general population or to
tailor messages for different audiences with differing
demographic, cultural, or behavioural characteristics [11].
Audience segmentation for cancer prevention may be
particularly important since there are geographical and social differences in cancer awareness and related health
outcomes. Social marketing therefore requires analysis of
the relationship between demographic characteristics,
current knowledge of cancer risk factors and current behaviours. This paper aims to investigate the relationship
between respondent demographic characteristics and
identification of seven cancer risk factors, and to determine whether respondents who identified a particular
cancer risk factor as ‘Moderate/large’ were more likely to
practise the recommended behaviour.
Kippen et al. BMC Cancer (2017) 17:550
Page 3 of 16
Methods
Data for this study are from the Cancer Prevention Survey
carried out in 2013 by Cancer Council New South Wales
(NSW) [see Additional file 1]. There were 3301 respondents to the 20-min survey, all of whom were adult
residents of NSW. Each respondent was randomised to
three of four cancer-prevention topics: sun protection
(n = 2474 respondents), tobacco control (n = 2473), nutrition (n = 2474) and alcohol (n = 2482) [15].
The sample was recruited by a market research company
from their participant database. An invitation to respond to
an online survey on personal health was emailed to 30,179
adults living in NSW. Of these, 5290 began the screening
questions. A total of 962 people were screened out because
quota limits for respondent age, sex, location and education
had been reached (n = 760), because they were undergoing
treatment for cancer (n = 123), or because they worked in
the advertising industry or in the manufacture or sale of
alcohol or tobacco products (n = 79). Another 983 began
the survey but did not complete it, and 44 responses were
omitted because they were completed in less than onethird of the median survey time or showed minimal
variability across scale items [15].
Identification of cancer risk factors
Demographic characteristics
1. Risk factor: spending time outdoors during peak UV
times without sun protection
Demographic characteristics of respondents included in
this study were sex (male/female), age (18–29 years,
30–49 years, 50 years and over), residential location
(metro/regional), education (up to year 10, year 11 or
12, diploma/certificate, university degree) and country
of birth (Australia/other). These questions were answered by all 3301 respondents. Responses were
weighted in the reported analyses so that the sample
reflected the distribution of the NSW adult population
by sex, age, location and education [15].
Respondent identification of cancer risk factors was captured through the question ‘How much do each of the
following things contribute to a person’s risk of getting
cancer?’, with scale responses ‘None’, ‘Slight’, ‘Moderate’
and ‘Large’, and an alternative option of ‘Don’t know’.
The list of cancer risk factors included the following
seven behavioural items (see also Table 1):
1. Spending time outdoors during peak ultraviolet
radiation (UV) times without sun protection
2. Smoking cigarettes
3. Passive smoking
4. Being overweight or obese
5. Drinking alcohol
6. Not eating enough vegetables
7. Not eating enough fruit
Behaviour
Each of these seven risk factors was matched with an
associated behaviour, self-reported by the respondent in
the survey, and coded as either a ‘protective’ or ‘risk’
behaviour. These are outlined below (see also Table 1).
Risk behaviour: Tried to get a tan from the sun or used
a solarium this summer
This behaviour was measured by responses to two
questions: ‘Which of the following things have you done
this summer?’—‘Used a solarium’; and ‘Which of the following things have you done this summer?’—‘Tried to
get a tan from the sun’. The survey was carried out at
the end of the Australian summer in February 2013.
Possible response categories were ‘Yes’, ‘No’ and ‘Don’t
Table 1 Seven cancer risk factors and associated risk and protective behaviours
Cancer risk factor
Risk behaviour
Protective behaviour
1. Spending time outdoors during
peak UV times without sun protection
1. Tried to get a tan from the sun
or used a solarium this summer
1. Sunsafe: Did not try to get a
tan from the sun nor used a
solarium this summer
2. Smoking cigarettes
2. Daily or occasional smoker
of cigarettes, cigars or pipes
2. Non-smoker: Does not smoke
cigarettes, cigars nor pipes
3. Passive smoking
3. Does not try to avoid places
where s/he may be exposed to
other people’s cigarette smoke
3. Avoid passive smoke: Tries to
avoid places where s/he may be
exposed to other people’s cigarette
smoke
4. Being overweight or obese
4. Body Mass Index (BMI) of 25 or more
4. Healthy weight: BMI of 18.5
to less than 25.0
5. Drinking alcohol
5. AUDIT-C score of 4 or more
for men and 3 or more for women
5. Lower risk alcohol intake: AUDIT-C
score of 0–3 for men and 0–2 for
women
6. Not eating enough vegetables
6. Eating fewer than five serves
of vegetables per day
6. 5+ vegetable serves: Eating five or
more serves of vegetables per day
7. Not eating enough fruit
7. Eating fewer than two serves of
fruit per day
7. 2+ fruit serves: Eating two or more
serves of fruit per day
Kippen et al. BMC Cancer (2017) 17:550
know’. Of the 2474 participants who answered these
questions, 1973 (79.7%) stated ‘No’ to both, while 501
(20.3%) said ‘Yes’ or ‘Don’t know’ to one or both questions. ‘Don’t know’ constituted 0.7% of responses to
‘Tried to get a tan from the sun’ and 1.1% of responses
to ‘Used a solarium’. Those who responded ‘No’ to both
questions were coded as exhibiting protective ‘Sunsafe
behaviour’ while the other 501 respondents were coded
as ‘Sun vulnerable behaviour’.
Page 4 of 16
drinking or alcohol abuse [17]. Questions on personal
alcohol consumption were asked of the 2482 survey participants randomised to the cancer-prevention topic around
alcohol, and answered by 2462 respondents, allowing
calculation of individual AUDIT-C scores. Following
Rubinsky et al., [18] scores of 4 or more for men and 3 or
more for women were coded as ‘Higher-risk alcohol intake’
(n = 1361, 55.3%). Scores of 0–3 for men and 0–2 for
women were coded as ‘Lower-risk alcohol intake’
(n = 1101, 44.7%).
2. Risk factor: smoking cigarettes
Risk behaviour: Daily or occasional smoker of cigarettes,
cigars or pipes
All survey participants were asked ‘Which of the following best describes your smoking status? This includes
cigarettes, cigars and pipes.’ with possible responses ‘I
smoke daily’, ‘I smoke occasionally’, ‘I don’t smoke now,
but I used to’, ‘I’ve tried it a few times, but never smoked
regularly’, and ‘I’ve never smoked’. The first two of these
responses were coded as ‘Smoker’ (n = 567, 17.2%) with
the last three coded as ‘Non-smoker’ (n = 2734, 82.8%).
6. Risk factor: not eating enough vegetables
Risk behaviour: Eating fewer than five serves of vegetables
per day
There were 2474 answers to the question ‘If a serve of
vegetables is equal to half a cup of cooked vegetables,
one medium potato or one cup of salad, how many
SERVES of vegetables do you eat each day, on average?’
with responses coded as ‘5 or more vegetable serves’
(n = 255, 10.3%) and ‘Less than 5 vegetable serves’
(n = 2219, 89.7%). This follows Australian government
guidelines for recommended daily vegetable intake [19].
3. Risk factor: passive smoking
Risk behaviour: Does not try to avoid places where s/he
may be exposed to other people’s cigarette smoke
This behaviour was coded from 2473 responses to the
statement ‘I try to avoid places where I may be exposed
to other people's cigarette smoke’. ‘Agree’ and ‘Strongly
agree’ were coded as ‘Avoids passive smoke’ (n = 1681,
68.0%) while ‘Disagree’, ‘Strongly disagree’, ‘Neither’ and
‘Don’t know’ were coded as ‘Does not avoid passive
smoke’ (n = 792, 32.0%).
7. Risk factor: not eating enough fruit
Risk behaviour: Eating fewer than two serves of fruit per day
This behaviour was coded from responses to ‘If a serve
of fruit is equal to one medium piece or two small pieces
of fruit, or one cup of diced fruit, how many SERVES of
fruit do you eat each day, on average?’. Of 2474 respondents, 1417 (57.3%) were coded as ‘2 or more fruit
serves’ and 1057 (42.7%) were coded as ‘Less than 2 fruit
serves’. This follows Australian government guidelines
for recommended daily fruit intake [19].
4. Risk factor: being overweight or obese
Risk indicator: Body Mass Index (BMI) of 25 or more
Height and weight were asked of all 3301 survey participants but reported by only 2790 respondents. BMI,
equal to [weight in kilograms]/[(height in metres)2],
was calculated for these respondents. Fifty respondents
(1.8%) with BMIs of less than 18.5 (‘Underweight’) were
excluded from analysis. Respondents with BMIs of 18.5
to less than 25.0 were coded as ‘Healthy weight’
(n = 1087, 39.0%). Respondents with BMIs of 25.0 or
greater were coded as ‘Overweight’ (n = 1653, 59.2%).
These BMI ranges for ‘Underweight’, ‘Healthy weight’
and ‘Overweight’ follow Australian Healthy Weight
guidelines [16].
5. Risk factor: drinking alcohol
Risk behaviour: AUDIT-C score of four or more for men
and three or more for women
The AUDIT-C (Alcohol Use Disorders—Identification
Test—Consumption) score measures alcohol consumption
on a scale from 0 to 12 and is designed to detect heavy
Analysis
Seven logistic regressions were conducted to investigate
the relationship between respondent demographic characteristics and identification of each of the seven cancer
risk factors as either ‘Moderate/large’ or ‘None/slight’
(with ‘Don’t know’ responses excluded). A second set of
logistic regressions was conducted to examine the
relationship between respondent demographic characteristics and the seven ‘protective’ behaviours outlined
in the previous section. Finally, a third set of regressions
were conducted to determine whether respondents who
identified a particular cancer risk factor as ‘Moderate/
large’ were more likely to practise the associated ‘protective’ behaviour than were respondents who identified
the risk factor as ‘None/slight’, controlling for demographic characteristics.
Results
Figures 1, 2, 3, 4, 5, 6, 7 show percentage distributions of
respondent identification of each of the seven cancer
Kippen et al. BMC Cancer (2017) 17:550
Page 5 of 16
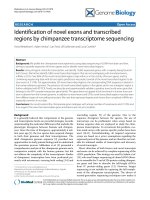
Fig. 1 How much does spending time outdoors during peak UV times without sun protection contribute to a person’s risk of getting cancer?
Responses by respondent demographic characteristics
Fig. 2 How much does smoking cigarettes contribute to a person’s risk of getting cancer? Responses by respondent demographic characteristics
Kippen et al. BMC Cancer (2017) 17:550
Page 6 of 16
Fig. 3 How much does passive smoking contribute to a person’s risk of getting cancer? Responses by respondent demographic characteristics
Fig. 4 How much does being overweight contribute to a person’s risk of getting cancer? Responses by respondent demographic characteristics
Kippen et al. BMC Cancer (2017) 17:550
Page 7 of 16
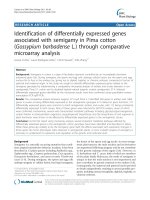
Fig. 5 How much does drinking alcohol contribute to a person’s risk of getting cancer? Responses by respondent demographic characteristics
Fig. 6 How much does not eating enough vegetables contribute to a person’s risk of getting cancer? Responses by respondent
demographic characteristics
Kippen et al. BMC Cancer (2017) 17:550
Page 8 of 16
Fig. 7 How much does not eating enough fruit contribute to a person’s risk of getting cancer? Responses by respondent
demographic characteristics
risk factors as ‘Large’, ‘Moderate’, ‘Slight’, ‘None’ or ‘Don’t
know’ by respondent demographic characteristics. Identification patterns show only minor differences across
demographic characteristics. The main differences were
between cancer risk factors, with greatest identification
of smoking, UV exposure and passive smoking as ‘large’
or ‘moderate’ risks, and least identification of not eating
enough fruit and vegetables (Fig. 8).
Figures 9, 10, 11, 12, 13, 14, 15, 16 show the percentage of respondents with ‘protective’ behaviours across
the seven factors associated with cancer risk, by
respondent demographic characteristics. Similar to the
pattern seen with cancer risk factors, differences were
greatest between behaviours than across demographic
characteristics. Respondents were most likely to report
sun protective behaviour (Fig. 9) and to be a nonsmoker (Fig. 10), and least likely to consume the
recommended daily intake of five or more vegetable
serves (Fig. 14).
The relationship between respondent characteristics
(sex, age, location, education and country of birth) and
odds of identifying each cancer risk factor as ‘Moderate/
large’ as opposed to ‘None/slight’ are shown in Table 2,
with a logistic-regression model for each of the seven
risk factors. Odds ratios are shown in the first column of
each model, and p-values in the second column, with pvalues of less than 0.05 considered to be significant.
Significant values are shaded.
Controlling for other factors, women were more likely
than men to identify UV exposure, smoking, passive
smoking, and drinking alcohol as moderate/large cancer
risk factors. In comparison to respondents aged 18–
29 years, those aged 50 years and over were more likely
to identify five of the seven items as moderate/large risk
factors. Those aged 30–49 years were less likely than
those aged 18–29 years to identify being overweight as a
moderate or large risk factor, but more likely to identify
not eating enough vegetables and not eating enough
fruit. Those living in regional areas of NSW were less
likely than those resident in metropolitan area (Sydney)
to identify being overweight as a moderate/large cancer
risk factor. Those with post-school education were more
likely than those with a Year 10 education or less to
identify smoking as a moderate/large cancer risk factor,
while those educated to Year 11 or 12 were less likely to
identify being overweight. No significant results were
found by country of birth.
Table 3 displays logistic regressions with respondent
characteristics (sex, age, location, education and country
of birth) as independent variables, and one of seven
‘protective’ behaviours—in relation to cancer risk
factors—forming the dependent variable in each of the
seven models. Female respondents were more likely than
their male counterparts to practise all the ‘protective’
behaviours, except for being ‘sunsafe’. Respondents aged
30–49 years were more likely than those under 30 years
Kippen et al. BMC Cancer (2017) 17:550
Page 9 of 16
Fig. 8 How much do each of the following things contribute to a person’s risk of getting cancer? Summary of responses for seven risk factors
to practise sunsafe behaviour, but less likely to be within
the healthy weight range. Respondents aged 50 years
and over were more likely than those aged 18–29 years
to practise sunsafe behaviour, to be non-smokers and to
avoid passive smoke, to have lower-risk alcohol intake
and to eat two or more fruit serves daily. However they
were also more likely to be overweight.
Those living in regional areas of New South Wales
were more likely to practise sunsafe behaviour and to
eat five or more daily vegetable servings, but less likely
Fig. 9 Percentage of respondents with ‘protective’ behaviour, by respondent demographic characteristics: sunsafe
Kippen et al. BMC Cancer (2017) 17:550
Page 10 of 16
Fig. 10 Percentage of respondents with ‘protective’ behaviour, by respondent demographic characteristics: non-smoker
to be within the healthy weight range. Respondents with
post-Year 10 education were more likely to be nonsmokers and to avoid passive smoke, those with Year 11
or 12 or a university degree were more likely to be
within the healthy weight range, and those with a
university degree were more likely to consume two or
more servings of fruit daily. Respondents born outside
Australia were more likely to be within the healthy
weight range and to eat two or more daily fruit serves.
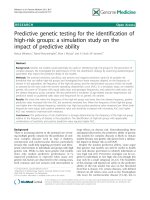
Table 4 shows relationships between identification of
cancer risk factors as moderate/large and associated
behaviours, controlling for respondent demographic
Fig. 11 Percentage of respondents with ‘protective’ behaviour, by respondent demographic characteristics: avoid passive smoke
Kippen et al. BMC Cancer (2017) 17:550
Page 11 of 16
Fig. 12 Percentage of respondents with ‘protective’ behaviour, by respondent demographic characteristics: healthy weight
characteristics. While women, older respondents and
more educated respondents were more likely to report
‘protective’ behaviours related to cancer risk factors, the
most important correlate of ‘protective’ behaviour across
the seven items was found to be identification of the
associated risk factor as moderate/large. Those who
identify UV exposure as a ‘moderate’ or ‘large’ risk factor
were more likely to report they did not try to get a tan nor
did they use a solarium over summer (‘Sunsafe’) (Model
15). Identification of cigarette smoking as a moderate/
large risk factor is correlated with being a non-smoker
(Model 16). Those who report passive smoking as a
Fig. 13 Percentage of respondents with ‘protective’ behaviour, by respondent demographic characteristics: lower-risk alcohol intake
Kippen et al. BMC Cancer (2017) 17:550
Page 12 of 16
Fig. 14 Percentage of respondents with ‘protective’ behaviour, by respondent demographic characteristics: five or more vegetable serves daily
‘moderate’ or ‘large’ cancer risk factor were more likely to
avoid exposure to others’ cigarette smoke (Model 17) even
when controlling for smoker status (Model 18). Identification of alcohol as a moderate/large risk factor was associated with lower-risk drinking patterns (Model 20).
Identification of not eating enough fruit as a moderate/
large risk factor was associated with a higher probability
of eating two or more serves of fruit daily (Model 22).
Risk-factor identification as moderate/large was the
greatest correlate for three of the seven ‘protective’
behaviours (‘Non-smoker’, ‘Avoid passive smoke’, and
‘Lower-risk alcohol intake’) and was significant for
Fig. 15 Percentage of respondents with ‘protective’ behaviour, by respondent demographic characteristics: two or more fruit serves daily
Kippen et al. BMC Cancer (2017) 17:550
Page 13 of 16
Fig. 16 Percentage of respondents with ‘protective’ behaviour, by respondent demographic characteristics: summary of seven
‘protective’ behaviours
two others (‘Sunsafe’ and ‘2+ fruit serves). It was not
a significant correlate for ‘Healthy weight’ nor ‘5+
vegetable serves’.
We ran other logistic-regression models to test
whether identification of a cancer risk factor remained
correlated with its associated ‘protective’ behaviour
even when controlling for identification of other risk
factors. We found that only identification of UV exposure was associated with sun protective behaviour;
identification of none of the other six cancer risk
factors was associated with sun protective behaviour.
Similarly, only identification of drinking alcohol as a
Table 2 Logistic regressions
Identification of seven cancer risk factors. How much do each of the following things contribute to a person’s risk of getting cancer? Odds ratios of ‘Moderate/
large’ response vs ‘None/Slight’ response (‘Don’t know’ excluded) by respondent characteristics
OR Odd ratio, p p-value, Ref cat Reference category, n sample number. p-values of less than 0.05 are shaded
Kippen et al. BMC Cancer (2017) 17:550
Page 14 of 16
Table 3 Logistic regressions
‘Protective’ behaviours by respondent characteristics
OR Odd ratio, p p-value, Ref cat Reference category, n sample number. p-values of less than 0.05 are shaded
risk factor was associated with lower-risk alcohol intake. Identification of both smoking cigarettes and
passive smoking as risk factors were associated with
being a non-smoker and avoiding passive smoking,
but not any other identifications. Broadly speaking,
this indicates that behaviour and beliefs about risk and
are specific to those single domains.
No risk factor identifications were correlated to being
a healthy weight nor with consuming five or more vegetable serves daily. In contrast, identification of passive
smoking, being overweight, drinking alcohol, not eating
enough vegetables, and not eating enough fruit were all
significantly associated with eating two or more serves
of fruit daily.
Table 4 Logistic regressions
‘Protective’ behaviours by respondent characteristics and identification of related cancer risk factors
OR Odd ratio, p p-value, Ref cat Reference category, n sample number. p-values of less than 0.05 are shaded
Kippen et al. BMC Cancer (2017) 17:550
Discussion
This is one of the first studies to use multivariate analysis
to examine the association between awareness of cancer
risk factors and health behaviours across seven lifestylemodifiable areas (sun exposure, smoking, passive smoking,
healthy weight, alcohol, vegetable consumption, and fruit
consumption). Increasing age was a significant predictor
of all cancer protective behaviours and a range of demographic characteristics were associated with awareness
and behaviours related to other cancer risk factors. After
controlling for demographic factors, except for healthy
weight and vegetable consumption, awareness of cancer
risk was a significant predictor of the associated cancer
protective behaviour.
The lack of correlation for healthy weight may have
been because of the complexity of contributors to maintaining a healthy weight, and lack of self-awareness of
weight status [20, 21]. The lack of correlation for ‘5+
vegetable serves’ may have been because so few respondents consumed this number of serves daily—less than
10%. When Model 21 was rerun with the dependent
variable as ‘3+ vegetable serves’ (some health bodies recommend 5 serves daily of vegetables and fruit together),
identification of ‘Not eating enough vegetables’ as a
cancer risk factor became a significant correlate, with an
odds ratio of 1.33 and a p-value of 0.001 (not shown).
Awareness is important
Cancer prevention activities require a range of complementary approaches. There are a plethora of health promotion models and theories that guide many successful
public health campaigns, and risk factor awareness is
known to be important in influencing attitudes and intentions [22, 23]. Participants in this study reported low levels
of awareness of four leading cancer risk factors: being
overweight or obese, drinking alcohol, not eating enough
vegetables, and not eating enough fruit (Figs. 4, 5, 6, 7).
Historically, the largest and most significant cancer
prevention campaigns in Australia have focused on UV
exposure, and tobacco and related smoke exposure. These
have resulted in significant improvements in community
knowledge [8, 9]. However, community understanding of
other risk factors remains poor [5–8, 24]. Cancer
survivors and community population studies consistently
report relatively high levels of awareness of the link
between cancer and hereditary and environmental risks,
but much lower levels of understanding about the role of
lifestyle factors [5–7]. Social marketing campaigns are an
effective approach in addressing such knowledge gaps and
misconceptions about cancer risk factors [11]. Social
marketing can change understanding and attitudes, and
reframe social norms, but by itself does not change
behaviour easily.
Page 15 of 16
Audience segmentation
Our findings suggest a role for audience segmentation
and whole-of-population approaches in social marketing
campaigns for cancer prevention. The link between each
risk factor and associated behaviour was consistently
significant amongst participants aged 50 years or more
but this was not the case for other groups. Women,
older people and to a lesser extent those with higher
education (see Table 2) were most likely to identify UV
exposure and cigarette smoking as cancer risk factors.
This suggests there is a role for targeted social marketing campaigns, particularly addressing the beliefs of
younger people and men about these risk factors. In
contrast, community awareness of the cancer risk associated with high body weight, low vegetable/fruit intake
and higher risk alcohol consumer was significantly lower
than awareness of UV exposure and smoking cigarettes
(see Table 2). There is a role for traditional population
social marketing campaigns to enhance the awareness of
these as cancer risk factors.
Limitations
Our study had limitations. The survey was only conducted in one Australian state, and out of 30,179 initial
email invitations, 10.9% of invitees completed the survey.
While this may imply a bias, previous research has
shown that response bias is minimised when considering
correlation between variables in multivariate models,
[25] as is the case in this study.
Study participants self-reported their behaviours. Thus
there is the possibility of social desirability bias; that is,
that respondents over-reported the positive behaviours
measured. We also do not know what people had in
mind when they identified risks as none, slight, moderate or large. We did not measure physical activity risk or
behaviours, nor ask about dietary fibre and red and
processed meat as other factors associated with cancer
risk. Further study including these data would enhance
our understanding of the relationship between these
factors and healthy weight and nutrition behaviours.
Conclusions
This study shows that there is high community awareness of UV exposure, smoking, and passive smoking as
cancer risk factors. There is lower awareness of the link
between cancer and being overweight, alcohol intake,
and low fruit and vegetable consumption. Males and
younger respondents are less likely to practise the behaviours that help protect against cancer. Since there is a
strong correlation between awareness of cancer risk factors
and practising the associated protective behaviours, these
findings suggest a role for both audience segmentation and
whole-of-population approaches in cancer-prevention social marketing campaigns. Targeted campaigns can address
Kippen et al. BMC Cancer (2017) 17:550
beliefs of younger people and men about cancer risk
factors. Traditional population campaigns can enhance
awareness of being overweight, alcohol consumption, and
poor vegetable and fruit intake as cancer risk factors.
Additional file
Additional file 1: 2013 Cancer Prevention Survey instrument. 2013
Cancer Council NSW Cancer Prevention Survey instrument. Extract of
survey questions from the 2013 Cancer Prevention Survey instrument.
This survey was conducted by Cancer Council New South Wales.
(PDF 413 kb)
Abbreviations
AUDIT-C: Alcohol use disorders—identification test—consumption; BMI: Body
mass index; NSW: New South Wales; UV: Ultraviolet radiation
Acknowledgements
We thank Kate Xu for research assistance and two reviewers for their
constructive suggestions.
Funding
This study was funded by Cancer Council NSW. Cancer Council NSW was
responsible for designing the survey instrument and commissioning a
market research company to conduct the survey and collect the data. Two
Cancer Council NSW staff—KC and WW—are co-authors on the manuscript,
with their contributions outlined below.
Availability of data and materials
The data that support the findings of this study are available from Cancer
Council NSW but restrictions apply to the availability of these data, which
were used under license for the current study, and so are not publicly
available. Data are however available from the authors upon reasonable
request and with permission of Cancer Council NSW.
Authors’ contributions
KC and WW contributed to the development of the survey instrument and
acquisition of data. KC, EJ, RK and BW participated in designing this study. RK
was responsible for data analysis. PB, EJ, RK, AS and BW contributed to
interpreting data. PB, KC, EJ, RK, AS and BW contributed to drafting the
manuscript. PB, KC, EJ, RK, BW and WW contributed to revising the
manuscript for important intellectual content. All authors give final approval
of the version to be published. Each author has participated sufficiently in
the co work to take public responsibility for appropriate portions of the
content. All authors agree to be accountable for all aspects of the work in
ensuring that questions related to the accuracy or integrity of any part of
the work are appropriately investigated and resolved.
Ethics approval and consent to participate
This study was approved by the Cancer Council NSW Ethics Committee, and
Monash University Human Research Ethics Committee (CF14/3853).
Participation in the online survey implied consent.
Consent for publication
Not applicable.
Competing interests
The authors declare that they have no competing interests.
Publisher’s Note
Springer Nature remains neutral with regard to jurisdictional claims in
published maps and institutional affiliations.
Author details
1
School of Rural Health, Monash University, PO Box 666, Bendigo, VIC 3552,
Australia. 2School of Medicine and Public Health, University of Newcastle,
University Drive, Callaghan, NSW 2308, Australia. 3School of Health and
Related Research, University of Sheffield, Regent Court, 30 Regent Street,
Page 16 of 16
Sheffield S1 4DA, UK. 4Cancer Council New South Wales, PO Box 572, Kings
Cross, Sydney, NSW 1340, Australia.
Received: 19 October 2016 Accepted: 10 August 2017
References
1. Whiteman DC, Webb PM, Green AC, Neale RE, Fritschi L, Bain CJ, et al.
Cancers in Australia in 2010 attributable to modifiable factors: summary and
conclusions. Aust N Z J Public Health. 2015;39:477–84.
2. Danaei G, Vander Hoorn S, Lopez AD, Murray CJL, Ezzati M, et al. Causes of
cancer in the world: comparative risk assessment of nine behavioural and
environmental risk factors. Lancet. 2005;366:1784–93.
3. Colditz GA, Wolin KY, Gehlert S. Applying what we know to accelerate
cancer prevention. Sci Transl Med. 2012;4:1–9.
4. Prevent Cancer Foundation: Preventable cancers. />prevention/preventable-cancers/#sthash.kxK5IcoG.pdf (n.d.). Accessed 18 Oct
2016.
5. Willcox SJ, Stewart BW, Sitas F. What factors do cancer patients believe
contribute to the development of their cancer? Cancer Causes Control.
2011;22:1503–11.
6. Thomson AK, Heyworth JS, Girschik J, Slevin T, Saunders C, Fritschi L. Beliefs
and perceptions about the causes of breast cancer: a case-control study.
BMC Res Notes. 2014;7:558.
7. Sanderson SC, Waller J, Jarvis MJ, Humphries SE, Wardle J. Awareness of
lifestyle risk factors for cancer and heart disease among adults in the UK.
Patient Educ Couns. 2009;74:221–7.
8. Paul C, Tzelepis F, Walsh RA, Girgis A, King L, McKenzie J. Has the
investment in public cancer education delivered observable changes in
knowledge over the past 10 years? Cancer. 2003;97:2931–9.
9. Cancer Institute NSW. Lifestyle and cancer: knowledge, attitudes and
behaviour in NSW 2009. Sydney: Cancer Institute NSW; 2012.
10. Talbot L, Verrinder G. Promoting health: the primary health care approach.
3rd ed. Sydney: Elsevier; 2005.
11. Evans WD. How social marketing works in health care. BMJ. 2006;332:1207–10.
12. Borden NH. The concept of the marketing mix. J Advert Res. 1964;4:2–7.
13. Gordon R, McDermott L, Stead M, Angus K. The effectiveness of social
marketing interventions for health improvement: what's the evidence?
Public Health. 2006;120:1133–9.
14. Wakefield MA, Loken B, Hornik RC. Use of mass media campaigns to
change health behaviour. Lancet. 2010;376:1261–71.
15. Buykx P, Gilligan C, Ward B, Kippen R, Chapman K. Public support for alcohol
policies associated with knowledge of cancer risk. Int J Drug Policy. 2015;26:371–9.
16. National Health and Medical Research Council. Clinical practice guidelines
for the management of overweight and obesity in adults, adolescents and
children in Australia. Canberra: Commonwealth of Australia; 2013.
17. Bush K, Kivlahan DR, McDonell MB, Fihn SD, Bradley KA. The AUDIT alcohol
consumption questions (AUDIT-C): an effective brief screening test for
problem drinking. Arch Intern Med. 1998;158:1789–95.
18. Rubinsky AD, Dawson DA, Williams EC, Kivlahan DR, Bradley KA. AUDIT-C
scores as a scaled marker of mean daily drinking, alcohol use disorder
severity, and probability of alcohol dependence in a U.S. general population
sample of drinkers. Alcohol Clin Exp Res. 2013;37:1380–90.
19. National Health and Medical Research Council. Australian dietary guidelines.
Canberra: Commonwealth of Australia; 2013.
20. Morley B, Wakefield M, Dunlop S, Hill D. Impact of a mass media campaign
linking abdominal obesity and cancer: a natural exposure evaluation. Health
Educ Res. 2009;24:1069–79.
21. Vandenbroeck P, Goossens J, Clemens M. Tackling obesities: future
choices—obesity system atlas. London: Government Office for Science; 2007.
22. Hill D, Wakefield M. Designing and evaluating population-wide campaigns. In:
Stewart BW, Wild CP, editors. World cancer report 201. Geneva: International
Agency for Research on Cancer, World Health Organization; 2014.
23. Fabrigar LR, Petty RE, Smith SM, Crites SL Jr. Understanding knowledge
effects on attitude–behaviour consistency: the role of relevance, complexity,
and amount of knowledge. J Pers Soc Psychol. 2009;90:556–77.
24. MacTiernan A, Fritschi L, Slevin T, Jalleh G, Donovan R, Heyworth J. Public
perceptions of cancer risk factors: a Western Australian study. Health Promot
J Austr. 2014;25:90–6.
25. Rindfuss RR, Choe MK, Tsuya NO, Bumpass LL, Tamaki E. Do low survey
response rates bias results? Evidence from Japan. Demogr Res. 2015;32:26.