Insulin-like growth factor 1 receptor affects the survival of primary prostate cancer patients depending on TMPRSS2-ERG status
Bạn đang xem bản rút gọn của tài liệu. Xem và tải ngay bản đầy đủ của tài liệu tại đây (2.17 MB, 12 trang )
Mancarella et al. BMC Cancer (2017) 17:367
DOI 10.1186/s12885-017-3356-8
RESEARCH ARTICLE
Open Access
Insulin-like growth factor 1 receptor affects
the survival of primary prostate cancer
patients depending on TMPRSS2-ERG status
Caterina Mancarella1†, Irene Casanova-Salas2†, Ana Calatrava3, Maria García-Flores2, Cecilia Garofalo1, Andrea Grilli1,
José Rubio-Briones4, Katia Scotlandi1* and José Antonio López-Guerrero2*
Abstract
Background: Prostate cancer (PCa) is characterized by clinical and biological heterogeneity and has differential
outcomes and mortality rates. Therefore, it is necessary to identify molecular alterations to define new therapeutic
strategies based on the risk of progression. In this study, the prognostic relevance of the insulin-like growth factor
(IGF) system was examined in molecular subtypes defined by TMPRSS2-ERG (T2E) gene fusion within a series of
patients with primary localized PCa.
Methods: A cohort of 270 formalin-fixed and paraffin-embedded (FFPE) primary PCa samples from patients
with more than 5 years’ follow-up was collected. IGF-1R, IGF-1, IGFBP-3 and INSR expression was analyzed using
quantitative RT-PCR. The T2E status and immunohistochemical ERG findings were considered in the analyses.
The association with both biochemical and clinical progression-free survival (BPFS and PFS, respectively) was
evaluated for the different molecular subtypes using the Kaplan-Meier proportional risk log-rank test and the Cox
proportional hazards model.
Results: An association between IGF-1R overexpression and better BPFS was found in T2E-negative patients
(35.3% BPFS, p-value = 0.016). Multivariate analysis demonstrated that IGF-1R expression constitutes an
independent variable in T2E-negative patients [HR: 0.41. CI 95% (0.2–0.82), p = 0.013]. These data were confirmed
using immunohistochemistry of ERG as subrogate of T2E. High IGF-1 expression correlated with prolonged BPFS
and PFS independent of the T2E status.
Conclusions: IGF-1R, a reported target of T2E, constitutes an independent factor for good prognosis in T2Enegative PCa. Quantitative evaluation of IGF-1/IGF-1R expression combined with molecular assessment of T2E
status or ERG protein expression represents a useful marker for tumor progression in localized PCa.
Keywords: Insulin-like growth factor 1 receptor, Prostate cancer, TMPRSS2-ERG, Prognosis, Molecular biotypes
Background
Prostate cancer (PCa) is the most common cancer in
men and the sixth cause of cancer death worldwide [1].
PCa is difficult to manage as it shows a spectrum of risk
over time spanning from indolent tumors, which can be
controlled with surgery or active surveillance, to tumors
* Correspondence: ;
†
Equal contributors
1
CRS Development of Biomolecular Therapies, Experimental Oncology Laboratory,
Rizzoli Orthopedic Institute, via di Barbiano, 1/10, 40136 Bologna, Italy
2
Laboratory of Molecular Biology, Fundación Instituto Valenciano de
Oncología, C/ Prof. Beltrán Báguena, 8, 46009 Valencia, Spain
Full list of author information is available at the end of the article
with aggressive and metastatic behavior that require
more radical treatment strategies [2]. Consequently,
there is an urgent clinical need for tools that can discriminate between the different conditions and stratify
patients at diagnosis according to tumor progression
risk. Established clinical and pathological prognostic factors, including serum PSA levels, Gleason score, lymph
node involvement and the pathological stages of affected
surgical margins, have proven useful but are insufficient
for optimal risk stratification. From the genetic point of
view, PCa can be considered a collection of cancers
characterized by sets of molecular alterations that may
© The Author(s). 2017 Open Access This article is distributed under the terms of the Creative Commons Attribution 4.0
International License ( which permits unrestricted use, distribution, and
reproduction in any medium, provided you give appropriate credit to the original author(s) and the source, provide a link to
the Creative Commons license, and indicate if changes were made. The Creative Commons Public Domain Dedication waiver
( applies to the data made available in this article, unless otherwise stated.
Mancarella et al. BMC Cancer (2017) 17:367
underlie the clinically variable behavior of the disease
and support the need to identify subgroups of patients
with different prognoses [3]. Recently, the prognostic
value of many molecular and genetic factors has been investigated, including the loss of PTEN or Akt mutations
[4–6]. The prognostic significance of the TMPRSS2-ERG
(T2E) fusion gene, a specific chromosomal rearrangement found in 50–70% of PCa that involves the
androgen-responsive promoter of TMPRSS2 and the
ETS transcription factor family gene ERG, has been evaluated, but the results are not conclusive [7–10]. The
recent application of deep-sequencing techniques has
led to a more comprehensive genomic portrait of localized and potentially curable PCa [11–13], further pointing out the multifocal genetic nature of PCa and the
presence of intra- and inter-tumor molecular heterogeneity that may affect tumor progression and response to
therapy [14].
In the past years, several studies have recognized the
prognostic role of some components of the insulinlike growth factor (IGF) system. The IGF system is
composed of three receptors [insulin receptor (INSR),
IGF-1 receptor (IGF-1R) and mannose 6-phosphate
receptor (M6P/IGF-2R)], three ligands (insulin, IGF-1,
IGF-2), and six known types of circulating IGF-binding
proteins (IGFBP1–6) that modulate the bioavailability and
bioactivity of the IGFs [15]. The IGF system has been reported to regulate normal and malignant growth, proliferation and differentiation, tissue homeostasis and cellular
metabolism. The relevance of the IGF system and particularly IGF-1R in cancer has been widely documented [16].
The first evidence regarding the IGF system’s role in PCa
came from epidemiological studies and showed that
higher serum IGF-1 concentrations and decreased circulating IGFBP-3 are correlated with an increased risk
of developing PCa [17]. In the prostate, IGF-1R plays a
critical role in normal gland growth and development
[18]. However, existing data regarding IGF system
expression and its functional role in PCa are still controversial [19–21]. Clinical studies evaluating the prognostic potential of IGF-1R are limited and report either
positive or negative associations between IGF-1R expression levels and patient outcome [22, 23]. In this
paper, we analyzed the expression of different components of the IGF system and their association with
clinico-pathological parameters and the prognosis of
biochemical progression-free survival (BPFS) and clinical progression-free survival (PFS) in a retrospective
series of 270 patients with primary localized PCa
treated with radical prostatectomy. In a previous study,
we demonstrated that the IGF system is influenced by
T2E as ERG directly binds the IGF-1R gene promoter,
thus affecting its expression in PCa [24]. This paper
shows for the first time that patients with PCa who do
Page 2 of 12
not harbor the T2E rearrangement and who express
low levels of IGF-1R represent a subgroup of primary
PCa tumors with poor outcome.
Methods
Clinical prostate specimens
Formalin-fixed and paraffin-embedded (FFPE) blocks
corresponding to radical prostatectomy specimens from
270 PCa patients were retrieved from the archives of the
Biobank of the Fundación Instituto Valenciano de Oncología according to the following criteria: specimens
obtained from radical retropubic prostatectomies from
1996 to 2002 and no history of previous treatment for
PCa (including androgen deprivation therapy or chemotherapy prior to surgery), as previously reported [25].
The clinico-pathological features of the PCa samples
analyzed in the study, including the T2E status, are
summarized in Table 1. T2E gene fusion status was determined using reverse transcription polymerase chain
reaction (RT-PCR) and fluorescent in situ hybridization
(FISH), as previously described [10], and quantitative
RT-PCR (qRT-PCR) as previously reported [25]. Briefly,
cases that presented the rearrangement based on any of
the three procedures (FISH, RT-PCR, qRT-PCR) were
considered positive. All the patients gave written informed consent for tissue donation for research purposes before tissue samples were collected, and the
study was approved by FIVO’s Institutional Ethical
Committee (ref. number 2010–19). The combined
Gleason score was uniformly determined by the same
uro-pathologist (Ana Calatrava), who also certified the
high-density cancer areas in hematoxylin and eosinstained slides to ensure a purity of at least 75% of cancer cells. For comparative and calibration purposes, we
also analyzed 8 samples of normal prostate tissue obtained from patients undergoing radical cystectomies
without pathological evidence of prostate disease.
Follow-up of the retrospective series ranged from 1 to
189 months (median 69 months). Biochemical progression (BPFS) was defined as serum PSA greater than
0.4 ng/ml during follow-up, and clinical progression
(PFS) was defined as local (prostatic fossa), regional
(lymph nodes) or distant (metastasis) progression.
Gene expression analysis
RNA isolation was performed from three 20-μm-thick
sections of FFPE tissues using RecoverAll™ Total
Nucleic Acid Isolation Kit (Ambion) following the manufacturer’s specifications. RNA with a 260/280 nm absorbance ratio of 1.5–2 was reverse transcribed with
the High Capacity cDNA Reverse Transcription Kit
(Applied Biosystems) according to the manufacturer’s
indications. Predesigned TaqMan probes (Applied Biosystems) for the target genes were used to determine
Mancarella et al. BMC Cancer (2017) 17:367
Page 3 of 12
qRT-PCR (n = 270)
IHC (n = 239)
No. Pts
%
No. Pts
%
comparative analyses of the PCa cases. Two replicates per
gene were considered. Relative quantification analysis was
determined using the mean value of the control samples
and the 2-ΔΔCt method [26].
≤ 55
15
5.6
12
5
Immunohistochemistry
56-65
81
30
72
30.1
66-75
138
51.1
122
51
> 75
36
13.3
33
13.8
The FFPE PCa specimens were incorporated into 11 tissue microarrays (TMA). Two or three representative
areas (1 mm in diameter) of each tumor were selected
for TMA production by first examining the hematoxylin
and eosin-stained prostatectomy tumor slides and then
sampling tissue from the corresponding paraffin blocks.
A tissue microarray instrument (Beecher Instruments)
was used for TMA assembly. All the cases included in
the different TMAs underwent immunohistochemistry
(IHC) analysis under the same conditions after the
optimization of a protocol developed at the Instituto
Valenciano de Oncología that ensured absence of background noise derived from the staining technique.
Within each TMA section, a series of positive (tonsil)
and negative controls (secondary antibody alone) were
included. Three-μm-thick sections from the TMA blocks
were stained using anti-human ERG clone EP111
monoclonal-Ab (Dako), and the percentage of ERGpositive cells was evaluated. The median percentage of
stained cells was calculated. Cases were scored as ERGnegative when the percentage of stained cells was less
than the median value and ERG-positive when the percentage of stained cells was equal to or more than median
value. The clinico-pathological features of the PCa samples analyzed in the study are summarized in Table 1.
Table 1 Clinico-pathological features of the patients included in
the study
Parameter
Age
Gleason-sp
2-6
109
40.4
87
36.4
7
129
47.8
123
51.5
Greater than 7
32
11.9
29
12.1
PSA (ng/ml)
10 or less
155
57.6
133
55.9
10-20
74
27.5
69
29
Greater than 20
40
14.9
36
15.1
cT
cT2b or less
248
92.2
219
92
cT3a or greater
21
7.8
19
8
pT2 or less
135
50
115
48.1
pT3 or greater
135
50
124
51.9
pN0
236
95.2
209
95.4
pN1 or greater
12
4.8
10
4.6
Negative
137
50.7
116
48.5
Positive
133
49.3
123
51.5
Negative
92
34.1
105
48.8
Positive
178
65.9
110
51.2
pT
pNa
Margins
TMPRSS2/ERGb,c
SP, specimen; cT, clinical stage; PSA, prostatic specific antigen; pN, lymphnode
pathological stage
a
Lymphadenectomy was limited to the obturator fossa in most of the cases at
the inclusion period.
b
Values in qRT-PCR columns refer to TMPRSS2-ERG status determined using
reverse transcription polymerase chain reaction (RT-PCR), fluorescent in situ
hybridization (FISH), and quantitative RTPCR (qRT-PCR); values in IHC columns
refer to immunohistochemical ERG evaluation
c
IHC ERG expression was not detectable in 24/239 cases
their expression level using quantitative RT-PCR (qRTPCR) and an ABI 7500-Fast Thermocycler Sequence Detection System (Applied Biosystems). The probes included
IGF-1R (Hs00181385_m1), INSR (Hs00961560_m1),
IGFBP-3 (Hs00426287_m1), IGF-1 (Hs00153126_m1),
IGF-2 (Hs04188276_m1), and T2E (Hs03063375_ft). For
endogenous control, β-2-microglobulin (Hs99999907_m1)
was used (Applied Biosystems). cDNA from normal
human prostate samples was used as a calibrator for
Statistical analysis
The association between gene expression levels and clinicopathological parameters (categorical) was assessed using
Fisher’s exact test or the chi-square test, as appropriate.
The impact of biological factors on BPFS and PFS was determined using Kaplan-Meier curves and the log-rank test.
BPFS and PFS were considered individually from the date
of surgery to the date of the event. Candidate predictors of
BPFS and PFS were entered into a Cox proportional hazard
model using stepwise selection to identify significant outcome predictors. The 95% confidence intervals (CI) of hazard ratios (HRs) are provided [27]. Statistical analyses were
performed with SPSS® software, version 20.0. P-values less
than or equal to 0.05 were considered significant.
Results
Gene expression profile of the IGF system in primary
prostate cancer and its association with prognosis
The expression of insulin-like growth factor-1 receptor
(IGF-1R), insulin receptor (INSR), insulin-like growth
factor-1 (IGF-1), insulin-like growth factor-2 (IGF-2) and
Mancarella et al. BMC Cancer (2017) 17:367
insulin-like growth factor-binding protein-3 (IGFBP-3)
in a retrospective series of 270 primary prostate cancer
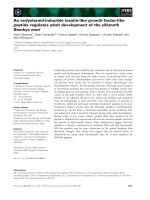
(PCa) specimens was evaluated using quantitative RTPCR (qRT-PCR) (Fig. 1) and compared with normal
prostate tissues. No IGF-2 expression was detected in
any of the analyzed cases. As previously reported [24],
no differential expression compared with the normal
prostate was found for IGF-1R (median = 1.04;
range = 0.07–5.12); 48.9% of the patients showed a relative quantity (RQ) expression less than 1. INSR was substantially down-regulated in the tumor samples
(median = 0.58; range = 0.01–471.75; RQ < 1 in 84.2%
of cases), as was IGFBP-3 (median = 0.52; range = 0.05–
2.96; RQ < 1 in 80.7% of cases). A weak down-regulation
of IGF-1 was observed (median = 0.61; range = 0.01–
50.12; RQ < 1 in 69.1% of cases). Patients were classified
as high- or low-expressers, depending on whether the
obtained RQ values were above or below the first quartile (Additional file 1) and relation with patient prognosis was evaluated using Kaplan-Meier survival curves
and log-rank tests (Table 2). The median follow-up
periods of the series were 69 months (from 1 to
189 months) and 82 months (from 1 to 189 months) for
biochemical progression-free survival (BPFS) and
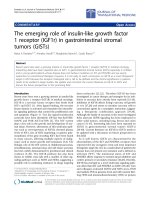
progression-free survival (PFS), respectively. The analysis
revealed a statistically significant association between
high IGF-1 expression and a better BPFS or PFS, while a
trend in the statistical association was observed between
high IGF-1R expression and a better BPFS (Fig. 2).
Page 4 of 12
According to other studies [28], TMPRSS2-ERG (T2E)
rearrangements did not provide any information from a
prognostic point of view. Multivariate analysis confirmed
the statistical value of IGF-1 as predictor of good prognosis for BPFS [HR = 0.60. CI 95% (0.39–0.90), p = 0.015]
(Table 2). The association between IGF-1R, INSR, IGF-1,
and IGFBP-3 expression and clinico-pathological characteristics was analyzed (Additional file 2). In addition to the
previously reported association between IGF-1R and T2E
expression indicating that patients harboring the fusion
gene show higher IGF-1R mRNA levels than T2E-negative
cases (p-value = 0.008, Fisher’s test) [24], IGF-1 expression was decreased in advanced PCa cases (Gleason
score 7 or greater, p-value < 0.0001; PSA 10 ng/ml or
greater, p-value = 0.01; clinical stage (cT) 3a or greater,
p-value = 0.001; pathological stage (pT) 3 or greater, pvalue = 0.005; lymphnode pathological stage (pN) 1 or
greater, p-value < 0.0001; Fisher’s or chi-square tests).
Clinical relevance of IGF system components in T2E
molecularly defined prostate cancer
Since IGF-1R was associated with the presence of T2E
[24], our series was divided according to the T2E fusion
gene status. Thus, two cohorts of patients were identified: a T2E–negative (92 cases) and a T2E-positive (178
cases) cohort (Additional file 1). For each cohort,
patients were defined as high- or low-expressers according to first quartile RQ values. We found that IGF-1R
expression was decreased in advanced T2E-negative PCa
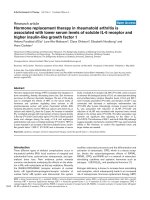
Fig. 1 IGF system expression profile in PCa. The differential expression of IGFBP-3, IGF-1, IGF-1R and INSR between PCa and prostate normal tissues
was analyzed in 270 FFPE primary PCa samples using qRT-PCR following the 2-ΔΔCt method. Black lines mark the median values
Mancarella et al. BMC Cancer (2017) 17:367
Page 5 of 12
Table 2 BPFS and PFS log rank and Cox regression tests in primary PCa analyzed by qRT-PCR
Total cases
Parameter
Biochemical progression
n
Events
(% BPFS)
Age
p-Univariate
Clinical Progression
HR (95% CI)
p-Multivariate
Events
(% PFS)
0.165
15
5 (73.3)
3 (79.4)
56-65
81
43 (25.7)
29 (50.1)
66-75
138
58 (45.4)
34 (69.8)
> 75
36
18 (48.6)
8 (59.2)
109
35 (56.4)
2-6
HR (95% CI)
p-Multivariate
0.379
≤ 55
Gleason-sp
p-Univariate
< 0.0001
0.001
1
< 0.0001
0.015
17 (77.3)
1
7
129
63 (29.8)
2.94 (1.64-5.26)
< 0.0001
43 (57.4)
3.03 (1.4-6.53)
0.005
Greater than 7
32
25 (11.7)
1.93 (1.18-3.16)
0.008
14 (0)
1.57 (0.83-2.96)
0.163
155
57 (47.8)
1
0.002
PSA (ng/ml)
10 or less
< 0.0001
0.011
1
0.09
35 (68.6)
10-20
74
37 (39.2)
2.12 (1.29-3.48)
0.003
24 (53.6)
Greater than 20
40
29 (24.4)
1.72 (1.03-2.88)
0.036
15 (57.1)
cT2b or less
248
107 (43)
cT3a or greater
21
16 (14.5)
cT
< 0.0001
pT
0.013
1
1.72 (1.03-3.67)
< 0.0001
0.029
66 (63.1)
8 (58.6)
NS
0.001
pT2 or less
135
43 (57.4)
25 (77.9)
pT3 or greater
135
80 (23)
49 (48.4)
pN0
236
104 (43)
pN1 or greater
12
11 (8.3)
pN
< 0.0001
Margins
0.043
1
NS
0.2
64 (63.6)
1.98 (1.02-3.84)
< 0.0001
2.46 (1.38-4.4)
5 (50.9)
0.001
< 0.0001
0.039
Negative
137
40 (56)
1
24 (77)
1
Positive
133
83 (21.4)
2.14 (1.39-3.32)
50 (41.6)
1.74 (1.02-2.95)
Negative
92
49 (32.5)
Positive
178
74 (45.2)
TMPRSS2-ERG
0.105
IGF-1R
0.957
26 (63.9)
48 (61.6)
0.046
NS
0.835
Low
67
34 (45.3)
17 (70.3)
High
203
89 (41.9)
57 (61.4)
Low
66
29 (52.1)
High
199
92 (38.3)
INSR
0.987
IGF-1
0.632
17 (69.9)
57 (59.5)
< 0.0001
0.015
0.002
Low
67
44 (18.2)
1
26 (41.5)
High
202
78 (48)
0.60 (0.39-0.90)
47 (68.6)
Low
67
31 (45.9)
17 (61.3)
High
203
92 (39.5)
57 (62.9)
IGFBP-3
0.717
0.943
NS
Mancarella et al. BMC Cancer (2017) 17:367
Page 6 of 12
Fig. 2 Prognostic value of IGFBP-3, IGF-1, IGF-1R and INSR for the survival of PCa patients. High-expression (H) and low-expression (L) samples were
defined according to the first quartile values of RQ. Survival curves were compared using the log-rank test. Time scale refers to months from
diagnosis. BPFS, biochemical progression-free survival; PFS, clinical progression-free survival. The number of patients at risk among the high- (top)
and low-expression (bottom) samples are listed above each time interval
cases (pT3 or greater, p-value = 0.05, Fisher’s exact test;
Additional files 3 and 4). In the T2E-negative subgroup,
the median follow-up was 65 months (from 1 to
151 months) or 82 months (from 2 to 151 months) for
BPFS and PFS, respectively. In the T2E-positive subgroup,
the median follow-up was 70 (from 1 to 189 months) or
81 months (from 1 to 189 months) for BPFS and PFS, respectively. Log-rank test analysis showed that IGF-1R was
a significant predictor of prognosis in T2E-negative
patients (p-value = 0.016, Additional file 5) but not in
T2E-positive patients (Additional file 6); additionally, low
IGF-1R expression conferred a worse prognosis for BPFS
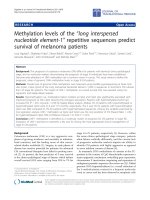
in T2E-negative patients (Fig. 3). Multivariate analysis
showed that high IGF-1R represented a significant predictor of good prognosis in the T2E-negative cohort [HR:
0.41. CI 95% (0.2–0.82), p = 0.013] (Additional file 5).
IGF-1 expression was decreased in the T2E-negative advanced PCa cases (cT3a or greater, p-value < 0.0001; pN1
or greater, p-value = 0.037; Fisher’s exact test; Additional
file 3) and in the T2E-positive cases (pT3 or greater, pvalue = 0.037; pN1 or greater, p-value = 0.004; Fisher’s
exact test; Additional file 4). IGF-1 was associated with
BPFS and PFS in both T2E subgroups (Fig. 3). The multivariate analysis showed that IGF-1 constituted a
Mancarella et al. BMC Cancer (2017) 17:367
Page 7 of 12
Fig. 3 Prognostic value of IGF-1 and IGF-1R in subtypes of PCa patients defined by T2E. First quartile values of RQ were separately calculated
for the T2E–negative (top) and T2E-positive (bottom) groups, and the samples were classified as high-expressers (H) and low-expressers (L).
Time scale refers to months from diagnosis. Black lines indicate high-expression patients. BPFS, biochemical progression-free survival; PFS,
clinical progression-free survival. The number of patients at risk in the high- (top) and low-expression (bottom) samples is listed above each
time interval
prognostic factor regardless of the T2E status [T2Epositive: HR = 0.47. CI 95% (0.27–0.79), p = 0.005;
T2E-negative: HR = 0.49. CI 95% (0.24–0.98),
p = 0.045] (Additional files 5 and 6).
ERG immunohistochemistry correlates with the molecular
detection of T2E status
Considering the existence of reliable ERG antibodies,
immunohistochemistry (IHC) analysis was performed on
Mancarella et al. BMC Cancer (2017) 17:367
239 PCa samples (Additional file 7) from the same series
of 270 cases to assess whether ERG IHC evaluation
could be used as a surrogate marker for molecular T2E
detection (Table 1). The patients were divided according
to ERG protein expression levels, and two groups of patients were identified: an ERG-negative group (105 cases,
Additional file 8) and an ERG-positive group (110 cases,
Additional file 9; Fig. 4a). The T2E expression in each
tumor was measured as reported in the Methods section
and then compared to the ERG IHC status. A statistically significant correlation between ERG protein expression and T2E status (p-value < 0.0001; Fisher’s test) was
found, thus showing that ERG IHC can serve as a surrogate marker for T2E rearrangement. ERG did not represent
a prognosis biomarker in our series (Additional file 7).
ERG immunohistochemistry identifies the subgroup of
ERG-negative prostate cancer patients where IGF-1R
influences prognosis
Using ERG IHC, we performed a log-rank analysis of
IGF-1R in the ERG-negative (Additional file 8) and
ERG-positive (Additional file 9) subpopulations. Cases
were defined as high- or low-expressers depending on
whether the obtained IGF-1R RQ values calculated for
each cohort of patients were above or below the first
quartile. The median durations of follow-up for the
ERG-negative subgroup were 60 months (from 1 to
145 months) and 77 months (from 2 to 145 months)
considering BPFS and PFS, respectively. The median durations of follow-up for the ERG-positive subgroup were
70 months (from 1 to 189 months) or 82 months (from
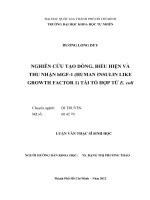
9 to 189 months) considering BPFS and PFS, respectively. The analyses confirmed that high IGF-1R gene
expression was associated with a good prognosis in the
ERG-negative patients with statistically longer BPFS and
PFS (p-value < 0.0001 and p-value = 0.02, respectively)
compared with those with low IGF-1R gene expression;
however, IGF-1R was not associated with survival in the
ERG-positive subgroup (p-value > 0.5; Fig. 4b). Multivariate analysis showed that IGF-1R represented a significant predictor of good BPFS [HR = 0.30. CI 95%
(0.16–0.57), p = 0.001] in ERG-negative patients. The association between IGF-1R and clinico-pathological parameters in these subgroups of patients is shown in
Additional files 10 and 11.
Discussion
Although the relationship between the IGF axis and
PCa risk and progression has been extensively studied,
consensus is still needed. The discordance among studies is putatively due to different factors including i)
composition of the analyzed series, ii) technical bias
and iii) disregarded molecular mechanisms influencing
IGF activity.
Page 8 of 12
The findings reported in this study support a relationship between high IGF-1 and IGF-1R mRNA expression
and favorable outcomes. Overall, the results are in contrast with the common view of IGF-1R as a marker of
aggressiveness; however, previous studies of sarcomas
and carcinomas reported similar results. In Ewing
sarcoma, lower IGF-1 circulating levels were found in
patients with metastatic disease [29], while in a cohort
of 57 patients, a relationship between high IGF-1R and
IGF-1 expression and favorable prognosis was found
[30]. In breast cancer, lower expression of IGF-1R was
found in tumor specimens than in matched control samples [31], and positive IGF-1R expression was associated
with favorable prognosis [32]. Hence, our results are in
line with evidence that the IGF-1R/IGF-1 axis is not an
oncogenic driver in primary PCa. Plymate et al. demonstrated that restored expression of IGF-1R in malignant
prostate cells slowed down growth both in vitro and in
vivo [33], while an in vivo study by Sutherland et al.
showed that conditional prostate-specific IGF-1R
knockout caused cell proliferation, hyperplasia and the
emergence of aggressive PCa when p53 activity was
compromised [34]. Furthermore, Massoner et al. demonstrated that the IGF axis is up-regulated during normal epithelial differentiation in vitro [35]. In this study,
we confirmed that up-regulation of IGF-1/IGF-1R signaling in local PCa is associated with a less aggressive
phenotype.
Although recent advancements in next-generation sequencing technology have improved our understanding
of the biology of prostate tumors [12], emphasizing the
genetic basis of clinical variability of the disease, the
impact of the molecular heterogeneity of PCa on the
IGF axis has never been considered at clinical level. The
genetic heterogeneity of PCa has become recently clear,
and the molecular classification of PCa is helping to
move towards a direct application of the personalized
medicine concept. In this context, the presence of
tumor-specific chromosomal translocations may have a
crucial role. In 2005, Tomlins et al. first described the rearrangements of the ETS family of transcription factors
(TMPRSS2-ERG) in approximately 50% of all PCa patients [36]. Since their discovery, these fusion genes have
represented a powerful diagnostic biomarker. However,
the prognostic significance of T2E is still controversial.
Several authors have suggested an association between
T2E and more aggressive tumor behavior and poor
prognosis [37, 38]. In contrast, other studies have reported an association between T2E and favorable outcome, and still others did not find any association
between T2E and patient survival [10, 39, 40]. In this
study, we did not identify any prognostic relevance for
the expression of T2E, a finding that is in line with a recent study that enrolled more than 1000 patients [41].
Mancarella et al. BMC Cancer (2017) 17:367
Page 9 of 12
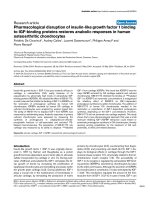
Fig. 4 Immunohistochemical evaluation of ERG expression in 239 PCa specimens. a, Representative immunohistochemistry images for ERG with
low expression (ERG-negative, top panels) and high expression (ERG-positive, bottom panels) in PCa tissue array samples (magnification, ×20);
b, the first quartile value of IGF-1R RQ was separately calculated for the ERG–negative (top) and ERG-positive (bottom) groups, and the samples
were classified as high-expression (H) and low-expression (L). Time scale refers to months from diagnosis. Black lines indicate high-expressing
patients. BPFS, biochemical progression-free survival; PFS, clinical progression-free survival. The number of patients at risk in the high- (top) and
low-expression (bottom) samples is listed above each time interval
Nevertheless, when analyzing the expression of IGF system components according to the presence or absence
of the T2E rearrangement, a difference in the value of
IGF-1R expression as an indicator of disease progression
was observed. Interestingly, these data were obtained
not only dividing patients according to T2E status established using gold standard methods (PCR methods and/
or FISH) but also as a result of ERG IHC evaluation. Accordingly to other studies [8, 42, 43], ERG IHC
evaluation represents a reliable surrogate for T2E detection and is simpler and cheaper than molecular techniques. T2E was previously reported to influence the
prognostic value of other genes. In this context, the
prognostic value of SPOP was found to be statistically
significant in the subgroup of patients not expressing
the fusion gene [25]. In another study, high NBS1 gene
expression was associated with BPFS in a subgroup of
T2E-negative and PTEN non-deleted PCa patients [44].
Mancarella et al. BMC Cancer (2017) 17:367
The dependence of IGF-1R’s prognostic value on T2E
status may partly explain the controversial evidence
regarding the role of IGF-1R in PCa progression. The
cellular genetic background may be relevant to modulate
IGF-1R signaling and functions. In fact, IGF-1R functions may be affected by complex cross-talk with other
signaling pathways and by direct interactions of IGF-1R
with other cell surface receptors, such as the recently
discovered connection with discoidin domain receptor 1
[45]. Several papers have demonstrated that aberrant
expression of ERG alters the cellular transcriptional pattern, conferring a new phenotype characterized by an
increased proliferation rate and/or invasiveness and decreased differentiation levels [46–48]. The association
between the IGF system and T2E rearrangement is not
yet completely understood. The SWI/SNF chromatin remodeling complex, which high expression correlates
with a prolonged disease-free survival in PCa patients,
was demonstrated to both down-regulate transcription
of TMPRSS2 and therefore the fusion gene and to sustain IGF-1 expression [49–51]. Recent evidences demonstrated an interaction between the IGF system and T2E
by identifying IGF-1R as a direct target of T2E [24, 52].
The reported clinical evidence indicates that T2E, with
its wide spectrum of alterations, may counteract the putative beneficial effects conferred by IGF-1R expression,
likely addressing cancer cells toward a less differentiated,
more aggressive phenotype.
Conclusions
The results of this study provide new criteria for the
classification of primary PCa patients based on contemporary assessment of T2E and quantification of IGF-1R
expression. Particularly, the combination of an absence
of T2E and low expression of IGF-1R identifies a group
of patients with a poor prognosis who could benefit
from a more severe treatment regimen. In addition, the
data suggest an economic approach to patient stratification based on IHC ERG and IGF-1R evaluation. These
results further support the importance of T2E for classifying the distinct biological entities associated with different risks of progression and prognosis. In conclusion,
we believe these results provide a path toward more precisely establishing specific subtypes of PCa with distinct
outcomes.
Additional files
Additional file 1: IGFBP-3, IGF-1, IGF-1R and INSR RQ values of 270 PCa
cases and different T2E-defined molecular subtypes. (XLS 79 kb)
Additional file 2: Association between IGF system components and
clinico-pathological parameters according to Fisher’s or chi-square tests
(when more than 2 categories were present) in 270 cases. (DOC 39 kb)
Page 10 of 12
Additional file 3: Association between IGF system components and
clinico-pathological parameters according to Fisher’s or chi-square tests (when
more than 2 categories were present) in T2E-negative cases. (DOC 38 kb)
Additional file 4: Association between IGF system components and
clinico-pathological parameters according to Fisher’s or chi-square tests (when
more than 2 categories were present) in T2E-positive cases. (DOC 38 kb)
Additional file 5: BPFS and clinical PFS log-rank and Cox regression
tests in T2E-negative PCa patients analyzed with qRT-PCR. (DOC 80 kb)
Additional file 6: BPFS and clinical PFS log-rank and Cox regression
tests in T2E-positive PCa patients analyzed with qRT-PCR. (DOC 83 kb)
Additional file 7: BPFS and clinical PFS log-rank and Cox regression
tests in primary PCa patients analyzed with IHC. (DOC 72 kb)
Additional file 8: BPFS and clinical PFS log-rank and Cox regression
tests in ERG-negative PCa patients analyzed with IHC. (DOC 69 kb)
Additional file 9: BPFS and clinical PFS log-rank and Cox regression
tests in ERG-positive PCa patients analyzed with IHC. (DOC 71 kb)
Additional file 10: Association between IGF-1R and clinico-pathological
parameters according to Fisher’s or chi-square tests (when more than 2
categories were present) in ERG-negative cases. (DOC 32 kb)
Additional file 11: Association between IGF-1R and clinico-pathological
parameters according to Fisher’s or chi-square tests (when more than 2
categories were present) in ERG-positive cases. (DOC 32 kb)
Abbreviations
BPFS: Biochemical progression-free survival;; CI: Confidence interval;
cT: Clinical stage; FFPE: Formalin-fixed and paraffin-embedded;
FISH: Fluorescent in situ hybridization; HR: Hazard ratio; IGF: Insulin-like
growth factor; IGF-1R: IGF-1 receptor; IGFBP-3: IGF-binding protein 3;
IHC: Immunohistochemistry; INSR: Insulin receptor; PCa: Prostate cancer;
PFS: Clinical progression-free survival; pN: Lymph node pathological stage;
PSA: Prostate specific antigen; pT: Pathological stage; qRTPCR: Quantitative RT-PCR; RQ: Relative quantity; SP: Specimen;
T2E: TMPRSS2-ERG; TMA: Tissue microarray
Acknowledgements
The authors thank Tania Mazcuñán Vitiello and Patricia Carretero Hinojosa for
technical assistance and the Biobank of the Fundación Instituto Valenciano
de Oncología for providing the biological samples for the analysis. We thank
Cristina Ghinelli for figures editing.
Funding
The Italian Ministry of Research and Instruction (F.I.R.B. project number:
RBAP11884 M_005) provided support for reagents and personnel (Caterina
Mancarella, 2015). The Italian Association for Cancer Research (Katia Scotlandi
- AIRC Project N.14049) provided partial covering of personnel costs (Andrea
Grilli, Cecilia Garofalo) and support in manuscript editing. The Instituto de
Salud Carlos III (PI10/01206 and FPI11/00505), Madrid, Spain, provided
support for sample collection (PI10/01206) and personnel (FPI11/00505:
Irene Casanova-Salas). The Asociación Contra el Cáncer de Algemesí (Spain)
provided support for manuscript editing and PROMETEO/2016/103 from the
Conselleria d’Edicació, Investigació, Cultura I Esport of the Generalitat Valenciana
(Spain) supported reagents and materials costs. Caterina Mancarella was
awarded the “Guglielmina Lucatello e Gino Mazzega” fellowship granted
by Fondazione Italiana per la Ricerca sul Cancro- FIRC (FIRC project code:
17,984; 2016–2017).
Availability of data and materials
All data generated or analyzed during this study are included in this
published article and its supplementary information files. Additional information
may be available from the corresponding authors on reasonable request.
Authors’ contributions
Conception or design of the work: CM, ICS, KS, JALG. Acquisition of data: CM,
ICS, AC, MGF, JRB. Analysis and interpretation of data: CM, ICS, CG, AG, JRB,
KS, JALG. Drafting or revising the work: CM, ICS, KS, JALG. All the authors
read and approved the final manuscript.
Mancarella et al. BMC Cancer (2017) 17:367
Competing interests
The authors declare that they have no competing interests.
Consent for publication
Not applicable.
Ethics approval and consent to participate
All the patients gave written informed consent for tissue donation for
research purposes before tissue samples were collected, and the study was
approved by Institutional Ethical Committee of Fundación Instituto
Valenciano de Oncología (ref. number 2010–19).
Publisher’s Note
Springer Nature remains neutral with regard to jurisdictional claims in
published maps and institutional affiliations.
Author details
1
CRS Development of Biomolecular Therapies, Experimental Oncology Laboratory,
Rizzoli Orthopedic Institute, via di Barbiano, 1/10, 40136 Bologna, Italy. 2Laboratory
of Molecular Biology, Fundación Instituto Valenciano de Oncología, C/ Prof.
Beltrán Báguena, 8, 46009 Valencia, Spain. 3Department of Pathology, Fundación
Instituto Valenciano de Oncología, C/ Prof. Beltrán Báguena, 8, 46009 Valencia,
Spain. 4Department of Urology, Fundación Instituto Valenciano de Oncología, C/
Prof. Beltrán Báguena, 8, 46009 Valencia, Spain.
Received: 1 September 2016 Accepted: 15 May 2017
References
1. Jemal A, Bray F, Center MM, Ferlay J, Ward E, Forman D. Global cancer
statistics. CA Cancer J Clin. 2011;61(2):69–90.
2. Barbieri CE, Bangma CH, Bjartell A, Catto JW, Culig Z, Gronberg H, et al.
The mutational landscape of prostate cancer. Eur Urol. 2013;64(4):567–76.
3. Barbieri CE, Demichelis F, Rubin MA. Molecular genetics of prostate cancer:
emerging appreciation of genetic complexity. Histopathology. 2012;60(1):
187–98.
4. Halvorsen OJ, Haukaas SA, Akslen LA. Combined loss of PTEN and p27
expression is associated with tumor cell proliferation by Ki-67 and increased
risk of recurrent disease in localized prostate cancer. Clin Cancer Res. 2003;
9(4):1474–9.
5. Li R, Dai H, Wheeler TM, Sayeeduddin M, Scardino PT, Frolov A, et al.
Prognostic value of Akt-1 in human prostate cancer: a computerized
quantitative assessment with quantum dot technology. Clin Cancer Res.
2009;15(10):3568–73.
6. Kontos CK, Adamopoulos PG, Scorilas A. Prognostic and predictive
biomarkers in prostate cancer. Expert Rev Mol Diagn. 2015;15(12):1567–76.
7. Tomlins SA, Laxman B, Dhanasekaran SM, Helgeson BE, Cao X, Morris DS, et
al. Distinct classes of chromosomal rearrangements create oncogenic ETS
gene fusions in prostate cancer. Nature. 2007;448(7153):595–9.
8. Pettersson A, Graff RE, Bauer SR, Pitt MJ, Lis RT, Stack EC, et al. The TMPRSS2:
ERG rearrangement, ERG expression, and prostate cancer outcomes: a
cohort study and meta-analysis. Cancer Epidemiol Biomark Prev. 2012;21(9):
1497–509.
9. Hagglof C, Hammarsten P, Stromvall K, Egevad L, Josefsson A, Stattin P, et
al. TMPRSS2-ERG expression predicts prostate cancer survival and associates
with stromal biomarkers. PLoS One. 2014;9(2):e86824.
10. Fernandez-Serra A, Rubio L, Calatrava A, Rubio-Briones J, Salgado R, GilBenso R, et al. Molecular characterization and clinical impact of TMPRSS2ERG rearrangement on prostate cancer: comparison between FISH and RTPCR. Biomed Res Int. 2013;2013:465179.
11. Hong MK, Macintyre G, Wedge DC, Van Loo P, Patel K, Lunke S, et al.
Tracking the origins and drivers of subclonal metastatic expansion in
prostate cancer. Nat Commun. 2015;6:6605.
12. Yadav SS, Li J, Lavery HJ. Yadav KK. Next-generation sequencing technology
in prostate cancer diagnosis, prognosis, and personalized treatment. Urol
Oncol: Tewari AK; 2015.
13. Wyatt AW, Mo F, Wang K, McConeghy B, Brahmbhatt S, Jong L, et al.
Heterogeneity in the inter-tumor transcriptome of high risk prostate cancer.
Genome Biol. 2014;15(8):426.
Page 11 of 12
14. Boutros PC, Fraser M, Harding NJ, de Borja R, Trudel D, Lalonde E, et al.
Spatial genomic heterogeneity within localized, multifocal prostate cancer.
Nat Genet. 2015;
15. Pollak M. Insulin and insulin-like growth factor signalling in neoplasia. Nat
Rev Cancer. 2008;8(12):915–28.
16. Samani AA, Yakar S, LeRoith D, Brodt P. The role of the IGF system in cancer
growth and metastasis: overview and recent insights. Endocr Rev. 2007;28(1):20–47.
17. Chan JM, Stampfer MJ, Giovannucci E, Gann PH, Ma J, Wilkinson P, et al.
Plasma insulin-like growth factor-I and prostate cancer risk: a prospective
study. Science. 1998;279(5350):563–6.
18. Pollak M, Beamer W, Zhang JC. Insulin-like growth factors and prostate
cancer. Cancer Metastasis Rev. 1998;17(4):383–90.
19. Liao Y, Abel U, Grobholz R, Hermani A, Trojan L, Angel P, et al. Up-regulation of
insulin-like growth factor axis components in human primary prostate cancer
correlates with tumor grade. Hum Pathol. 2005;36(11):1186–96.
20. Cox ME, Gleave ME, Zakikhani M, Bell RH, Piura E, Vickers E, et al. Insulin
receptor expression by human prostate cancers. Prostate. 2009;69(1):33–40.
21. Chott A, Sun Z, Morganstern D, Pan J, Li T, Susani M, et al. Tyrosine kinases
expressed in vivo by human prostate cancer bone marrow metastases and
loss of the type 1 insulin-like growth factor receptor. Am J Pathol. 1999;
155(4):1271–9.
22. Figueroa JA, De Raad S, Speights VO, Rinehart JJ. Gene expression of insulinlike growth factors and receptors in neoplastic prostate tissues: correlation
with clinico-pathological parameters. Cancer Investig. 2001;19(1):28–34.
23. Hellawell GO, Turner GD, Davies DR, Poulsom R, Brewster SF, Macaulay VM.
Expression of the type 1 insulin-like growth factor receptor is up-regulated
in primary prostate cancer and commonly persists in metastatic disease.
Cancer Res. 2002;62(10):2942–50.
24. Mancarella C, Casanova-Salas I, Calatrava A, Ventura S, Garofalo C, RubioBriones J, et al. ERG deregulation induces IGF-1R expression in prostate
cancer cells and affects sensitivity to anti-IGF-1R agents. Oncotarget. 2015;
25. Garcia-Flores M, Casanova-Salas I, Rubio-Briones J, Calatrava A, Dominguez-Escrig
J, Rubio L, et al. Clinico-pathological significance of the molecular alterations of
the SPOP gene in prostate cancer. Eur J Cancer. 2014;50(17):2994–3002.
26. Livak KJ, Schmittgen TD. Analysis of relative gene expression data using
real-time quantitative PCR and the 2(−Delta Delta C(T)) method. Methods.
2001;25(4):402–8.
27. Bradburn MJ, Clark TG, Love SB, Altman DG. Survival analysis part III:
multivariate data analysis – choosing a model and assessing its adequacy
and fit. Br J Cancer. 2003;89(4):605–11.
28. Rubio-Briones J, Fernandez-Serra A, Calatrava A, Garcia-Casado Z, Rubio L,
Bonillo MA, et al. Clinical implications of TMPRSS2-ERG gene fusion
expression in patients with prostate cancer treated with radical
prostatectomy. J Urol. 2010;183(5):2054–61.
29. Toretsky JA, Steinberg SM, Thakar M, Counts D, Pironis B, Parente C, et al.
Insulin-like growth factor type 1 (IGF-1) and IGF binding protein-3 in
patients with Ewing sarcoma family of tumors. Cancer. 2001;92(11):2941–7.
30. Scotlandi K, Manara MC, Serra M, Marino MT, Ventura S, Garofalo C, et al.
Expression of insulin-like growth factor system components in Ewing's
sarcoma and their association with survival. Eur J Cancer. 2011;47(8):1258–66.
31. Schnarr B, Strunz K, Ohsam J, Benner A, Wacker J, Mayer D. Down-regulation of
insulin-like growth factor-I receptor and insulin receptor substrate-1 expression
in advanced human breast cancer. Int J Cancer. 2000;89(6):506–13.
32. Shin SJ, Gong G, Lee HJ, Kang J, Bae YK, Lee A, et al. Positive expression of
insulin-like growth factor-1 receptor is associated with a positive hormone
receptor status and a favorable prognosis in breast cancer. J Breast Cancer.
2014;17(2):113–20.
33. Plymate SS, Bae VL, Maddison L, Quinn LS, Ware JL. Type-1 insulin-like
growth factor receptor reexpression in the malignant phenotype of SV40-Timmortalized human prostate epithelial cells enhances apoptosis.
Endocrine. 1997;7(1):119–24.
34. Sutherland BW, Knoblaugh SE, Kaplan-Lefko PJ, Wang F, Holzenberger M,
Greenberg NM. Conditional deletion of insulin-like growth factor-I receptor
in prostate epithelium. Cancer Res. 2008;68(9):3495–504.
35. Massoner P, Ladurner Rennau M, Heidegger I, Kloss-Brandstatter A,
Summerer M, Reichhart E, et al. Expression of the IGF axis is decreased in
local prostate cancer but enhanced after benign prostate epithelial
differentiation and TGF-beta treatment. Am J Pathol. 2011;179(6):2905–19.
36. Tomlins SA, Rhodes DR, Perner S, Dhanasekaran SM, Mehra R, Sun XW, et al.
Recurrent fusion of TMPRSS2 and ETS transcription factor genes in prostate
cancer. Science. 2005;310(5748):644–8.
Mancarella et al. BMC Cancer (2017) 17:367
Page 12 of 12
37. Kumar-Sinha C, Tomlins SA, Chinnaiyan AM. Recurrent gene fusions in
prostate cancer. Nat Rev Cancer. 2008;8(7):497–511.
38. Spencer ES, Johnston RB, Gordon RR, Lucas JM, Ussakli CH, Hurtado-Coll A,
et al. Prognostic value of ERG oncoprotein in prostate cancer recurrence
and cause-specific mortality. Prostate. 2013;73(9):905–12.
39. Bismar TA, Dolph M, Teng LH, Liu S, Donnelly B. ERG protein expression
reflects hormonal treatment response and is associated with Gleason score
and prostate cancer specific mortality. Eur J Cancer. 2012;48(4):538–46.
40. Gopalan A, Leversha MA, Satagopan JM, Zhou Q, Al-Ahmadie HA, Fine SW,
et al. TMPRSS2-ERG gene fusion is not associated with outcome in patients
treated by prostatectomy. Cancer Res. 2009;69(4):1400–6.
41. Brooks JD, Wei W, Hawley S, Auman H, Newcomb L, Boyer H, et al.
Evaluation of ERG and SPINK1 by Immunohistochemical staining and
Clinicopathological outcomes in a multi-Institutional radical prostatectomy
cohort of 1067 patients. PLoS One. 2015;10(7):e0132343.
42. Chaux A, Albadine R, Toubaji A, Hicks J, Meeker A, Platz EA, et al.
Immunohistochemistry for ERG expression as a surrogate for TMPRSS2-ERG
fusion detection in prostatic adenocarcinomas. Am J Surg Pathol. 2011;
35(7):1014–20.
43. Sung JY, Jeon HG, Jeong BC, Seo SI, Jeon SS, Lee HM, et al. Correlation of
ERG immunohistochemistry with molecular detection of TMPRSS2-ERG gene
fusion. J Clin Pathol. 2016;69(7):586–92.
44. Grupp K, Boumesli R, Tsourlakis MC, Koop C, Wilczak W, Adam M, et al. The
prognostic impact of high Nijmegen breakage syndrome (NBS1) gene
expression in ERG-negative prostate cancers lacking PTEN deletion is driven
by KPNA2 expression. Int J Cancer. 2014;135(6):1399–407.
45. Malaguarnera R, Nicolosi ML, Sacco A, Morcavallo A, Vella V, Voci C, et al.
Novel cross talk between IGF-IR and DDR1 regulates IGF-IR trafficking,
signaling and biological responses. Oncotarget. 2015;
46. Chow A, Amemiya Y, Sugar L, Nam R, Seth A. Whole-transcriptome analysis
reveals established and novel associations with TMPRSS2:ERG fusion in
prostate cancer. Anticancer Res. 2012;32(9):3629–41.
47. Mounir Z, Lin F, Lin VG, Korn JM, Yu Y, Valdez R, et al. TMPRSS2:ERG blocks
neuroendocrine and luminal cell differentiation to maintain prostate cancer
proliferation. Oncogene. 2014;
48. Urbinati G, Ali HM, Rousseau Q, Chapuis H, Desmaele D, Couvreur P, et al.
Antineoplastic effects of siRNA against TMPRSS2-ERG junction oncogene in
prostate cancer. PLoS One. 2015;10(5):e0125277.
49. Ondrusova L, Vachtenheim J, Reda J, Zakova P, Benkova K. MITFindependent pro-survival role of BRG1-containing SWI/SNF complex in
melanoma cells. PLoS One. 2013;8(1):e54110.
50. Hansen RL, Heeboll S, Ottosen PD, Dyrskjot L, Borre M. Smarcc1 expression:
a significant predictor of disease-specific survival in patients with clinically
localized prostate cancer treated with no intention to cure. Scand J Urol
Nephrol. 2011;45(2):91–6.
51. van de Wijngaart DJ, Dubbink HJ, Molier M, de Vos C, Trapman J, Jenster G.
Functional screening of FxxLF-like peptide motifs identifies SMARCD1/
BAF60a as an androgen receptor cofactor that modulates TMPRSS2
expression. Mol Endocrinol. 2009;23(11):1776–86.
52. Sharon SM, Pozniak Y, Geiger T, Werner H. TMPRSS2-ERG fusion protein
regulates insulin-like growth factor-1 receptor (IGF1R) gene expression in
prostate cancer: involvement of transcription factor Sp1. Oncotarget. 2016;
Submit your next manuscript to BioMed Central
and we will help you at every step:
• We accept pre-submission inquiries
• Our selector tool helps you to find the most relevant journal
• We provide round the clock customer support
• Convenient online submission
• Thorough peer review
• Inclusion in PubMed and all major indexing services
• Maximum visibility for your research
Submit your manuscript at
www.biomedcentral.com/submit