Calretinin as a blood-based biomarker for mesothelioma
Bạn đang xem bản rút gọn của tài liệu. Xem và tải ngay bản đầy đủ của tài liệu tại đây (836.21 KB, 12 trang )
Johnen et al. BMC Cancer (2017) 17:386
DOI 10.1186/s12885-017-3375-5
RESEARCH ARTICLE
Open Access
Calretinin as a blood-based biomarker for
mesothelioma
Georg Johnen1*, Katarzyna Gawrych1, Irina Raiko1, Swaantje Casjens1, Beate Pesch1, Daniel G. Weber1, Dirk Taeger1,
Martin Lehnert1, Jens Kollmeier2, Torsten Bauer2, Arthur W. Musk3,4,5, Bruce W. S. Robinson3,5,
Thomas Brüning1 and Jenette Creaney3,5
Abstract
Background: Malignant mesothelioma (MM) is a deadly cancer mainly caused by previous exposure to asbestos.
With a latency period up to 50 years the incidence of MM is still increasing, even in countries that banned asbestos.
Secondary prevention has been established to provide persons at risk regular health examinations. An earlier
detection with tumor markers might improve therapeutic options. Previously, we have developed a new bloodbased assay for the protein marker calretinin. Aim of this study was the verification of the assay in an independent
study population and comparison with the established marker mesothelin.
Methods: For a case-control study in men, a total of 163 cases of pleural MM and 163 controls were available from
Australia, another 36 cases and 72 controls were recruited in Germany. All controls had asbestosis and/or plaques.
Calretinin and mesothelin were determined by ELISA (enzyme-linked immunosorbent assay) in serum or plasma
collected prior to therapy. We estimated the performance of both markers and tested factors potentially influencing
marker concentrations like age, sample storage time, and MM subtype.
Results: Calretinin was able to detect all major subtypes except for sarcomatoid MM. Calretinin showed a similar
performance in Australian and German men. At a pre-defined specificity of 95% the sensitivity of calretinin reached
71% and that of mesothelin 69%, when excluding sarcomatoid MM. At 97% specificity, the combination with
calretinin increased the sensitivity of mesothelin from 66% to 75%. Sample storage time did not influence the
results. In controls the concentrations of calretinin increased 1.87-fold (95% CI 1.10–3.20) per 10 years of age and
slightly more for mesothelin (2.28, 95% CI 1.30–4.00).
Conclusions: Calretinin could be verified as a blood-based marker for MM. The assay is robust and shows a
performance that is comparable to that of mesothelin. Retrospective analyses would not be limited by storage time.
The high specificity supports a combination of calretinin with other markers. Calretinin is specific for epithelioid and
biphasic MM but not the rarer sarcomatoid form. Molecular markers like calretinin and mesothelin are promising
tools to improve and supplement the diagnosis of MM and warrant further validation in a prospective study.
Keywords: Mesothelioma, Sarcomatoid, Epithelioid, Biphasic, Asbestos, Biomarker panel, Early diagnosis, Calretinin,
Mesothelin, Plasma, Serum
* Correspondence:
1
Institute for Prevention and Occupational Medicine of the German Social
Accident Insurance (IPA), Institute of the Ruhr University Bochum,
Bürkle-de-la-Camp-Platz 1, 44789 Bochum, Germany
Full list of author information is available at the end of the article
© The Author(s). 2017 Open Access This article is distributed under the terms of the Creative Commons Attribution 4.0
International License ( which permits unrestricted use, distribution, and
reproduction in any medium, provided you give appropriate credit to the original author(s) and the source, provide a link to
the Creative Commons license, and indicate if changes were made. The Creative Commons Public Domain Dedication waiver
( applies to the data made available in this article, unless otherwise stated.
Johnen et al. BMC Cancer (2017) 17:386
Background
Malignant mesothelioma (MM) is a highly aggressive
tumor of the serous membranes with an unfavorable
prognosis. Clinical symptoms are often nonspecific and
in most cases the tumor is detected at an advanced
stage. Early detection, preferable with noninvasive or
minimally-invasive methods, could improve therapeutic
approaches and outcomes.
MM is typically associated with a previous exposure to
asbestos; with a latency period of 20 to 50 years. Asbestos
has been classified as a human carcinogen by the International Agency for Research on Cancer (IARC) for nearly
30 years and subsequently, its production, processing, and
use has been restricted or banned in many countries [1, 2].
However, a global asbestos ban as a measure of primary
prevention does not yet exist and a number of nations still
produce and/or use asbestos on a large scale. This continued use, coupled with the long latency between exposure
and tumor incidence means that the number of new MM
cases is still increasing. In Germany it is expected that the
peak incidence of MM cases will occur around 2020 [3],
and a similar trend is predicted for Australia [4].
In both Australia and Germany medical surveillance is
offered to occupationally asbestos-exposed people for
early detection of cancer (secondary prevention) and those
that develop MM receive compensation. A surveillance
program aimed at an early detection of MM could
improve therapy options if, as in some other cancers, early
diagnosis and therapy improves survival. Currently,
diagnosis of MM requires tissue or cellular material that is
examined by a specially trained pathologist, usually
applying a panel of immunohistochemical markers [5].
Therefore, minimally-invasive procedures such as simple
blood tests could greatly improve prognosis if early detection and treatment become possible [6].
A number of blood-based biomarkers for the detection
of MM has been described, however, no single marker
has sufficient sensitivity to detect all tumors, particularly
the sarcomatoid subtype [7]. Thus, there is still a need
for additional novel biomarkers, e.g., to offer more options for the assembly of marker panels with sufficient
sensitivity and specificity [8].
Previously, we have developed an assay to detect calretinin in serum and plasma samples [9]. Calretinin is a 29 kDa
calcium-binding protein originally found in neurons that is
also expressed on the surface of mesothelial cells and
overexpressed in MM [10–12]. Using primary cells from a
mouse model Blum et al. demonstrated that mesothelial cell
proliferation and migration was increased or decreased by
overexpression or absence of calretinin, respectively, hinting
at a possible target for a new therapeutic approach [13].
Calretinin is extensively used in antibody panels for the
clinical diagnosis of MM by immunohistochemistry, including the sarcomatoid subtype [5, 11, 14, 15]. We found, in a
Page 2 of 12
small number of samples, that soluble calretinin was
elevated in the blood of individuals with MM relative to
healthy and asbestos-exposed controls [9]. A difference
between plasma and serum samples was not evident and
the antigen showed a high stability.
We now present data on the verification of the calretinin
assay in a larger and independent study population from
Australia and Germany and compare its performance with
that of the established marker mesothelin [7, 16–21]. We
also addressed the specific question of the utility of calretinin for identifying MM cases of sarcomatoid histology in
blood, which was not answered in the previous study.
Methods
Study population and collection of samples
We used a case-control design to address specific questions.
Firstly, to determine the performance of the calretinin assay
for different MM histologies, we selected a series of male
cases (n = 83) from Australia with similar numbers of
samples with epithelioid (n = 27), biphasic (n = 28) or sarcomatoid (n = 28) histology. To enrich the number of cases of
sarcomatoid histology it was necessary to use samples collected up to 15 years previously. A random selection of samples, stored for a similar length of time from age-matched
individuals from Australia with benign asbestos-related
disease (for reason of homogeneity, we selected pleural
plaques only) was used as reference group (n = 88). These
cases and controls are referred to as group 1 (Table 1).
Secondly, to verify our original findings that calretinin is
elevated in the blood of MM patients [9] we analysed two
additional independent sample sets, from Australian (group
2) and German (group 3) collections of more recent origin
that represented a more typical clinical setting. Both groups
were similar in composition regarding subtypes and age at
blood drawing, to allow comparison of a possible influence
of the country of origin as surrogate for potential differences by type of control or sample handling. To adjust for
subtype composition four cases of sarcomatoid MM from
Germany, which originally had 40 cases in total, were
excluded. In total, group 2 consisted of 80 male MM cases
and 75 matched controls, and group 3 consisted of 36 male
MM cases and 72 controls. Because a large proportion of
asbestos exposures, particularly heavy exposures, occurred
in occupational settings, a typical but also more challenging
target population of a future application of the tumor
markers would consist of persons with known asbestos
exposure and benign asbestos-related diseases to whom
regular health examinations by social security institutions
and statutory accident insurances are offered. Therefore,
the controls from Germany (group 3) were selected from a
surveillance cohort of the statutory accident insurances for
patients with asbestosis and/or plaques. All workers had
previous asbestos exposure and a recognized occupational
disease based on these pathologies. In group 2 (Australia),
Johnen et al. BMC Cancer (2017) 17:386
Page 3 of 12
Table 1 Characteristics of the study population (male cases and controls from Australia and Germany)
Characteristics
Australia
Germany
Group 1
Total
Group 2
Group 3
Mesothelioma
Controls
Mesothelioma
Controls
Mesothelioma
Controls
83
88
80
75
36
72
Histological subtype
Epithelioid
27 (32.5%)
48 (60.0%)
28 (77.8%)
Sarcomatoid
28 (33.7%)
0
0
Biphasic
28 (33.7%)
12 (15.0%)
4 (11.1%)
Not specified
0
20 (25.0%)
4 (11.1%)
Pathologic changes in controls
Plaques
88 (100%)
55 (73.3%)
0
Asbestosis
0
0
44 (61.1%)
Asbestosis and plaques
Year of blood drawing
Median (range)
0
20 (26.7%)
28 (38.9%)
2005
2006
2012
2012
2011
2010
(1996–2011)
(2000–2010)
(2011–2013)
(2011–2013)
(2008–2014)
(2009–2014)
69.5 (52–84)
70 (41–89)
72 (53–90)
70 (34–85)
71 (43–83)
Age at blood drawing [years]
Median (range)
70 (53–84)
Calretinin storage time [months]
Median (IQR)
81.5 (42.9–111)
59.8 (32.8–75.7)
17.2 (7.4–23.2)
19.3 (8.8–28.3)
3.6 (1.9–7)
10.9 (3.7–19.5)
n.a.
n.a.
21.3 (11.5–27.4)
21.5 (11.1–30.4)
7.5 (4.8–15.1)
26.8 (19.1–31.9)
N < limit of detection
30 (36.1%)
61 (69.3%)
20 (25.0%)
73 (97.3%)
12 (33.3%)
62 (86.1%)
Median (IQR)
0.79 (<0.28–1.70) <0.19 (<0.09–0.63) 1.10 (<0.48–2.16) <0.01 (<0.01- < 0.08) 1.01 (<0.33–1.74) <0.20 (<0.08- < 0.34)
P-valuea
0.0197
Mesothelin storage time
[months] Median (IQR)
Calretinin [ng/mL]
<0.0001
0.0009
Mesothelin [nmol/L]
N < limit of detection
0
0
1 (1.25%)
14 (18.7%)
0
0
Median (IQR)
2.65 (1.38–5.54)
0.77 (0.53–1.08)
4.06 (2.22–11.9)
1.02 (0.46–1.45)
2.01 (1.44–3.83)
1.03 (0.73–1.21)
P-valueb
<0.0001
<0.0001
<0.0001
Storage time, time between blood drawing and measurement of calretinin or mesothelin; n.a. not available, IQR interquartile range
a
P-values obtained from two sided Peto-Prentice test
b
P-values obtained from two sided Wilcoxon rank-sum test
we tried to include patients with asbestosis and plaques to
have a similar control group (Table 1). Controls of all
three groups were frequency matched to cases by age
in 5-year groups, using the following intervals: ≤45,
46–50, 51–55, 56–60, 61–65, 66–70, 71–75, 76–80,
81–85, >85 years.
Samples from Australia were sourced from the
Australasian Biospecimen Network tissue bank, which
includes samples collected from patients attending the
respiratory clinics of either Sir Charles Gairdner Hospital
or the Hollywood Specialist Centre in Perth, Western
Australia. The diagnosis of mesothelioma was established
by experienced pathologists and confirmed by the Western
Australian Mesothelioma Registry. The diagnosis of benign
asbestos related disease (asbestosis and/or pleural plaques)
was based on clinical and radiological findings. All patients
were followed to confirm that the clinical pattern matched
diagnosis. Blood was collected without anti-coagulant and
sera stored in aliquots at −80 °C until use in assays.
German MM cases were recruited at the HELIOS Clinic
Emil von Behring in Berlin. German controls with benign
asbestos-related diseases were from individuals participating in the prospective validation study MoMar at 26
centers throughout Germany [22]. The final diagnosis in
all patients was confirmed by experienced pathologists.
Blood was collected into 9.0 ml S-Monovettes EDTA gel
tubes (Sarstedt, Nümbrecht, Germany). After separation,
plasma was stored at −80 °C until use.
All MM blood samples were collected prior to chemoor radiation therapy.
Johnen et al. BMC Cancer (2017) 17:386
Determination of calretinin
Concentrations of calretinin in plasma and serum samples
were determined as described [9]. In brief, a 1:1500 dilution of purified rabbit polyclonal anti-calretinin was used
as capture antibody and a 1:5000 dilution of biotinylated
polyclonal anti-calretinin as detection antibody. Samples
(plasma or serum) were diluted 1:5 in Tris-buffered saline
(pH 7.4) / 0.05% Tween 20, supplemented with 5 mM
CaCl2. A volume of 100 μl of a diluted sample was used
for each determination. Calretinin concentrations were
determined from a standard curve of human purified
recombinant calretinin (Swant, Belinzona, Switzerland)
diluted between 10 and 0.08 ng/mL run in parallel on each
plate. All determinations of calretinin were performed in
the laboratory of the IPA.
The standard curve was obtained by four-parameter curve
fitting using Softmax Pro 4.7.1 from Molecular Devices
(Sunnyvale, CA, USA). The lower limit of detection (LOD)
of the assay was defined as the concentration that corresponds to the following optical density (OD) at 414 nm:
OD414 = ‘parameter A’ + 0.1 OD units. Where ‘parameter A’
(minimal value of the four-parameter curve fit function) is
the background value of each microtiter plate and 0.1 OD
units is the rounded 5-fold mean of the standard deviation
of the zero standard.
Page 4 of 12
below LOD by a less-than (<) sign (Table 1). For the
depiction of the scatterplots we set values below LOD to
two-thirds of LOD (2/3*LOD).
Biomarker classification performance was determined
by nonparametric and parametric estimation of the ROC
curve with the area under the curve (AUC) estimated to
assess a marker’s sensitivity for varying values of specificity. Because empirical ROC curves and AUCs are biased
if LODs are present we used parametric ROC curves
based on bi-lognormal or bi-Weibull distribution, which
leads to proper (less biased) estimators [24].
The Peto-Prentice test was used to compare the distribution of calretinin measurements between groups [25, 26].
The Peto-Prentice test is a linear rank test developed for
right-censored variables. Therefore, for LOD the variables
were flipped into right-censored variables as described by
Helsel [27]. Two-sample Wilcoxon Rank-Sum test was applied for comparison of the distribution of mesothelin
values between groups. The chi-square test was performed
to compare AUCs. Kendall’s tau (rK) was calculated as nonparametric correlation measure between left-censored
marker values, age, and storage time [27, 28].
Statistical analyses were performed using SAS/STAT
and SAS/IML software, version 9.3 (SAS Institute Inc.,
Cary, NC, USA).
Determination of mesothelin
For the determination of mesothelin in serum and plasma
samples, a commercially available ELISA kit (MESOMARK)
by Fujirebio Diagnostics, Inc. (Malvern, PA, USA) was used
according to the manufacturer’s instructions as described before [19, 23]. The assay was performed in both laboratories.
Statistical analysis
In order to determine if soluble calretinin could be a biomarker for sarcomatoid MM we compared concentrations
between about equal numbers of samples of different histological subtypes to controls with benign asbestos-related
disease (pleural plaques), matched for gender (all male), age
(median 70 years), and storage time (group 1 in Table 1).
To confirm the initially published results [9] we tested the
assay in samples from Australia (group 2) and Germany
(group 3). MM cases with sarcomatoid histology were excluded. Samples were matched for age; however, there were
differences in storage time between group 2 and 3 (Table 1).
All cases and controls were male, the median age was
around 71 years. The Australian controls had either plaques
or both, plaques and asbestosis, the German controls had
either asbestosis or both, asbestosis and plaques.
Calretinin and mesothelin concentrations were presented
with median and interquartile range (IQR). A relatively
large number of calretinin concentrations were below the
limits of detection (LOD), which affects the calculation of
percentiles. Therefore, we marked a percentile estimated
Results
Discrimination of MM subtypes – Marker concentrations
in sarcomatoid MM
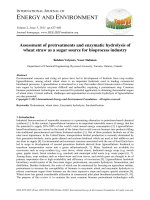
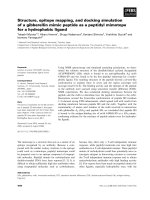
The median calretinin concentration of 0.79 ng/mL in all
MM cases, i.e. all subtypes combined, was significantly
different (p = 0.0197) from the controls (<0.19 ng/mL)
(group 1 in Table 1). Median calretinin concentrations for
epithelioid, sarcomatoid, and biphasic MM were 1.00 ng/
mL, 0.29 ng/mL, and 1.53 ng/mL respectively. The difference between controls and epithelioid (p = 0.0343) or biphasic MM (p = 0.0018) was statistically significant (Fig. 1).
There was no statistical significant difference in calretinin
concentrations between MM cases with sarcomatoid
histology and the controls (p = 0.2200). Differences between
sarcomatoid and epithelioid MM (p = 0.0041) as well as
sarcomatoid and biphasic MM (p = 0.0001) were statistically
significant.
In contrast, for mesothelin differences between controls
and MM were statistically significant (p < 0.0001) for all
individual subtypes (Fig. 1). The median mesothelin
concentrations for epithelioid, sarcomatoid, and biphasic
MM were 4.89 nmol/L, 2.07 nmol/L, and 2.74 nmol/L,
respectively. In the controls, the median of mesothelin was
0.77 nmol/L. Differences between sarcomatoid and epithelioid MM (p = 0.0005) were statistically significant
whereas differences between sarcomatoid and biphasic MM
(p = 0.0963) were not.
Johnen et al. BMC Cancer (2017) 17:386
Fig. 1 Marker concentrations in MM subtypes. a Calretinin [ng/mL]
in controls and MM cases by subtype. b Mesothelin [nmol/L] in
controls and MM cases by subtype. All cases and controls were from
Australia (group 1). Individual p-values relate to the comparison
between each subtype and the controls. P-values for calretinin were
obtained from two-sided Peto-Prentice test and for mesothelin from
two-sided Wilcoxon rank-sum test
Verification of the performance of calretinin and influence
of country of origin on the markers
To address the question whether the initial results of the
calretinin assay that had been obtained with French and
German samples [9] could be confirmed with an independent and larger study population, we tested the assay
in samples from Australia (group 2) as well as additional
German samples (group 3). For this analysis samples from
cases of MM with sarcomatoid histology were excluded.
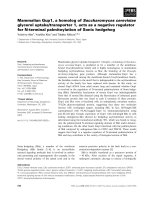
Median calretinin concentrations in the Australian MM
cases and asbestos-exposed controls were 1.10 ng/mL and
<0.01 ng/mL (p < 0.0001), respectively (Table 1). Median
calretinin concentrations in the German cases and
controls were 1.01 ng/mL and 0.20 ng/mL (p = 0.0009),
respectively (Table 1). There was no significant difference
between calretinin concentrations in MM cases from
Australia and Germany (p = 0.8210) or in controls from
both countries (p = 0.0773) (Fig. 2a).
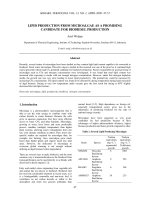
To further investigate a possible influence of the country
of origin, ROC analyses were performed (Fig. 3). A relatively large number of calretinin values, particularly in the
Page 5 of 12
Fig. 2 Comparison of marker concentrations in samples from
Australia and Germany. a Calretinin [ng/mL] in MM cases and
controls from Australia (group 1 and 2) and Germany (group 3). The
corresponding p-values (group 2 vs. group 3) are: p = 0.8210 for MM
cases and p = 0.0773 for controls. b Mesothelin [nmol/L] in MM
cases and controls from Australia (group 1 and 2) and Germany
(group 3). The corresponding p-values (group 2 vs. group 3) are:
p = 0.0012 for MM cases and p = 0.1422 for controls. P-values for
calretinin were obtained from two-sided Peto-Prentice test and for
mesothelin from two-sided Wilcoxon rank-sum test. For better
comparison, for group 1 sarcomatoid MM were excluded
control group, were below LOD. Therefore, the ROC analyses included, besides the nonparametric (empirical), also
a parametric (bi-lognormal) curve. The empirical ROC
curve for Australia had an AUC of 0.90 (95% CI, 0.85–
0.95) and the bi-lognormal curve an AUC of 0.95 (95% CI,
0.92–0.98). The corresponding empirical ROC curve for
Germany had an AUC of 0.83 (95% CI, 0.74–0.92) and the
bi-lognormal an AUC of 0.87 (95% CI, 0.79–0.95). A chi-square test with the bi-lognormal AUC indicated that between the two countries the areas were not significantly
different (p = 0.16).
Median concentrations of mesothelin, despite being in
the same order of magnitude, were different in the MM
cases from Australia and Germany (p = 0.0012) whereas
the controls were similar (p = 0.14) (Fig. 2b and Table 1).
Again, ROC curves were used to test for a possible effect
Johnen et al. BMC Cancer (2017) 17:386
Page 6 of 12
Fig. 3 ROC analyses of calretinin and mesothelin in samples from Australia and Germany. a Nonparametric (AUC = 0.90, 95% CI = 0.85–0.95) and bilognormal (AUC = 0.95, 95% CI = 0.92–0.98) ROC curves for calretinin in Australian samples (group 2). b Nonparametric (AUC = 0.83, 95% CI = 0.74–0.92)
and bi-lognormal (AUC = 0.87, 95% CI = 0.79–0.95) ROC curves for calretinin in German samples (group 3). c Nonparametric (AUC = 0.91, 95% CI
= 0.87–0.96) and bi-Weibull (AUC = 0.93, 95% CI = 0.90–0.96) ROC curve for mesothelin in Australian samples (group 2). d Nonparametric (AUC = 0.84,
95% CI = 0.76–0.93) and bi-Weibull (AUC = 0.85, 95% CI = 0.81–0.89) ROC curve for mesothelin in German samples (group 3)
of the country where the samples originated. Figure 3 includes the nonparametric (empirical) and the parametric
(bi-Weibull) ROC curves. The empirical ROC curve for
Australia had an AUC of 0.91 (95% CI, 0.87–0.96) and the
bi-Weibull curve an AUC of 0.93 (95% CI, 0.90–0.96).
The empirical ROC curve for Germany had an AUC of
0.84 (95% CI, 0.76–0.93) and the bi-Weibull curve an
AUC of 0.85 (95% CI, 0.81–0.89). A chi-square test with
the AUC of the bi-Weibull curves indicated that the two
areas were not significantly different (p = 0.17) and therefore an influence of the country of origin on the performance of mesothelin unlikely. Based on these results we
pooled the data of group 2 and 3 for further analyses of
the performance of the markers.
A comparison of the non-MM pathologies (plaques, asbestosis, plaques plus asbestosis) in the controls of all three
groups for both markers is depicted in Additional file 1:
Fig. S1. The differences between the benign asbestosrelated pathologies were not statistically significant for
plaques and asbestosis plus plaques as well as asbestosis
and asbestosis plus plaques. The small differences between
plaques and asbestosis were statistically significant for calretinin (p = 0.0084) as well as mesothelin (p = 0.0048).
Individual and combined performance of calretinin and
mesothelin to detect MM
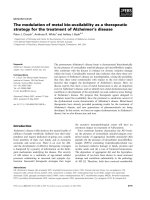
The ROC curves (nonparametric and parametric) for calretinin and mesothelin, respectively, that were generated
using the pooled dataset of male subjects of group 2 and 3
are shown in Fig. 4. Both markers indicated a good performance, with a nonparametric AUC of 0.86 (95% CI,
0.82–0.91) and a parametric AUC of 0.90 (95% CI, 0.86–
0.94) for calretinin and a nonparametric AUC of 0.89
(95% CI, 0.85–0.93) and a parametric AUC of 0.91 (95%
CI, 0.89–0.94) for mesothelin. Using the empirical data,
specificity and sensitivity of calretinin and mesothelin
were calculated for different false positive rates (FPR).
Even when setting a high a priori specificity of 99% (FPR
Johnen et al. BMC Cancer (2017) 17:386
Page 7 of 12
between calretinin and mesothelin concentrations in cases
(rK = 0.43, p < 0.0001) but not in controls (rK = 0.24,
p = 0.244) (Fig. 5).
To assess the benefit of calretinin as an additional marker,
we calculated the sensitivity gained from the combination
of calretinin and mesothelin. For example, if positivity of
either mesothelin (cutoff: 2.32 nmol/L) or calretinin (cutoff:
0.85 ng/mL) is sufficient for a positive test result and specificity is set to 97%, the combination reaches a sensitivity of
75% (mesothelin alone: 66%). If positivity of mesothelin and
calretinin is required for a positive test result and specificity
is set to 99%, the combination reaches a sensitivity of 66%
(mesothelin alone: 61%).
Influence of storage time on marker concentrations
For the enrichment of the rare sarcomatoid subtype in
group 1 we had to resort to archival samples that were up to
15 years old at the time of marker determination. To evaluate the possible influence of storage time we looked at the
distribution of assay results for calretinin in the pooled data
sets of all samples (groups 1, 2, and 3), of which the latter
two groups contained more of the newer samples. We observed no influence of storage time on the concentrations of
calretinin (Fig. 6). There was no significant correlation between storage time and marker concentration in cases and a
weak correlation in controls (cases: rK = −0.05, p = 0.356;
controls: rK = 0.20, p < 0.0001). The odds ratio (OR) of a
false-positive test for calretinin in controls was 1.02 (95% CI,
1.01–1.03). For mesothelin, storage information was only
available for group 2 and group 3. Storage time did not
affect mesothelin, with an OR of a false-positive test of 0.96
(95% CI, 0.92–1.01) in the pooled control group.
Influence of patient age on the marker concentrations
Fig. 4 ROC analyses of calretinin and mesothelin with pooled data
from Australia and Germany. a Nonparametric (AUC = 0.86, 95%
CI = 0.82–0.91) and bi-lognormal (AUC = 0.90, 95% CI = 0.86–0.94)
ROC curves for calretinin. b Nonparametric (AUC = 0.89, 95%
CI = 0.85–0.93) and bi-Weibull (AUC = 0.91, 95% CI = 0.89–0.94) ROC
curves for mesothelin. All ROC curves are based on pooled data
from group 2 and 3
of 1%), both markers exhibit a sensitivity of over 50%, with
calretinin reaching 52% and mesothelin 61% (Table 2).
Accepting a FPR of 5% would lead to a sensitivity of 71%
for calretinin and 69% for mesothelin. For comparison,
using the maximum Youden index a sensitivity of 75%
and a specificity of 90% was reached for calretinin (cutoff
below LOD: 0.42 ng/mL). For mesothelin (cutoff:
1.88 nmol/L), a sensitivity of 74% and a specificity of 93%
was obtained. Notably, there was a significant correlation
As age can influence biomarker performance, we estimated
the effect of age on the marker concentrations as shown in
Fig. 7. We observed no significant correlation between calretinin and age (cases: rK = 0.02, p = 0.782; controls:
rK = −0.02, p = 0.715) but a significant correlation of age
with mesothelin in controls (rK = 0.20, p = 0.001) but not
in cases (rK = 0.004, p = 0.954). In controls, an increase of
age by ten years resulted in 1.87-fold more false-positive
tests of calretinin (95% CI, 1.10–3.20) and 2.28-fold more
false-positive tests for mesothelin (95% CI, 1.30–4.00).
Discussion
Calretinin is one of the best immunohistochemical markers
for the diagnosis of MM [5, 14, 15]. This prompted us to develop an assay that is independent of the availability of tissue
samples and can be applied to body fluids to provide a
minimally-invasive method for the detection of MM. In the
current study, we have verified our initial findings [9] that
calretinin is a robust blood-based biomarker significantly
Johnen et al. BMC Cancer (2017) 17:386
Page 8 of 12
Table 2 Performance of calretinin and mesothelin for the detection of malignant mesothelioma in pooled data (group 2: 80 MM
and 75 controls; group 3: 36 MM and 72 controls)
Biomarker
a
Calretinin
[ng/mL]
Mesothelinb
[nmol/L]
False-positive rate
Cutoff
True positive
True negative
False positive
False negative
Sensitivity
Specificity
0.01
1.07
60
145
2
56
0.52
0.99
0.02
0.83
70
144
3
46
0.60
0.98
0.03
0.68
78
142
5
38
0.67
0.97
0.04
0.63
79
141
6
37
0.68
0.96
0.05
0.58
82
139
8
34
0.71
0.95
0.01
2.32
71
145
2
45
0.61
0.99
0.02
2.31
71
144
3
45
0.61
0.98
0.03
2.15
76
142
5
40
0.66
0.97
0.04
2.02
78
141
6
38
0.67
0.96
0.05
1.99
80
139
8
36
0.69
0.95
a
Performance measures based on nonparametric ROC curve in Fig. 4a (AUC = 0.86, 95% CI = 0.82–0.91)
b
Performance measures based on nonparametric ROC curve in Fig. 4b (AUC = 0.89, 95% CI = 0.85–0.93)
elevated in MM. However, the detection of sarcomatoid
MM is less efficient.
MM subtypes
Sarcomatoid MM is particularly difficult to diagnose; a
blood-based biomarker elevated in MM cases of sarcomatoid histology would be clinically valuable. The Australian
mesothelioma registry published that of 575 MM cases
46.8% were epithelioid, 12.2% sarcomatoid (including
desmoplastic), 12.2% biphasic, and 28.3% not otherwise
specified [4]. According to an analysis of the German
mesothelioma registry based on more than 1600 cases, the
distribution of histological subtypes in Germany consisted
of 29.3% epithelioid, 9.4% sarcomatoid, and 61.3% biphasic
MM [29]. Our previous study may have held some unforeseen bias as there were only 2.4% sarcomatoid cases.
Results presented here, which included 28 (33.7%) sarcomatoid cases, clearly demonstrate that the calretinin assay
basically does not preferentially detect sarcomatoid MM
in serum. This is interesting because calretinin showed a
Fig. 5 Scatterplot of calretinin versus mesothelin. The plot shows
marker concentrations of MM cases and controls from Australia
(group 2) and Germany (group 3)
good performance in biphasic MM and its antibody is
known to detect sarcomatoid MM – including sarcomatoid areas in biphasic MM – in immunohistochemistry
[11, 14, 15]. A possible explanation would be that purely
sarcomatoid MM express but do not release calretinin
into the bloodstream. In comparison, serum concentrations of mesothelin were somewhat, but not significantly,
decreased in sarcomatoid cases and the assay did not
discriminate between sarcomatoid and biphasic MM
subtypes as calretinin did.
Performance of calretinin and mesothelin to detect MM
With the exception of rare sarcomatoid cases, calretinin
showed a good performance to detect MM. A slightly better performance was implicated by the parametric ROC
curves, demonstrating the possible benefit of this method.
A major goal of our development of markers is the future
application in the screening of high-risk populations, e.g.,
former asbestos workers. Besides being able to detect early
Fig. 6 Scatterplot of calretinin versus storage time. Marker
concentrations [ng/mL] in MM cases and controls from Australia and
Germany (group 1, 2, and 3) were plotted against storage
time [months]
Johnen et al. BMC Cancer (2017) 17:386
Page 9 of 12
mesothelin in a longitudinal study [19]. The loss in sensitivity is dependent upon the time between marker determination and occurrence of symptoms. A good sensitivity
of markers to detect cancer within the last 12 months
prior to diagnosis has been demonstrated for glycodelin
and other markers in a longitudinal study based on a large
trial of ovarian cancer screening [31].
Benefit of marker combinations and other new markers
Fig. 7 Scatterplot of marker concentrations versus age. a
Concentrations of calretinin [ng/mL] were plotted against age
[years] of MM cases and controls. b Concentrations of mesothelin
[nmol/L] were plotted against age [years] of MM cases and controls.
The plots are based on pooled data from group 2 and 3
stages of cancer, a very high specificity is an important requirement for markers in order to avoid false-positive results that could cause unnecessary psychological burden
for the participants of the screening program [30]. We
therefore calculated the sensitivity of the markers for different cutoffs conditional on a specificity of at least 95%.
The performance of calretinin was highly comparable to
the ´gold standard´ mesothelin. When a FPR of 3% and
5% was set, calretinin showed a sensitivity of 67% and
71%, and mesothelin a sensitivity of 66% and 69%, respectively. Even when a stringent FPR of 1% was assumed, 52%
and 61% of cases were detected by calretinin and
mesothelin, respectively. This would render calretinin and
mesothelin promising candidates for a marker panel to
diagnose MM. A panel is likely to be necessary to reach
sufficient sensitivity in early stages of MM. Whereas
markers evaluated in case-control studies generally show
higher levels because the samples are mainly derived from
manifest cases that are frequently at later stages, it is expected that most marker levels will be significantly lower
in patients that not yet show clinical symptoms and exhibit a small tumor mass. This has been indicated for
Both markers showed a good correlation. Despite of this
overlap, a combination of mesothelin and calretinin improved the performance compared to mesothelin alone.
Thus, calretinin appears to be a promising candidate to increase the sensitivity in a marker panel, even at high specificity. Whether other models than the simple “and” and
“or” combinations we used might further improve the performance, will be the topic of a separate publication. Using
logistic regression models, we have recently demonstrated
that a combination of mesothelin and the microRNA
miR-103a-3p in blood as well as the combination of
mesothelin and hyaluronic acid in pleural effusion were
able to improve the diagnostic accuracy of the assays [22,
32]. Combinations of markers from different molecular
levels, e.g. proteins, methylated DNA, and microRNA as
shown by Santarelli et al., appear to be a promising approach [33]. Recently, Bononi et al. discovered new circulating microRNAs that were upregulated in MM cases
compared to asbestos-exposed controls; for example,
miR-197-3p showed an AUC of 0.76 in the ROC analysis
[34]. Another interesting candidate is the hyperacetylated
isoform of the protein HMGB1, determined by mass spectrometry, reaching a maximum AUC of 1.00 when comparing serum levels of MM patients with asbestosexposed individuals [35], while for the gene product TXN
(thioredoxin) AUCs of 0.82 and 0.72 were reported by
Maeda et al. and Demir et al., respectively [36, 37]. For the
protein PAEP (glycodelin), originally a marker for ovarian
cancer, an AUC of 0.86 was determined by Schneider et
al. [38]. Regarding the detection in prediagnostic serum
samples, transcript variants of the protein ENOX2 give
hope that a detection of MM before onset of clinical
symptoms may be feasible [39]. The new markers are
promising candidates to be tested in combination with
mesothelin, calretinin, or other markers. However, once
verified with more cases and controls, they have to be validated in studies with longitudinal design, to finally judge
their capability for early detection of MM. In addition, for
some of the markers, simpler and more affordable assay
formats have to be developed.
Factors possibly influencing the marker concentration
Biomarkers have to be sufficiently robust for their application in clinical practice. Several factors may influence the
concentration of markers and thus their performance [18,
Johnen et al. BMC Cancer (2017) 17:386
40]. Factors like gender and sample matrix (serum and
plasma) have been evaluated previously. We could not
observe a difference by gender or matrix used in the previous study [9].
For mesothelin it has been shown that single nucleotide polymorphisms (SNPs) can affect biomarker levels
[41, 42]. Because SNPs can vary between different ethnic
groups – as has been shown for SNPs in metabolic enzymes by Garte et al. [43] – it cannot be excluded that
markers perform differently depending on the target
population. On the other hand, similar marker results
from patients and controls of different geographic origin
can also help to demonstrate the robustness of a biomarker. Here, we investigated regional differences by
comparing samples from Australia and Germany. The
comparison of calretinin concentrations in Australian
and German samples from cases and controls showed
no significant differences. The median concentrations of
calretinin in both groups were similar and also close to
the previously published values, 0.84 ng/mL for cases
and 0.33 ng/mL for the asbestos-exposed controls. For
comparison, the median concentration of calretinin in
97 healthy unexposed controls was 0.20 ng/mL in the
previous study [9]. The results were also confirmed by
the current analysis of the corresponding ROC curves,
using empirical as well as parametric methods. There
was some minor variation between the Australian and
German controls as well as the controls of the previous
analysis, which consisted solely of asbestos-exposed persons who had no benign asbestos-related diseases. The
Australian controls of group 2 had either plaques (73%)
or asbestosis plus plaques (27%), whereas the German
controls (group 3) had mainly asbestosis (60%) or asbestosis plus plaques (39%). However, the small differences
between the non-MM pathologies were statistically
significant only for the comparison of plaques and asbestosis. We recruited the controls from the target population of asbestos-exposed subjects, which constitute a
more challenging control group than the general population. However, a nested case-control study would be the
preferred design [30, 44]. We currently conduct a prospective study in asbestos-exposed subject that may
serve for the validation of calretinin, mesothelin, and
other markers to detect MM.
Biobanking is an important tool for the development
and evaluation of biomarkers, particularly for the validation of marker candidates in prospective cohorts. Longitudinal studies can last many years before a sufficient
number of cases will be reached. A retrospective analysis
of new markers might therefore be performed with archived samples and with the assumption that no significant degradation has occurred. In our study, we used
serum samples that were up to 15 years old. No statistically significant influence of the storage time on the
Page 10 of 12
levels of calretinin could be observed. Thus, a retrospective validation of calretinin as a marker for early detection of MM within a prospective cohort study should
not be limited by sample storage time. Previously, we
had already demonstrated a good stability of calretinin
regarding repeated freeze/thaw cycles [9]. For mesothelin it had also been shown before that storage and repeated freeze/thaw cycles did not affect the stability of
the marker [23, 45].
A typical confounder of biomarkers can be the age
of the target population as could be shown for the
urinary marker NMP22 [46]. In the previous study on
calretinin no age-related differences were observed.
The current analysis revealed a moderate effect for
calretinin and a slightly more pronounced effect for
mesothelin with an about twofold increase of the
marker concentrations by ten years of attained age.
Once influencing factors have been identified and can
be quantified their effect can be considered in the
cutoff chosen.
Limitations of the study
A general limitation is the case-control design of this
study on the performance of biomarkers that are
intended to detect MM prior to a clinical diagnosis,
which tends to overestimate the sensitivity compared to
a prospective design [30]. Calretinin and other markers
still have to be validated in prospective cohort studies.
Another limitation is the rareness of the disease so that
we had to recruit archived samples. However, the biobank allowed us to include a rather large number of
samples, here of male subjects.
Conclusions
We showed that calretinin is robust and has a similar
good performance to detect MM (except the sarcomatoid subtype) as mesothelin. Mesothelin is currently considered to be the best available blood-based marker for
MM and therefore served as the ‘gold standard’ in our
analysis. However, it is unlikely that a single biomarker
will reach a sufficiently high sensitivity to allow the early
detection of all MM. A panel of markers may provide
the necessary increase in sensitivity, even at high specificity, as the combination of calretinin and mesothelin has
indicated. This verification of calretinin provides the
foundation for the next step, the validation of a specific
marker panel, e.g. the combination of calretinin with
mesothelin and/or other markers, in a prospective cohort study in order to prove that early detection of MM
is possible. That would be a major step toward the application of biomarkers in medical surveillance programs
of workers with former exposure to asbestos.
Johnen et al. BMC Cancer (2017) 17:386
Additional files
Additional file 1: Figure S1. Comparison of marker concentrations in
different non-MM pathologies. All controls of group 1, 2, and 3 were pooled
and then separated into plaques, asbestosis plus plaques, and asbestosis.
P-values for each comparison between the three pathologies are indicated.
(A) Concentrations of Calretinin [ng/mL] and (B) Mesothelin [nmol/L].
P-values for calretinin were obtained from two-sided Peto-Prentice test and
for mesothelin from two-sided Wilcoxon rank-sum test. (TIFF 380 kb)
Additional file 2: Table S1. Dataset of the entire study population. The
dataset lists histology (cases), pathologic changes (controls), age range,
storage time of samples as well as measured concentrations of calretinin
and mesothelin of individuals from all three study groups. (XLS 98 kb)
Abbreviations
AUC: Area Under the Curve; CI: Confidence Interval; FPR: False Positive Rate;
IQR: Interquartile Range; LOD: Limit Of Detection; MM: Malignant
Mesothelioma;; OD: Optical Density; OR: Odds Ratio; ROC: Receiver Operating
Characteristic; SNPs: Single Nucleotide Polymorphisms
Acknowledgements
We thank Judith Delbanco, Evelyn Heinze, Monika Kobek, Sandra ZilchSchöneweis, Ulrike Gross, Jens Schreiber, and Claudia Lechtenfeld of the MoMar
study group, as well as the staff, doctors, and patients of the participating clinics
for their support and continuous commitment. We are grateful to Eva Zahradnik,
Ulla Meurer, Hanne Dare, Yvonne Demelker, Patricia Pflugmacher, and Justine
Leon for technical assistance. We acknowledge support by the Open Access
Publication Funds of the Ruhr-University Bochum.
Funding
Not applicable.
Availability of data and materials
The dataset supporting the conclusions of this article is included as an
additional file (Additional file 2: Table S1).
Authors’ contributions
GJ conceived of the study, participated in its design and coordination, and
drafted the manuscript. KG performed statistical analyses and helped to draft
the manuscript. IR carried out the immunoassays and initial analyses and
helped to draft the manuscript. SC performed the statistical analyses. BP
participated in design and coordination, and helped to draft the manuscript.
DGW participated in the design and helped to draft the manuscript. DT
participated in design, statistical evaluation, and helped to draft the manuscript.
ML participated in recruitment and coordination. JK and AWM participated in
recruitment, data collection, and helped to draft the manuscript, BWSR
participated in study design and helped to draft the manuscript, TBa and TBr
participated in the study design and coordination. JC participated in the design
and coordination of the study and to draft the manuscript. All authors read and
approved the final manuscript.
Competing interests
The authors declare that they have no competing interests.
Consent for publication
Not applicable.
Ethics approval and consent to participate
All cases and all controls in Australia as well as Germany gave written informed
consent. The study was approved by the ethics committee of the Ruhr-University
Bochum (reference number 3217–08) and by the Sir Charles Gairdner Hospital
Human Research Ethics Committee (HREC) (reference number 2004–147).
Publisher’s Note
Springer Nature remains neutral with regard to jurisdictional claims in
published maps and institutional affiliations.
Page 11 of 12
Author details
1
Institute for Prevention and Occupational Medicine of the German Social
Accident Insurance (IPA), Institute of the Ruhr University Bochum,
Bürkle-de-la-Camp-Platz 1, 44789 Bochum, Germany. 2Lungenklinik
Heckeshorn, HELIOS Clinic Emil von Behring, Berlin, Germany. 3Department
of Respiratory Medicine, Sir Charles Gairdner Hospital, Perth, Australia.
4
School of Population Health, University of Western Australia, Perth, Australia.
5
National Centre for Asbestos Related Diseases, School of Medicine and
Pharmacology, University of Western Australia, Perth, Australia.
Received: 19 January 2016 Accepted: 18 May 2017
References
1. IARC. IARC monographs on the evaluation of the carcinogenic risk of
chemicals to man: asbestos. IARC Monogr Eval Carcinog Risk Chem Man.
1977;14:1–106.
2. IARC. Arsenic, metals, fibres, and dusts. IARC Monogr Eval Carcinog Risks
Hum. 2012;100C:11–465.
3. Schonfeld SJ, McCormack V, Rutherford MJ, Schuz J. Regional variations in
German mesothelioma mortality rates: 2000-2010. Cancer Causes Control.
2014;25(5):615–24.
4. AMR: Australian Mesothelioma Registry 3rd annual report: Mesothelioma in
Australia 2013. Canberra: Safe Work Australia; 2014.
5. Husain AN, Colby T, Ordonez N, Krausz T, Attanoos R, Beasley MB, et al.
Guidelines for pathologic diagnosis of malignant mesothelioma: 2012
update of the consensus statement from the international mesothelioma
interest group. Arch Pathol Lab Med. 2013;137(5):647–67.
6. Malerba M, Montuschi P. Non-invasive biomarkers of lung inflammation in
smoking subjects. Curr Med Chem. 2012;19(2):187–96.
7. Panou V, Vyberg M, Weinreich UM, Meristoudis C, Falkmer UG, Roe OD. The
established and future biomarkers of malignant pleural mesothelioma.
Cancer Treat Rev. 2015;41(6):486–95.
8. Creaney J, Dick IM, Robinson BW. Discovery of new biomarkers for
malignant mesothelioma. Current pulmonology reports. 2015;4(1):15–21.
9. Raiko I, Sander I, Weber DG, Raulf-Heimsoth M, Gillissen A, Kollmeier J, et al.
Development of an enzyme-linked immunosorbent assay for the detection
of human calretinin in plasma and serum of mesothelioma patients. BMC
Cancer. 2010;10:242.
10. Rogers JH. Calretinin: a gene for a novel calcium-binding protein expressed
principally in neurons. J Cell Biol. 1987;105(3):1343–53.
11. Doglioni C, Dei Tos AP, Laurino L, Iuzzolino P, Chiarelli C, Celio MR, et al.
Calretinin: a novel immunocytochemical marker for mesothelioma. Am J
Surg Pathol. 1996;20(9):1037–46.
12. Schwaller B, Celio MR, Doglioni C. Identification of calretinin and the
alternatively spliced form calretinin-22k in primary pleural mesotheliomas
and in their metastases. Anticancer Res. 2004;24(6):4003–9.
13. Blum W, Pecze L, Felley-Bosco E, Schwaller B. Overexpression or absence of
calretinin in mouse primary mesothelial cells inversely affects proliferation
and cell migration. Respir Res. 2015;16:153.
14. Arif Q, Husain AN. Malignant Mesothelioma Diagnosis. Arch Pathol Lab Med.
2015;139(8):978–80.
15. Ordonez NG. What are the current best immunohistochemical markers for
the diagnosis of epithelioid mesothelioma? A review and update. Hum
Pathol. 2007;38(1):1–16.
16. Chang K, Pastan I, Willingham MC. Isolation and characterization of a
monoclonal antibody, K1, reactive with ovarian cancers and normal
mesothelium. Int J Cancer. 1992;50(3):373–81.
17. Robinson BW, Creaney J, Lake R, Nowak A, Musk AW, de Klerk N, et al.
Mesothelin-family proteins and diagnosis of mesothelioma. Lancet. 2003;
362(9396):1612–6.
18. Beyer HL, Geschwindt RD, Glover CL, Tran L, Hellstrom I, Hellstrom KE, et al.
MESOMARK: a potential test for malignant pleural mesothelioma. Clin
Chem. 2007;53(4):666–72.
19. Creaney J, Olsen NJ, Brims F, Dick IM, Musk AW, de Klerk NH, et al. Serum
mesothelin for early detection of asbestos-induced cancer malignant
mesothelioma. Cancer Epidemiol Biomark Prev. 2010;19(9):2238–46.
20. Gube M, Taeger D, Weber DG, Pesch B, Brand P, Johnen G, et al.
Performance of biomarkers SMRP, CA125, and CYFRA 21-1 as potential
tumor markers for malignant mesothelioma and lung cancer in a cohort of
workers formerly exposed to asbestos. Arch Toxicol. 2011;85(3):185–92.
Johnen et al. BMC Cancer (2017) 17:386
21. Hollevoet K, Van Cleemput J, Thimpont J, De Vuyst P, Bosquee L, Nackaerts
K, et al. Serial measurements of mesothelioma serum biomarkers in
asbestos-exposed individuals: a prospective longitudinal cohort study. J
Thorac Oncol. 2011;6(5):889–95.
22. Weber DG, Casjens S, Johnen G, Bryk O, Raiko I, Pesch B, et al. Combination
of MiR-103a-3p and mesothelin improves the biomarker performance of
malignant mesothelioma diagnosis. PLoS One. 2014;9(12):e114483.
23. Weber DG, Taeger D, Pesch B, Kraus T, Brüning T, Johnen G. Soluble
mesothelin-related peptides (SMRP) - high stability of a potential tumor
marker for mesothelioma. Cancer Biomark. 2007;3(6):287–92.
24. Perkins NJ, Schisterman EF, Vexler A. Receiver operating characteristic curve
inference from a sample with a limit of detection. Am J Epidemiol. 2007;
165(3):325–33.
25. Peto R, Peto J. Asymptotically efficient rank invariant test procedures.
Journal of the Royal Statistical Society Series A. 1972;135:185–207.
26. Prentice RL. Linear rank tests with right censored data. Biometrika. 1978;
65(1):167–79.
27. Helsel DR. Nondetects and data analysis: statistics for censored
environmental data. New York: Wiley & Sons; 2005.
28. Isobe T, Feigelson ED, Nelson PI. Statistical methods for astronomical data
with upper limits. II Correlation and regression ApJ. 1986;306:490–507.
29. Neumann V, Günther S, Müller KM, Fischer M. Malignant mesothelioma–
German mesothelioma register 1987-1999. Int Arch Occup Environ Health.
2001;74(6):383–95.
30. Pesch B, Brüning T, Johnen G, Casjens S, Bonberg N, Taeger D, et al.
Biomarker research with prospective study designs for the early detection
of cancer. Biochim Biophys Acta. 2014;1844(5):874–83.
31. Blyuss O, Gentry-Maharaj A, Fourkala EO, Ryan A, Zaikin A, Menon U, et al.
Serial patterns of ovarian cancer biomarkers in a Prediagnosis longitudinal
dataset. Biomed Res Int. 2015;2015:681416.
32. Creaney J, Dick IM, Segal A, Musk AW, Robinson BW. Pleural effusion
hyaluronic acid as a prognostic marker in pleural malignant mesothelioma.
Lung Cancer. 2013;82(3):491–8.
33. Santarelli L, Staffolani S, Strafella E, Nocchi L, Manzella N, Grossi P, et al.
Combined circulating epigenetic markers to improve mesothelin
performance in the diagnosis of malignant mesothelioma. Lung Cancer.
2015;90(3):457–64.
34. Bononi I, Comar M, Puozzo A, Stendardo M, Boschetto P. Orecchia S, et al.
Oncotarget: Circulating microRNAs found dysregulated in ex-exposed
asbestos workers and pleural mesothelioma patients as potential new
biomarkers; 2016.
35. Napolitano A, Antoine DJ, Pellegrini L, Baumann F, Pagano I, Pastorino S, et
al. HMGB1 and its Hyperacetylated isoform are sensitive and specific serum
biomarkers to detect asbestos exposure and to identify mesothelioma
patients. Clin Cancer Res. 2016;22(12):3087–96.
36. Maeda R, Tabata C, Tabata R, Eguchi R, Fujimori Y, Nakano T. Is serum
thioredoxin-1 a useful clinical marker for malignant pleural mesothelioma?
Antioxid Redox Signal. 2011;15(3):685–9.
37. Demir M, Kaya H, Taylan M, Ekinci A, Yilmaz S, Teke F, et al. Evaluation of
new biomarkers in the prediction of malignant mesothelioma in subjects
with environmental asbestos exposure. Lung. 2016;194(3):409–17.
38. Schneider MA. Muley T. Warth A, Thomas M, Herth FJ, et al. Glycodelin is a
potential novel follow-up biomarker for malignant pleural mesothelioma.
Oncotarget: Kahn NC; 2016.
39. Morre DJ, Hostetler B, Taggart DJ, Morre DM, Musk AW, Robinson BW, et al.
ENOX2-based early detection (ONCOblot) of asbestos-induced malignant
mesothelioma 4-10 years in advance of clinical symptoms. Clin Proteomics.
2016;13:2.
40. Park EK, Thomas PS, Creaney J, Johnson AR, Robinson BW, Yates DH. Factors
affecting soluble mesothelin related protein levels in an asbestos-exposed
population. Clin Chem Lab Med. 2010;48(6):869–74.
41. Cristaudo A, Foddis R, Bonotti A, Simonini S, Vivaldi A, Guglielmi G, et al.
Two novel polymorphisms in 5′ flanking region of the mesothelin gene are
associated with soluble mesothelin-related peptide (SMRP) levels. Int J Biol
Markers. 2011;26(2):117–23.
42. Garritano S, De Santi C, Silvestri R, Melaiu O, Cipollini M, Barone E, et al. A
common polymorphism within MSLN affects miR-611 binding site and soluble
mesothelin levels in healthy people. J Thorac Oncol. 2014;9(11):1662–8.
43. Garte S, Gaspari L, Alexandrie AK, Ambrosone C, Autrup H, Autrup JL, et al.
Metabolic gene polymorphism frequencies in control populations. Cancer
Epidemiol Biomark Prev. 2001;10(12):1239–48.
Page 12 of 12
44. Pepe MS, Feng Z, Janes H, Bossuyt PM, Potter JD. Pivotal evaluation of the
accuracy of a biomarker used for classification or prediction: standards for
study design. J Natl Cancer Inst. 2008;100(20):1432–8.
45. Creaney J, Christansen H, Lake R, Musk AB, de Klerk N, Robinson BW. Soluble
mesothelin related protein in mesothelioma. J Thorac Oncol. 2006;1(2):172–4.
46. Behrens T, Stenzl A, Brüning T. Factors influencing false-positive results for
nuclear matrix protein 22. Eur Urol. 2014;66(5):970–2.
Submit your next manuscript to BioMed Central
and we will help you at every step:
• We accept pre-submission inquiries
• Our selector tool helps you to find the most relevant journal
• We provide round the clock customer support
• Convenient online submission
• Thorough peer review
• Inclusion in PubMed and all major indexing services
• Maximum visibility for your research
Submit your manuscript at
www.biomedcentral.com/submit