Inhibition of MMP-2 and MMP-9 decreases cellular migration, and angiogenesis in in vitro models of retinoblastoma
Bạn đang xem bản rút gọn của tài liệu. Xem và tải ngay bản đầy đủ của tài liệu tại đây (1.72 MB, 11 trang )
Webb et al. BMC Cancer (2017) 17:434
DOI 10.1186/s12885-017-3418-y
RESEARCH ARTICLE
Open Access
Inhibition of MMP-2 and MMP-9 decreases
cellular migration, and angiogenesis in
in vitro models of retinoblastoma
Anderson H. Webb1†, Bradley T. Gao1†, Zachary K. Goldsmith1†, Andrew S. Irvine1, Nabil Saleh1, Ryan P. Lee1,
Justin B. Lendermon1, Rajini Bheemreddy1, Qiuhua Zhang1, Rachel C. Brennan1,3, Dianna Johnson1, Jena J. Steinle5,
Matthew W. Wilson1,4 and Vanessa M. Morales-Tirado1,2*
Abstract
Background: Retinoblastoma (Rb) is the most common primary intraocular tumor in children. Local treatment of
the intraocular disease is usually effective if diagnosed early; however advanced Rb can metastasize through routes
that involve invasion of the choroid, sclera and optic nerve or more broadly via the ocular vasculature. Metastatic
Rb patients have very high mortality rates. While current therapy for Rb is directed toward blocking tumor cell
division and tumor growth, there are no specific treatments targeted to block Rb metastasis. Two such targets are matrix
metalloproteinases-2 and -9 (MMP-2, −9), which degrade extracellular matrix as a prerequisite for cellular invasion and
have been shown to be involved in other types of cancer metastasis. Cancer Clinical Trials with an anti-MMP-9
therapeutic antibody were recently initiated, prompting us to investigate the role of MMP-2, −9 in Rb metastasis.
Methods: We compare MMP-2, −9 activity in two well-studied Rb cell lines: Y79, which exhibits high metastatic potential
and Weri-1, which has low metastatic potential. The effects of inhibitors of MMP-2 (ARP100) and MMP-9 (AG-L-66085) on
migration, angiogenesis, and production of immunomodulatory cytokines were determined in both cell lines using qPCR,
and ELISA. Cellular migration and potential for invasion were evaluated by the classic wound-healing assay and a Boyden
Chamber assay.
Results: Our results showed that both inhibitors had differential effects on the two cell lines, significantly reducing
migration in the metastatic Y79 cell line and greatly affecting the viability of Weri-1 cells. The MMP-9 inhibitor (MMP9I)
AG-L-66085, diminished the Y79 angiogenic response. In Weri-1 cells, VEGF was significantly reduced and cell viability was
decreased by both MMP-2 and MMP-9 inhibitors. Furthermore, inhibition of MMP-2 significantly reduced secretion of
TGF-β1 in both Rb models.
Conclusions: Collectively, our data indicates MMP-2 and MMP-9 drive metastatic pathways, including migration, viability
and secretion of angiogenic factors in Rb cells. These two subtypes of matrix metalloproteinases represent new potential
candidates for targeted anti-metastatic therapy for Rb.
Keywords: Matrix metalloproteinases, MMP-2, MMP-9, Retinoblastoma, Therapy, Metastasis, VEGF, TGF-β1
* Correspondence:
†
Equal contributors
1
Department of Ophthalmology, Hamilton Eye Institute, the University of
Tennessee Health Science Center, 930 Madison Ave, Room 756, Memphis, TN
38163, USA
2
Department of Microbiology, Immunology and Biochemistry, the University
of Tennessee Health Science Center, Memphis, TN, USA
Full list of author information is available at the end of the article
© The Author(s). 2017 Open Access This article is distributed under the terms of the Creative Commons Attribution 4.0
International License ( which permits unrestricted use, distribution, and
reproduction in any medium, provided you give appropriate credit to the original author(s) and the source, provide a link to
the Creative Commons license, and indicate if changes were made. The Creative Commons Public Domain Dedication waiver
( applies to the data made available in this article, unless otherwise stated.
Webb et al. BMC Cancer (2017) 17:434
Background
Retinoblastoma (Rb) is the most common primary intraocular tumor in children with an incidence of approximately 12 cases per million children under 4 years of age
in the United States [1]. Mutation of the tumor suppressor
gene, RB1, can lead to the disease sporadically or through
inheritance. Germline mutations of RB1 account for approximately 40% of cases and exhibit an autosomal dominant pattern of inheritance [2]. Germline RB1 often
affects both eyes whereas the more common sporadic
form of the disease is often unilateral and accounts for
60% of all cases [2]. If diagnosed early, intraocular retinoblastoma can be effectively treated; however, the more advanced disease can metastasize to the central nervous
system (CNS) in which case, mortality rates are greatly increased [3]. Initial tumor invasion from the retina to the
sclera and post laminar optic nerve often pre-stages CNS
metastasis and is indicative of high risk for later CNS
metastasis [3]. Clinical risk factors that increase the
incidence of metastasis in these patients include older age
[4–6], laterality [7], vascularity [8, 9], and stage present
upon diagnosis [10].
The dissemination of malignant neoplasms is assumed
to require degradation of different components of the
matrix and basement membrane. Matrix metalloproteinases (MMPs) are responsible for degradation of a number
of extracellular matrix (ECM) components. There are over
20 recognized MMPs, each with specific substrate requirements and structural domains [11–13]. Among these are
two highly associated with tumor dissemination and invasiveness [14, 15]: MMP-2 (aka gelatinase A) and MMP-9
(aka gelatinase B), which degrade type IV collagen and
gelatin substrates. Cumulative work in different solid tumors has generated great interest in the development of
MMP inhibitors (MMPI) as potential therapeutic antimetastatic agents. Some synthetic MMPI have been tested
in clinical trials in solid tumors other than Rb and show
different levels of efficacy [16, 17]. Recent Clinical Trials
by Gilead Sciences are evaluating MMP activity in different solid tumors, including non-small cell lung carcinoma
(NSCLC), pancreatic adenocarcinoma, colorectal cancer
(CRC) and breast cancer, and their effect in the tumor
microenvironment by using an anti-MMP-9 therapeutic
antibody [18]. The antibody, GS-5745 [19], is a humanized
monoclonal antibody against MMP-9, which upon binding MMP-9 results in inhibition of ECM degradation and
possibly a reduction in tumor growth and risk of metastasis. Immunohistochemical analysis of primary Rb tumors
show that MMP-2 and MMP-9 protein levels are higher
in samples that had invaded the optic nerve [20, 21]. To
our knowledge, the effects of MMPI on Rb have not been
analyzed comprehensively in vitro. Here, we provide a detailed analysis of two MMPI on cellular viability, levels of
pro-angiogenic factors, migration and immunomodulatory
Page 2 of 11
proteins in two well-studied Rb cell lines: Y79 and Weri-1.
These two Rb cell lines have somewhat different characteristics, with Y79 exhibiting inherent metastatic properties
and Weri-1 exhibiting non-metastatic properties. Our aim
was to examine responses of both cell lines since it is likely
that Rb tumors in vivo may contain mixed populations of
tumor cells with varying metastatic potential. Our results
demonstrate that pharmacological inhibition of MMPs reduces Rb cell viability, migration, and secretion of the proangiogenic factors VEGF and Angiopoietin-2 in either one
or both types of Rb cell lines. These promising findings
provide an impetus for future in vivo studies to evaluate
MMPI as a potential adjunct therapy for Rb patients.
Methods
Cell lines, growth media and tissue culture
Y79 (ATCC-HTB-18) [22], Weri-1 (ATCC-HTB-169)
[23], Retinoblastoma (Rb) tumor cell lines were purchased
from the American Type Culture Collection (ATCC,
Manassas, VA). Cells were grown in RPMI-1640 (MediaTech, Herndon, VA) supplemented with 10% Fetal Bovine
Serum (Hyclone, Logan, UT), 1% of Penicillin G Sodium
Salt/Streptomycin Sulfate (100X) (Lonza). Rb cell lines
were grown under different conditions, including ARP100
(MMP-2 inhibitor, Santa Cruz Biotechnology) at 5 μM
and AG-L-66085 (MMP-9 inhibitor, Santa Cruz Biotechnology) at 5 μM concentration, unless otherwise specified.
Incubation proceeded overnight at 37 °C/5%CO2. The
IC50 values for ARP100: MMP-2: 12 nM; MMP-3: 4.5 μM;
MMP-7: 50 μM. The IC50 values for AG-L-66085: MMP9: 5 nM; MMP-1: 1.05 μM.
qPCR analyses
RNA isolation
RNA from 2.5 × 10⁶ Rb cells was extracted following the
Qiagen® miRNeasy Mini Kit (Qiagen, Valencia, CA)
manufacturer’s recommendations. Cells were lysed and
homogenized prior to addition of chloroform. The upper
colorless phase was transferred to a clean tube after centrifugation followed by 100% ethanol precipitation. The
extract was passed through a spin column followed by
on-column DNase digestion. The column membrane
was washed with RNase free water for RNA elution.
RNA concentration was assessed by analysis on Nanodrop Spectophotometer.
cDNA synthesis and pre-amplification
Synthesis of cDNA was performed using the SuperScript®
VILO™ cDNA Synthesis Kit (Life Technologies, Grand
Island, NY). Following manufacturer’s directions we used
100 ng of RNA and combined them with Reaction Buffer
and Enzyme Mix. Material was pre-amplified using
TaqMan® PreAmp Master Mix as before [24] and the
primers analyzed to use minimal amounts of material
Webb et al. BMC Cancer (2017) 17:434
Page 3 of 11
while increasing sensitivity of detection. The reaction was
kept at −20 °C until ready to use.
min at RT followed by addition of stop solution prior
to measuring O.D. at 405 nm.
PCR
Western blot assays
We used the following Human TaqMan® Gene Expression Assays: HPRT1 (Hs02800695_m1), MMP2
(Hs01548727_m1), MMP7 (Hs01042796_m1), MMP9
(Hs00234579_m1), MMP14 (Hs01037003_g1) all from
Life Technologies (Grand Island, NY). A final volume of
10 μL was loaded into each well after combination of
TaqMan® Universal Master Mix, cDNA, primers and
Nuclease Free water. Plates were run using Roche®
LightCycler 480 and data were analyzed using the
Comparative Ct Method as in [24, 25].
Cells were lysed in RIPA Buffer (Life Technologies) as
previously described [26]. Protein concentrations were
calculated using the Pierce™ BCA Protein Assay Kit
(Thermo Scientific). A total of 50 μg of denatured protein was used for each sample loaded in a Bolt™ 4–12%
Bis-Tris Plus Gel (Invitrogen), following manufacturer’s
instructions. Membrane was blocked in 20 mL of Pierce™
Fast Blocking Buffer followed by incubation with antibodies. Primary antibodies used: MMP-2 (D8N9Y) rabbit
monoclonal antibody at 1:1000, MMP-9 rabbit polyclonal
antibody at 1:1000, E2F rabbit polyclonal antibody at
1:1000, and β-Actin (D6A8) rabbit monoclonal antibody
HRP conjugated at 1:1000. Secondary antibody was Antirabbit IgG, HRP-linked at 1:2000. All antibodies were from
Cell Signaling Technologies® (Danvers, Massachusetts,
USA). We used the Biotinylated Protein Ladder Detection
Pack (Cell Signaling Technologies®), which includes the biotinylated protein ladder and the anti-biotin, HRP-linked
antibody. SuperSignal West Pico Chemiluminiscent Substrate (Thermo Scientific) was used to develop the signal.
Densitometry analysis was done using Kodak Molecular
Imager, as previously done [27–29].
siRNA experiments
Y79 Rb cells were plated overnight in 6-well plates at a
cell density of 2.5 × 10⁵ cells per well in 2 mL RPMI/
10% FBS (no antibiotics) final volume. Two solutions
were made: solution A contained 0.75 μg of siRNA into
100 μL of siRNA Transfection Medium (Santa Cruz
Biotechnology) per well; solution B contained 6 μL of
siRNA Transfection Reagent into 100 μL siRNA Transfection Medium. Silencers: MMP2: sc-29,398; MMP9:
sc-29,400; both from Santa Cruz Biotechnology. Solutions
A and B were mixed and incubated at RT for 30 min. Cells
were harvested and washed in siRNA Transfection
Medium. We proceeded to resuspend harvested cells in
800 μL of siRNA Transfection Medium per well. Added
the mixture of solutions A and B onto the cells, mixed
gently and incubated for 24 h at 37 °C/5%CO2. Next, we
added 1 mL of RPMI/20%FBS without removing the
transfection mixture and incubated cells for an additional
24 h prior to performing functional assays. As a control,
we used a scramble sequence that does not lead to degradation of any known cellular mRNA.
Protein assessment
Enzyme-linked immunosorbent assays (ELISA)
Human MMP-2, human MMP-9, human VEGF, and universal TGF-β1 ELISA kits were purchased from Life Technologies. Human Angiopoietin-2 was purchased from
Sigma-Aldrich (St. Louis, MO). All assays used manufacturer’s instructions. Biological replicates of cell lysates
(25 μg for MMP-2 and MMP-9; 40 μg for VEGF and
TGF-β1) were assayed in triplicates. After the addition of
the samples, all plates were incubated on a shaker at RT
for 2-h, according to instructions. Plates were washed and
incubated with their Biotin Conjugate on a shaker for 1-h
at RT followed by addition of Streptavidin-HRP at RT for
30-min. In the TGF-β1 Kit, these two steps were combined for a 3-h incubation as indicated by the protocol.
Afterwards, 100 μL of stabilized chromogen were
added to each well and incubated in the dark for 30-
Cellular proliferation
Quantitation of cell proliferation and viability was performed through use of CellTiter 96® AQueous Non-Radioactive assay (MTS) (Promega, Madison, Wisconsin, USA)
following manufacturer’s suggested guidelines. Briefly,
5.0 × 10⁴ Y79 and Weri-1 Rb cell lines were cultured per
well under different culture conditions: untreated, MMP2I,
and MMP9I. CellTiter 96® AQueous was added at a concentration of 10 μL of reagent per 100 μL volume per well at
specific time points of 0-, 48-, 72-, 96- and 120-h
after culture. After addition of CellTiter reagent, cells
were incubated at 37 °C/5% CO2 for an additional 2-h
before absorbance was read at 485 nm using 630 nm as a
reference.
Cell cycle
Y79 cells were plated under different cell culture conditions overnight at 37 °C/5% CO2. Next day cells were
then harvested and fixed in PBS/2% paraformaldehyde
(PFA) for 15 min on ice, then washed and permeabilized
using 0.1% Triton™ X-100 (Sigma-Aldrich) for 20 min.
We used far-red fluorescent DNA dye, DRAQ5™ (BioLegend, San Diego, CA, USA), at a 1:100 concentration in
PBS/1% FBS for 15 min on ice to assess cell cycle progression. This is a cell-permeant DNA binding anthraquinone dye, which intercalates between adenine and
thymine (A-T) bases of double stranded DNA. DRAQ5™
Webb et al. BMC Cancer (2017) 17:434
was excited at 642 nm and acquired using a 642 to
740 nm filter on the Amnis FlowSight® imaging cytometer
(Amnis Corporation, EMD Millipore, Seattle, WA, USA).
Data was acquired and analyzed by INSPIRE and IDEAS
v6.2 softwares, respectively (Amnis Corporation).
Migration and invasion assays
Migration/ wound healing assay
CytoSelect™ 24-well Would Healing Assay kit was purchased from Cell Biolabs Inc. (San Diego, CA). The 24well plate was pretreated with 500 μL of 0.1 mg/mL
Poly-L-Lysine hydrobromide (Sigma-Aldrich) per manufacturer’s instructions and incubated at 37 °C for 1-h.
Wells were washed with distilled sterile water twice and
dried in the biosafety cabinet for 2-h. We added 500 μL
of 1X attachment factors (Life Technologies) containing
gelatin (substrate of both MMP-2 and MMP-9) per well
and incubated at 37 °C for 30 min. Solution was aspirated and replaced by Rb cells at a concentration of
1.0 × 10⁶ cells/mL. Cell culture conditions included untreated, MMP2I, and MMP9I. We ensured cells were
evenly distributed and incubated the plate at 37 °C to create a 95% confluent monolayer of cells. The inserts were
removed; wells were washed twice with distilled sterile
water to remove unattached cells and debris. The cells
were then resuspended in 500 μL of respective culture
conditions. Pictures were taken and 0-, 2-, 6-, 24-, and 48h time points and analyzed for cell migration using an
Axiovert 40 CFL (Zeiss, Germany) at a 12.5× total magnification (lens 2.5×, objective 10×, and camera 0.5×).
Invasion assay
CytoSelect™ Cell Invasion Assay kit was purchased from
Cell Biolabs Inc. We use an 8 μm pore polycarbonate
membrane coated with basement membrane matrix solution. Rb cell suspension (serum free media) was placed in
the upper chamber to determine the invasion capacity of
the cells after degradation of the matrix membrane proteins 6 h post culture. Invasive cells were stained and
quantified with a light microscope under 100× total magnification (lens 2.5×, objective 40×), with 4 individual
fields per insert. Inserts were placed to wells containing
200 μL of Extraction Solution followed by 10 min incubation at RT on an orbital shaker. Quantitation of cells measured at OD 560 nm using spectrophotometer.
Statistical analysis
Data on bar graphs are expressed as means ± SD or ±
SEM (as indicated), with p < 0.05 considered statistically
significant. The data were compared where appropriate by
paired Student t test or by the Holm-Sidak Method, with
alpha = 5.0%.
Page 4 of 11
Results
Inhibition of MMP-2 and MMP-9 decreases migration
in the metastatic Y79 Rb cell line, and viability in the
non-metastatic Weri-1 model
Tumor migration and invasion of the optic nerve and
the uvea has a significant impact in the prognosis of Rb.
To investigate the effects of inhibition of MMP-2 and
MMP-9 on the migration of Rb cells we used both a
metastatic model represented by the Y79 cell line and a
non-metastatic model, represented by the Weri-1 cell
line. Cells were added to the upper chamber of an 8 μm
polycarbonate membrane coated with basement membrane proteins in serum free media. The lower chamber
had media in the presence or absence of the MMPI. We
used ARP100 as an inhibitor of MMP-2 at a 5 μM concentration; and AG-L-66085 as a MMP-9 inhibitor at a
5 μM concentration, as previously described [30]. Our
results showed a significant reduction of Rb cell migration
through the basement membrane, or extracellular matrix
(ECM), suggesting MMP-2 and MMP-9 activity are necessary to degrade ECM and promote cellular invasion in Rb.
In Fig. 1a we show a representative field for each insert.
Quantitation analyses shown in Fig. 1b show statistical
difference between untreated Y79 and those treated with
the MMPI (Y79 Rb cells, Untreated versus MMP2I:
0.397 ± 0.06 versus 0.260 ± 0.010, p = 0.01; versus
MMP9I: 0.225 ± 0.005, p = 0.0009; Weri-1 Rb cells, Untreated versus MMP2I: 0.164 ± 0.028 versus 0.061 ± 0.014,
p = 0.043; versus MMP9I: 0.056 ± 0.018, p = 0.0294).
Next, we adhered Rb cells to poly-L-lysine hydrobromide
coated surfaces and created artificial wounds of approximately 900 μm. The closure of the gap area was measured
at different time intervals for up to 48-h. We observed
Y79 untreated cells closed the gap area (Fig. 1c), while
MMP2I and MMP9I-treated Y79 cells showed a significant reduction in migration (Untreated versus MMP2I at
24 h: 315 ± 45 versus 742.5 ± 22.5, p = 0.0001; versus
MMP9I: 810 ± 36.7, p = 0.0001). Migration potential as
measured by the wound-healing assay revealed that inhibition of either MMP-2 or MMP-9 caused a significant
reduction of Y79 cells migration. Cellular viability assays
(Additional file 1: Figure S1) showed both MMP2I and
MMP9I significantly reduced the viability of Y79 cells (Untreated versus MMP2I: 116.67% ± 1.40 versus 42.66% ± 1.4,
p < 0.005; versus MMP9I: 32% ± 0, p < 0.005). In addition
to the cytotoxic effect we observed a significant increase in
the percentage of cells within the G0/G1 cell cycle phase in
Y79 cells treated with MMP9I compared to those untreated
(Additional file 1: Figure S1, Untreated versus MMP9I: G0/
G1 phase: 32.44% ± 0.907 versus 49.51 ± 1.059; S phase:
5.23% ± 0.165 versus 5.28% ± 0.062; G2/M phase:
5.16% ± 0.117 versus 4.252% ± 0.335).
We were unable to carry out the migration assay using
Weri-1 cells because these cells detached from the
Webb et al. BMC Cancer (2017) 17:434
Page 5 of 11
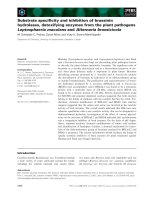
Fig. 1 Inhibition of MMP-2 and MMP-9 reduced Rb migration. a-b Y79 and Weri-1 cells were added to the upper chamber of an 8 μm polycarbonate
membrane coated with basement membrane proteins in serum free media. The lower chamber contained cell culture media with or without MMPI.
Six-hours post culture, invasive cells degraded the ECM and were collected, stained and counted. Representative figures are shown in a with a 100×
total magnification. Cells were extracted and OD measured in b left for Y79 and right for Weri-1. c Y79 Rb cells were cultured in the presence or
absence of MMP-2 or MMP-9 inhibitors for 48-h on poly-L-lysine coated wells with gelatin as substrate. Sterile in-well inserts created a gap of 900 μm.
Gap closure was recorded at different time intervals using an Axiovert 40 CFL. Total magnification is 12.5×. Plotted results are in c right. d Weri-1 cells
showed increased cell death and detachment from coated surface. For each condition n = 3; gap was measured in 5 different points
surface of the wells after treatment with either of the inhibitors (Fig. 1d), which precluded any meaningful
measurement. To better understand this we did a titration assay (500 nM to 25 μM range) of the MMPI to investigate the sensitivity of Weri-1 Rb cells to MMP2I
(left) and MMP9I (right). Results shown in Additional
file 2: Figure S2 revealed Weri-1 Rb cells are sensitive to
inhibitors even at low concentrations.
Collectively, these findings support the conclusion that
MMP-2 and MMP-9 activity stimulates Rb cell migration in vitro and that similar pathways could be involved
in Rb metastasis in vivo.
Downregulation of MMP-2 and MMP-9 by pharmacological
inhibitors in Y79 cells
In Fig. 1a we investigated MMP-2 and MMP-9 activity
in migration behavior. We hypothesized that Y79, considered the metastatic model for Rb [31], has higher
levels of MMP2 and MMP9 at mRNA and protein levels
compared to the non-metastatic Weri-1. Qualitative
PCR analysis shown in Fig. 2a revealed Y79 had higher expression of both MMP2 and MMP9 mRNA transcripts
compared to Weri-1, as we hypothesized (Y79, MMP2:
4.116 ± 0.3, MMP9: 7.186 ± 0.4; Weri-1, MMP2: 2.1 ± 0.4,
MMP9: 3.78 ± 0.4). Additional analyses were performed
to investigate if other MMPs associated with tumor invasion were expressed in these Rb cell lines. We found no
detection (ND) of MMP7 mRNA, but found expression of
MMP14 (7.96 ± 0.8) in Y79 cells. Given the recent emphasis in the role of MMP-2 and MMP-9 in ECM degradation and cancer invasion we are focusing our studies on
investigating MMP-2 and MMP-9 activity in Rb.
MMP regulation occurs primarily at the transcriptional
level. Next, we verified the effectiveness of the used MMPI
in downregulation of MMP gene expression in both Rb
models. As shown in Fig. 2b, there was a significant reduction in the mRNA expression of both MMP2 and MMP9
by their respective inhibitors in Y79 cells. Similar results
were found in Weri-1 cells (Fig. 2c). These results confirmed that MMPI inhibited MMP function by downregulation of MMP2 and MMP9 mRNA expression. Due to
our laboratory’s interests in invasion and tumor aggressiveness we concentrated the rest of our investigations on
Y79, the more aggressive and metastatic Rb tumor model.
Despite inhibition of MMP2 mRNA, we still observed
intracellular protein by Western blot (Wb) analysis
(Fig. 2e), but a significant reduction by ELISA (Fig. 2g,
Untreated versus MMP2I: 237 ± 9 versus 179 ± 10,
Webb et al. BMC Cancer (2017) 17:434
Page 6 of 11
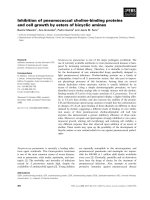
Fig. 2 Pharmacological inhibitors of MMP-2 and MMP-9 downregulate MMP2 and MMP9 mRNA. a The following MMPs were examined at the
transcriptional level: MMP2, MMP7, MMP9, and MMP14. Y79 (left) and Weri-1 (right) cells were harvested for RNA isolation and cDNA synthesis.
Material was pre-amplified using the TaqMan® PreAmp Master Mix with the respective primers. qPCR was done and results show mRNA expression
relative to HPRT1 as endogenous control. Bar graphs indicate results ±SD; n = 3 biological replicates in triplicates. Y79 Rb cells express MMP2, MMP9
and MMP14; Weri-1 expressed MMP2 and MMP9. b-c Y79 (b) and Weri-1 (c) cells were treated with MMP-2 and MMP-9 inhibitors overnight. RNA and
cDNA was extracted as in a showing that the inhibitors act at the transcriptional level. Bar graphs indicate fold change ±SD; n = 3. Standard deviation
obtained from the biological replicates. d Knockdown of MMP2 and MMP9 by RNA interference shows on-target effects. Downregulation of MMP2
and MMP9 after siRNA compared to scramble samples. qPCR done as in a. e-f Reduction of MMP-2 and MMP-9 protein in Rb cells treated with MMPI
(e) and siRNA (f); *p < 0.05, **p < 0.005. Western blot bar graphs indicate results ±SEM ratio of target protein to β-actin; n = 3. g-h ELISA analyses of
MMP-2 and MMP-9 protein of whole cell lysates after treatment with MMPI (g) or siRNA (h); *p < 0.05, **p < 0.005. i-j, E2F regulates MMP expression in
Y79 cells. Y79 cells treated with MMPI (i) or with siRNA (j) were assessed by Wb analysis for E2F. Western blot bar graphs indicate results ±SEM ratio of
target protein to β-actin; n = 3; **p < 0.005
p < 0.005; versus MMP9I: 260 ± 17, p = 0.266). The difference could stem from the specificity of the assays, as the
ELISA measures active enzyme and the Wb measured
total protein. However, treatment with MMP9I showed a
significant reduction in MMP-9 intracellular protein by
both Wb and ELISA (Fig. 2e and g, Untreated versus
MMP2I: 124 ± 3 versus 115 ± 3, p = 0.106; versus MMP9I:
84 ± 6, p < 0.0005).
E2F belongs to a family of transcription factors that
regulate cell cycle and DNA replication in mammalian
cells [32]. We investigated the expression of E2F in Y79
Rb cells and if treatment with MMPI could modulate
their levels. As shown in Fig. 2i, there is a significant reduction of E2F levels in Y79 cells treated with MMP9I,
but not MMP2I, suggesting E2F regulates MMP-9 expression. Next, we investigated if this was an on-target
Webb et al. BMC Cancer (2017) 17:434
effect of the MMP9I by using siRNA. We targeted
MMP2 and MMP9 and confirmed downregulation of
their gene expression and proteins levels (Fig. 2d–h). The
results in Fig. 2j showed a significant reduction in E2F
levels by both MMP2 and MMP9 siRNA compared to the
scramble group, suggesting this is not an off-target effect
of downregulation of the MMP-2 and MMP-9.
Pharmacological inhibition of MMPs reduces secretion of
angiopoietin-2, but not VEGF, in Y79 cells
Retinoblastoma tumors are highly angiogenic. Aqueous
humor from enucleated Rb eyes has been shown to trigger
significant angiogenic activity [33]. One key angiogenic
factor is vascular endothelial growth factor (VEGF), shown
by Hollborn and colleagues [34] to stimulate MMP-9 production in human retinal pigment epithelial cells. To further examine possible mechanisms by which MMPs might
stimulate migration and other pro-metastatic processes in
Rb disease, we analyzed the effects of MMP inhibition on
production of angiogenic factors, including VEGF and
Angiopoietin-2. As shown in Fig. 3a left, there was no significant reduction in VEGF secretion in Y79 cells after
treatment with MMP2I, but there was a significant increase when MMP9I was used (Untreated versus MMP2I:
366 ± 44 pg/mL versus 418 ± 37 pg/mL; p = 0.83; versus
MMP9I: 440 ± 10 pg/mL; p = 0.01;). Holash and colleagues [35] reported that both VEGF and Angiopoietin-2,
or perhaps the equilibrium between the two, influence
Page 7 of 11
tumor growth and vascular regression, prompting us to
measure the effects of MMPI on Angiopoietin-2. The protein levels of Angiopoietin-2 in Y79 were reduced, although marginally significant, by MMP9I (Fig. 3b left: Y79
Untreated versus MMP2I: 1120.3 ± 65 pg/mL versus
1067.6 ± 153 pg/mL, p = 0.552; versus MMP9I:
990 ± 90 pg/mL, p = 0.05). In contrast, as shown in Fig.
3a right, the non-metastatic Rb cell line Weri-1 showed a
significant reduction in VEGF after MMP9I treatment
(Untreated versus MMP2I: 371 ± 75 pg/mL versus
270 ± 95 pg/mL, p = 0.221; versus MMP9I: 228 ± 60 pg/
mL; p = 0.005) but a significant increase in Angiopoietin-2
(Untreated versus MMP2I: 883 ± 10 versus 1190 ± 13,
p < 0.005; versus MMP9I: 1495 ± 147, p < 0.005) after
treatment (Fig. 3b right). Collectively, these results showed
that in the metastatic Y79 cell line, we observed a significant increase in VEGF by MMP9I, and a reduction, albeit
minimal in Angiopoietin-2 (p = 0.05). The opposite was
observed in Weri-1, as there was a significant reduction in
VEGF by MMP9I and a significant increase in
Angiopoietin-2 by MMP2I and MMP9I. These results
highlight the complexity associated with Rb disease.
Transforming Growth Factor-beta 1 (TGF-β1) is a potent immunosuppressor of cytotoxic cells by depressing
cytolytic ability and thus promoting metastases. Recent
work suggests MMPs may stimulate TGF-β1 activity [26,
32, 36]. To determine if inhibition of MMP-2 or MMP-9
could affect the TGF-β1 pathway in Rb, we measured
Fig. 3 MMP inhibition reduces angiogenic protein levels. Y79 and Weri-1 cells were cultured in the presence or absence of the MMPI overnight. Next
day, we collected cell lysates (a-b) and supernatants to investigate protein levels by ELISA. a shows VEGF protein levels; b shows Ang-2 protein levels
and c, shows levels of TGF-β1, an immunomodulator. In all secretion analyses bar graphs indicate results ±SD; n = 3; *p < 0.05, **p < 0.005, #p = 0.05
Webb et al. BMC Cancer (2017) 17:434
secretion of TGF-β1 by Y79 cells after treatment with
the inhibitors. As shown in Fig. 3c left, TGF-β1 secretion
was significantly reduced in Y79 cells by either of the inhibitors (Untreated versus MMP2I: 47.0 ± 11 pg/mL versus
20.0 ± 4 pg/mL, p = 0.010; versus MMP9I: 20.7 ± 11 pg/
mL, p = 0.013). Similarly, we tested TGF-β1 secretion in
Weri-1 cells (Fig. 3c right) and found it was significantly reduced after MMP-2 inhibition (Untreated versus MMP2I:
42.0 ± 4 pg/mL versus 13.2 ± 15 pg/mL, p = 0.012),
but not MMP-9 inhibition (Untreated versus MMP9I:
32 ± 9 pg/mL, p = 0.088). Here, we demonstrated the convolution associated with metastatic and non-metastatic Rb
cell lines. We found MMP-2 and MMP-9 exert direct
activity on the angiogenesis, production of TGF-β1 and
migration in Rb cell lines.
Discussion
Our work focuses on MMP-2 and MMP-9 activity in Rb,
the most common intraocular malignancy in children.
Consistent with previous reports, we show MMP-2 and
MMP-9 are present in Rb cell lines. For the first time in
retinoblastoma, we provide a comprehensive in vitro
analysis of two cell lines, Y79 and Weri-1, which represent the metastatic and non-metastatic model for Rb. As
part of our in depth analysis we compared both cell lines
in their response to several properties: invasion, cellular
migration, mRNA expression and protein levels of
MMP-2 and MMP-9, the production of the angiogenic
factors VEGF and Angiopoietin-2, and the immunomodulatory protein TGF-β1.
The outcomes of our experiments revealed differences
in several intrinsic properties associated with tumor progression in Y79 and Weri-1. Tumor cells in patients are
likely to have diverse cell populations that have varying
Page 8 of 11
metastatic potential, thus studying both cell lines provides important insight into actual properties of tumor
in vivo. While these two cell types both respond to
MMPI, they do so in different ways using different pathways. The MMPI used in this study mediate their effect
on Rb cells through inhibition of MMP2 and MMP9
mRNA in both Y79 and Weri-1. However, the effects on
angiogenic factors differ between cell types. Our results
suggest the mechanisms underlying the production of
angiogenic factors are different among these cells. The production of VEGF in Weri-1 may be more dependent on
MMP-2 or MMP-9 activity as there was a significant reduction in protein production after treatment with MMP2I
and MMP9I. Conversely, production of Angiopoietin-2 is
increased in Weri-1 after MMPI treatment suggesting
Angiopoietin-2 production is independent of MMP-2 or
MMP-9 activity. These results suggest these two angiogenic pathways are not involved in primary actions on
metastasis, as Weri-1 is the non-metastatic model. In contrast, Y79 cells showed a significant increase in VEGF production after MMPI treatment, although MMP9I reduced
Angiopoietin-2. This is of interest as Holash and colleagues
[35] previously described the dynamic balance in vessel regression and tumor growth using a rat glioma model. Two
key players in this model are angiopoietins (Ang) and
VEGF. Co-expression and increase in both VEGF and
Angiopoietin-2 are associated with blood vessel proliferation. According to the authors, if there is overexpression of
one of these players, there is vessel destabilization and
regression. Work from Zhu and colleagues [37] demonstrated that concomitant expression of VEGF and
Angiopoietin-2 resulted in increased microvessel density in
solid tumors [38] and cerebral angiogenesis. The coexpression of these angiogenic factors contributes to the
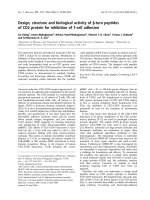
Fig. 4 Working model of the roles of MMP-2 and MMP-9 in retinoblastoma cells. Y79 and Weri-1 cells represent the metastatic and the non-metastatic
model for Rb, respectively. Our work shows differences in viability, migration and angiogenic-associated responses in Rb cells after inhibition of MMP-2
and MMP-9. a Y79 cells showed a profound defect in migration and invasion along with and a significant reduction in Angiopoietin-2 and TGF-β1 proteins.
These results highlight Y79’s migratory and invasive potential, which may be dependent upon MMPs. b Analyses of Weri-1 cells show MMP-2 and MMP-9
are involved in multiple processes, including viability of cells and VEGF, as well as TGF-β1 production
Webb et al. BMC Cancer (2017) 17:434
induction of microvessel sprouting in vascular networks
[39]. Collectively, our results show destabilization of angiogenic components, VEGF for Weri-1 and Angiopoietin-2
for Y79 Rb cells.
Transforming Growth Factor- beta 1 (TGF-β1) is a pleiotropic cytokine suggested to be the main inducer of tumor
epithelial-to-mesenchymal (EMT) transition (reviewed in
[40]) and to facilitate invasion by suppressing the host immune system [41, 42]. In this study we found TGF-β1 to
be significantly reduced after MMP2I treatment in both
Y79 and Weri-1 cells. Work from Kim and colleagues
highlighted the role of this cytokine in upregulation of
MMP-2 and MMP-9 in the MCF10A breast cancer cell
line [43]; it is also known that these MMPs participate in
TGFβ cleavage for further cytokine release. TGFβis the
focus of other studies in the lab as it was demonstrated to
be localized in proximity to tumor vasculature and to promote drug resistance [44].
Conclusions
Our work reveals differences in several intrinsic properties associated with tumor progression in two cell lines
representing the metastatic and non-metastatic form of
Rb, Y79 and Weri-1. Based on our findings we developed a working model shown in Fig. 4. In addition to
the intrinsic differences in Y79 and Weri-1, MMP-2 and
MMP-9 play different roles in these cells. MMP-2 and
MMP-9 activity stimulate Rb cell migration in Y79 and
contribute to cell viability in Weri-1 cells. Furthermore,
MMP-9 activity plays a role in Angiopoietin-2 production in Y79. In contrast, MMP-2 and MMP-9 play additional roles in Weri-1 cells. More work is needed to
follow up on these promising results. Taken together, we
provide a comprehensive in vitro analysis of MMP-2 and
MMP-9 activity in Rb in several checkpoints that are
deregulated in cancer. Our findings provide initial mechanistic insights into the benefits of potential MMP adjunct therapy in Rb patients.
Additional files
Additional file 1: Figure S1. Inhibition of MMP-2 or MMP-9 reduced Rb
viability and cell cycle progression. a, Y79 cells were cultured in the presence
or absence of the MMPI overnight. Next day, we collected cells and assessed
viability by Trypan Blue exclusion. Chemical inhibition of Y79 with MMPI
significantly reduced cell yield when compared to untreated cells. b, RNA
interference was used to confirm on-target effects of MMPIs. Y79 were
cultured in the presence of either MMP2 or MMP9 siRNA. MMP2 and MMP9
knockdown groups showed significant reduction in cell yield, illustrating an
on-target effect of MMPI. c, Imaging flow cytometry analysis showed
inhibition of MMP9 prevents progression of Rb cell division using nuclear
DRAQ5™ labeling. Bar graphs indicate results ± SEM to control. **p < 0.005.
(TIF 434 kb)
Additional file 2: Figure S2. Weri-1 Rb cells are sensitive to MMPI. Weri-1
cells were cultured in the presence or absence of MMPI. The MMPI were
used at a concentration range of 500 nM to 25 μM for up to 120 h. MTS
proliferation solution was added to each well at a concentration of 10 μL
Page 9 of 11
solution per 100 μL at specific time points (0-, 48-, 72-, 96-, and 120-h) and
incubated at 37 °C/5%CO2 for 2 h prior to reading on an absorbance reader.
Values represent are optical density (O.D.) ± SEM at 482 nm with a reference
wavelength of 630 nm. (TIFF 374 kb)
Abbreviations
aka: also known as; Ang-2: Angiopoietin-2; cDNA: complementary DNA;
CNS: Central Nervous System; DNA: Deoxyribonucleic acid; ECM: Extracellular
matrix; ELISA: Enzyme-Linked Immunosorbent Assay; MMP2: Matrix
metalloproteinase-2 gene; MMP-2: Matrix metalloproteinase-2 protein;
MMP9: Matrix metalloproteinase-9 gene; MMP-9: Matrix metalloproteinase-9
protein; MMPI: Matrix metalloproteinase inhibitor; mRNA: messenger
Ribonucleic Acid; OD: Optical density; PCR: Polymerase Chain Reaction;
qPCR: qualitative Polymerase Chain Reaction; Rb: Retinoblastoma;
RB1: Retinoblastoma 1 gene; RNA: Ribonucleic acid; SD: Standard deviation;
SEM: Standard error measurement; TGF-β1: Transforming Growth Factorbeta 1; VEGF: Vascular Endothelial Growth Factor
Acknowledgements
We would like to thank Dr. Michael Dyer at St. Jude Children’s Research Hospital
for helpful discussions; Drs. Lorraine Albritton and Michael Whitt from UTHSC
for their microscopy expertise and valuable input in the imaging analysis; and
members of the Morales-Tirado Lab for helpful discussions.
Funding
This work was supported by Juvenile Diabetes Research Foundation (2–2011-597
to JJS, VMT); National Eye Institute (R01-EY022330 to JJS); Oxnard Foundation (JJS);
Gerwin Fellowship (VMT); Fight for Sight (RPL); SJCRH Chair Endowment (MWW);
West Cancer Center (VMT); Research to Prevent Blindness (PI: James C. Fleming).
Availability of data and materials
The chemical structures and bioactivity screens for the MMP inhibitors used in
this article are available in www.scbt.com ARP-100: CAS 704888–90-4, sc-203,522;
AG-L-66085: CAS 1177749–58-5, sc-311,437. ARP-100 chemical structure data is
available in PubChem Substance (pubchem.ncbi.nlm.nih.gov), and bioactivity
screens available in PubChem BioAssay (www.ncbi.nlm.nih.gov/pcassay).
Information on Y79 and Weri-1 cells available in www.ncbi.nlm.nih.gov/
biosample and in www.atcc.org.
Authors’ contributions
AHW, BTG, ZKG: Performed experiments, data collection and analysis; AI, NS,
RPL, JBL, RB, QZ: performed experiments; RCB, DJ: participated in data
interpretation and wrote the manuscript; JJS, MWW: provided reagents,
participated in data interpretation and wrote the manuscript; VMT: conceived
and designed the experiments, performed data analysis and supervised
study. All authors read and approved the final manuscript.
Authors’ information
JJS is a Full Professor at Wayne State University with over 75 peer-reviewed
publications whose research specializes in beta-adrenergic function in glia and
vascular endothelium in healthy and diabetic retina. RCB is an Assistant Member
at St. Jude Children’s Research Hospital with expertise in complications of
retinoblastoma therapy and Phase I Clinical Trials in Solid Tumors. DJ is an
Emeritus Professor at the University of Tennessee Health Science Center with
over 30 years of experience in synaptic differentiation in neuronal tumors and
the expression of neurotransmitter agents in cancer. VMT is an Assistant
Professor at the Departments of Ophthalmology and Microbiology, Immunology
and Biochemistry (MIB) at the University of Tennessee Health Science Center
with expertise in human tumor immunology, intraocular tumors and pre-clinical
models of disease. MWW is a physician scientist with over 100 peer-reviewed
publications and over 15 book chapters in ophthalmic pathology, and oncology.
MWW and collaborators identified aberrant cellular pathways and epigenetic
regulators in Rb disease.
Competing interests
The authors declare that they have no competing interests.
Consent for publication
Not applicable.
Webb et al. BMC Cancer (2017) 17:434
Ethics approval and consent to participate
Not applicable.
Publisher’s Note
Springer Nature remains neutral with regard to jurisdictional claims in published
maps and institutional affiliations.
Author details
1
Department of Ophthalmology, Hamilton Eye Institute, the University of
Tennessee Health Science Center, 930 Madison Ave, Room 756, Memphis, TN
38163, USA. 2Department of Microbiology, Immunology and Biochemistry,
the University of Tennessee Health Science Center, Memphis, TN, USA.
3
Department of Oncology, St. Jude Children’s Research Hospital, Memphis,
TN, USA. 4Department of Surgery, St. Jude Children’s Research Hospital,
Memphis, TN, USA. 5Department of Anatomy and Cell Biology, Wayne State
University, Detroit, MI, USA.
Received: 13 June 2016 Accepted: 9 June 2017
References
1. Broaddus E, Topham A, Singh AD. Incidence of retinoblastoma in the USA:
1975-2004. Br J Ophthalmol. 2009;93(1):21–3. PubMed PMID: 18621794
2. Lohmann DR, Gallie BL. Retinoblastoma: revisiting the model prototype of
inherited cancer. Am J Med Genet C: Semin Med Genet. 2004;129C(1):23–8.
PubMed PMID: 15264269
3. Abramson DH, Ellsworth RM, Grumbach N, Kitchin FD. Retinoblastoma:
survival, age at detection and comparison 1914-1958, 1958-1983. J Pediatr
Ophthalmol Strabismus. 1985;22(6):246–50. PubMed PMID: 4078667
4. Abramson DH, Ellsworth RM, Grumbach N, Sturgis-Buckhout L, Haik BG.
Retinoblastoma: correlation between age at diagnosis and survival. J Pediatr
Ophthalmol Strabismus. 1986;23(4):174–7. PubMed PMID: 3746592
5. Erwenne CM, Franco EL. Age and lateness of referral as determinants of
extra-ocular retinoblastoma. Ophthalmic paediatrics and genetics. 1989;
10(3):179–84. PubMed PMID: 2587030
6. Rubenfeld M, Abramson DH, Ellsworth RM, Kitchin FD. Unilateral vs. bilateral
retinoblastoma. Correlations between age at diagnosis and stage of ocular
disease. Ophthalmology. 1986;93(8):1016–9. PubMed PMID: 3763146
7. Bader JL, Meadows AT, Zimmerman LE, Rorke LB, Voute PA, Champion LA,
et al. Bilateral retinoblastoma with ectopic intracranial retinoblastoma:
trilateral retinoblastoma. Cancer Genet Cytogenet. 1982;5(3):203–13.
PubMed PMID: 7066879
8. Messmer EP, Heinrich T, Hopping W, de Sutter E, Havers W, Sauerwein W.
Risk factors for metastases in patients with retinoblastoma. Ophthalmology.
1991;98(2):136–41. PubMed PMID: 2008269
9. Shields CL, Shields JA, Baez KA, Cater J, De Potter PV. Choroidal invasion of
retinoblastoma: metastatic potential and clinical risk factors. Br J Ophthalmol.
1993;77(9):544–8. PubMed PMID: 8218048. Pubmed Central PMCID: 513947
10. Sastre X, Chantada GL, Doz F, Wilson MW, de Davila MT, Rodriguez-Galindo
C, et al. Proceedings of the consensus meetings from the International
retinoblastoma staging working group on the pathology guidelines for the
examination of enucleated eyes and evaluation of prognostic risk factors in
retinoblastoma. Archives of pathology & laboratory medicine. 2009;133(8):
1199–202. PubMed PMID: 19653709
11. Klein T, Bischoff R. Physiology and pathophysiology of matrix
metalloproteases. Amino Acids. 2011;41(2):271–90. PubMed PMID: 20640864.
Pubmed Central PMCID: 3102199
12. Page-McCaw A, Ewald AJ, Werb Z. Matrix metalloproteinases and the
regulation of tissue remodelling. Nat Rev Mol Cell Biol. 2007;8(3):221–33.
PubMed PMID: 17318226. Pubmed Central PMCID: 2760082
13. Overall CM. Molecular determinants of metalloproteinase substrate
specificity: matrix metalloproteinase substrate binding domains, modules,
and exosites. Mol Biotechnol. 2002;22(1):51–86. PubMed PMID: 12353914
14. Wieczorek E, Jablonska E, Wasowicz W, Reszka E. Matrix metalloproteinases
and genetic mouse models in cancer research: a mini-review. Tumour
biology : the journal of the International Society for Oncodevelopmental
Biology and Medicine. 2015;36(1):163–75. PubMed PMID: 25352026. Pubmed
Central PMCID: 4315474
15. Foda HD, Zucker S. Matrix metalloproteinases in cancer invasion, metastasis and
angiogenesis. Drug Discov Today. 2001;6(9):478–82. PubMed PMID: 11344033
Page 10 of 11
16. Zucker S, Hymowitz M, Rollo EE, Mann R, Conner CE, Cao J, et al. Tumorigenic
potential of extracellular matrix metalloproteinase inducer. Am J Pathol. 2001;
158(6):1921–8. PubMed PMID: 11395366. Pubmed Central PMCID: 1891983
17. Devy L, Dransfield DT. New strategies for the Next generation of matrixmetalloproteinase inhibitors: selectively targeting membrane-anchored
MMPs with therapeutic antibodies. Biochem Res Int. 2011;2011:191670.
PubMed PMID: 21152183. Pubmed Central PMCID: 2989751
18. GileadSciences. [05.26.2016]. Available from: />show/NCT01803282?term=NCT01803282.
19. Marshall DC, Lyman SK, McCauley S, Kovalenko M, Spangler R, Liu C, et al.
Selective allosteric inhibition of MMP9 is efficacious in preclinical models of
ulcerative colitis and colorectal cancer. PLoS One. 2015;10(5):e0127063.
PubMed PMID: 25961845. Pubmed Central PMCID: 4427291
20. Adithi M, Nalini V, Kandalam M, Krishnakumar S. Expression of matrix
metalloproteinases and their inhibitors in retinoblastoma. J Pediatr Hematol
Oncol. 2007;29(6):399–405. PubMed PMID: 17551402
21. Long H, Zhou B, Jiang FG. Expression of MMP-2 and MMP-9 in retinoblastoma
and their significance. International journal of ophthalmology. 2011;4(5):489–91.
PubMed PMID: 22553708. Pubmed Central PMCID: 3340721
22. Reid TW, Albert DM, Rabson AS, Russell P, Craft J, Chu EW, et al. Characteristics of
an established cell line of retinoblastoma. J Natl Cancer Inst. 1974;53(2):347–60.
PubMed PMID: 4135597
23. McFall RC, Sery TW, Makadon M. Characterization of a new continuous cell
line derived from a human retinoblastoma. Cancer Res. 1977;37(4):1003–10.
PubMed PMID: 844036
24. Chintalapudi SR, Djenderedjian L, Stiemke AB, Steinle JJ, Jablonski MM,
Morales-Tirado VM. Isolation and Molecular profiling of primary mouse
retinal ganglion cells: comparison of phenotypes from healthy and
glaucomatous retinas. Front Aging Neurosci. 2016;8:93. PubMed PMID:
27242509. Pubmed Central PMCID: 4870266
25. Chintalapudi SR, Morales-Tirado VM, Williams RW, Jablonski MM. Multipronged
approach to identify and validate a novel upstream regulator of Sncg in mouse
retinal ganglion cells. FEBS J. 2016;283(4):678–93. PubMed PMID: 26663874
26. Morales-Tirado V, Johannson S, Hanson E, Howell A, Zhang J, Siminovitch
KA, et al. Cutting edge: selective requirement for the Wiskott-Aldrich
syndrome protein in cytokine, but not chemokine, secretion by CD4+ T
cells. J Immunol. 2004;173(2):726–30. PubMed PMID: 15240657
27. Gao BT, Lee RP, Jiang Y, Steinle JJ, Morales-Tirado VM. Pioglitazone alters
monocyte populations and stimulates recent thymic emigrants in the
BBDZR/Wor type 2 diabetes rat model. Diabetology & metabolic syndrome.
2015;7:72. PubMed PMID: 26336514. Pubmed Central PMCID: 4557231
28. Thakran S, Zhang Q, Morales-Tirado V, Steinle JJ. Pioglitazone restores
IGFBP-3 levels through DNA PK in retinal endothelial cells cultured in
hyperglycemic conditions. Invest Ophthalmol Vis Sci. 2014;56(1):177–84.
PubMed PMID: 25525174. Pubmed Central PMCID: 4294286
29. Zhang Q, Jiang Y, Toutounchian J, Wilson MW, Morales-Tirado V, Miller DD,
et al. Novel quinic acid derivative KZ-41 prevents retinal endothelial cell
apoptosis without inhibiting retinoblastoma cell death through p38
signaling. Invest Ophthalmol Vis Sci. 2013;54(9):5937–43. PubMed PMID:
23942968. Pubmed Central PMCID: 3762329
30. Vandenbroucke RE, Libert C. Is there new hope for therapeutic matrix
metalloproteinase inhibition? Nat Rev Drug Discov. 2014;13(12):904–27.
PubMed PMID: 25376097
31. Chevez-Barrios P, Hurwitz MY, Louie K, Marcus KT, Holcombe VN, Schafer P,
et al. Metastatic and nonmetastatic models of retinoblastoma. Am J Pathol. 2000;
157(4):1405–12. PubMed PMID: 11021842. Pubmed Central PMCID: 1850157
32. Ren B, Cam H, Takahashi Y, Volkert T, Terragni J, Young RA, et al. E2F
integrates cell cycle progression with DNA repair, replication, and G(2)/M
checkpoints. Genes Dev. 2002;16(2):245–56. PubMed PMID: 11799067.
Pubmed Central PMCID: 155321
33. Albert DM, Tapper D, Robinson NL, Felman R. Retinoblastoma and angiogenesis
activity. Retina. 1984 Summer-Fall;4(3):189–94. PubMed PMID: 6208587.
34. Hollborn M, Stathopoulos C, Steffen A, Wiedemann P, Kohen L, Bringmann
A. Positive feedback regulation between MMP-9 and VEGF in human RPE
cells. Invest Ophthalmol Vis Sci. 2007;48(9):4360–7. PubMed PMID: 17724228
35. Holash J, Maisonpierre PC, Compton D, Boland P, Alexander CR, Zagzag D,
et al. Vessel cooption, regression, and growth in tumors mediated by
angiopoietins and VEGF. Science. 1999;284(5422):1994–8. PubMed PMID:
10373119
36. Krstic J, Santibanez JF. Transforming growth factor-beta and matrix
metalloproteinases: functional interactions in tumor stroma-infiltrating
Webb et al. BMC Cancer (2017) 17:434
37.
38.
39.
40.
41.
42.
43.
44.
Page 11 of 11
myeloid cells. TheScientificWorldJOURNAL. 2014;2014:521754. PubMed
PMID: 24578639. Pubmed Central PMCID: 3918721
Zhu Y, Lee C, Shen F, Du R, Young WL, Yang GY. Angiopoietin-2 facilitates
vascular endothelial growth factor-induced angiogenesis in the mature
mouse brain. Stroke. 2005;36(7):1533–7. PubMed PMID: 15947259
Guo P, Imanishi Y, Cackowski FC, Jarzynka MJ, Tao HQ, Nishikawa R, et al.
Up-regulation of angiopoietin-2, matrix metalloprotease-2, membrane type
1 metalloprotease, and laminin 5 gamma 2 correlates with the invasiveness
of human glioma. Am J Pathol. 2005;166(3):877–90. PubMed PMID:
15743799. Pubmed Central PMCID: 1602359
Carmeliet P. Angiogenesis in health and disease. Nat Med. 2003;9(6):653–60.
PubMed PMID: 12778163
Derynck R, Zhang YE. Smad-dependent and Smad-independent pathways
in TGF-beta family signalling. Nature. 2003;425(6958):577–84. PubMed PMID:
14534577
Miettinen PJ, Ebner R, Lopez AR, Derynck R. TGF-beta induced
transdifferentiation of mammary epithelial cells to mesenchymal cells:
involvement of type I receptors. J Cell Biol. 1994;127(6 Pt 2):2021–36.
PubMed PMID: 7806579. Pubmed Central PMCID: 2120317.
Piek E, Moustakas A, Kurisaki A, Heldin CH, ten Dijke P. TGF-(beta) type I
receptor/ALK-5 and Smad proteins mediate epithelial to mesenchymal
transdifferentiation in NMuMG breast epithelial cells. J Cell Sci. 1999;112
(Pt 24):4557–68. PubMed PMID: 10574705
Kim ES, Kim MS, Moon A. TGF-beta-induced upregulation of MMP-2 and
MMP-9 depends on p38 MAPK, but not ERK signaling in MCF10A human
breast epithelial cells. Int J Oncol. 2004;25(5):1375–82. PubMed PMID: 15492828
Oshimori N, Oristian D, Fuchs E. TGF-beta promotes heterogeneity and drug
resistance in squamous cell carcinoma. Cell. 2015;160(5):963–76. PubMed
PMID: 25723170. Pubmed Central PMCID: 4509607
Submit your next manuscript to BioMed Central
and we will help you at every step:
• We accept pre-submission inquiries
• Our selector tool helps you to find the most relevant journal
• We provide round the clock customer support
• Convenient online submission
• Thorough peer review
• Inclusion in PubMed and all major indexing services
• Maximum visibility for your research
Submit your manuscript at
www.biomedcentral.com/submit