African-American esophageal squamous cell carcinoma expression profile reveals dysregulation of stress response and detox networks
Bạn đang xem bản rút gọn của tài liệu. Xem và tải ngay bản đầy đủ của tài liệu tại đây (1.53 MB, 13 trang )
Erkizan et al. BMC Cancer (2017) 17:426
DOI 10.1186/s12885-017-3423-1
RESEARCH ARTICLE
Open Access
African-American esophageal squamous
cell carcinoma expression profile reveals
dysregulation of stress response and detox
networks
Hayriye Verda Erkizan1, Kory Johnson2, Svetlana Ghimbovschi3, Deepa Karkera1, Gregory Trachiotis4, Houtan Adib5,
Eric P. Hoffman3,6 and Robert G. Wadleigh1,7*
Abstract
Background: Esophageal carcinoma is the third most common gastrointestinal malignancy worldwide and is largely
unresponsive to therapy. African-Americans have an increased risk for esophageal squamous cell carcinoma (ESCC), the
subtype that shows marked variation in geographic frequency. The molecular architecture of African-American ESCC is
still poorly understood. It is unclear why African-American ESCC is more aggressive and the survival rate in these patients
is worse than those of other ethnic groups.
Methods: To begin to define genetic alterations that occur in African-American ESCC we conducted microarray
expression profiling in pairs of esophageal squamous cell tumors and matched control tissues.
Results: We found significant dysregulation of genes encoding drug-metabolizing enzymes and stress response
components of the NRF2- mediated oxidative damage pathway, potentially representing key genes in African-American
esophageal squamous carcinogenesis. Loss of activity of drug metabolizing enzymes would confer increased sensitivity
of esophageal cells to xenobiotics, such as alcohol and tobacco smoke, and may account for the high incidence and
aggressiveness of ESCC in this ethnic group. To determine whether certain genes are uniquely altered in
African-American ESCC we performed a meta-analysis of ESCC expression profiles in our African-American
samples and those of several Asian samples. Down-regulation of TP53 pathway components represented the
most common feature in ESCC of all ethnic groups. Importantly, this analysis revealed a potential distinctive
molecular underpinning of African-American ESCC, that is, a widespread and prominent involvement of the
NRF2 pathway.
Conclusion: Taken together, these findings highlight the remarkable interplay of genetic and environmental
factors in the pathogenesis of African-American ESCC.
Keywords: mRNA expression, Microarray, Down-regulated genes, Up-regulated genes, Pathway analysis,
Targeted therapy
* Correspondence:
1
Institute for Clinical Research, Department of Veteran Affairs Medical Center
(VAMC), Washington, D.C., USA
7
Oncology Section, Washington DC VAMC, 50 Irving St. NW, Washington DC
20422, USA
Full list of author information is available at the end of the article
© The Author(s). 2017 Open Access This article is distributed under the terms of the Creative Commons Attribution 4.0
International License ( which permits unrestricted use, distribution, and
reproduction in any medium, provided you give appropriate credit to the original author(s) and the source, provide a link to
the Creative Commons license, and indicate if changes were made. The Creative Commons Public Domain Dedication waiver
( applies to the data made available in this article, unless otherwise stated.
Erkizan et al. BMC Cancer (2017) 17:426
Background
Esophageal cancer is the third leading gastrointestinal
malignancy worldwide with greater incidence in males
than in females. Patients with esophageal cancer (EC)
show limited response to multimodal treatments with an
overall five-year survival rate of only about 20% [1]. Due
to lack of effective screening for early detection, EC is
usually diagnosed at an advanced stage or when metastasis
has already occurred. Consistently reliable molecular
markers to monitor outcomes remain to be developed [2].
Esophageal cancer has two main histologic subtypes
and they arise in two distinct areas of the esophagus.
Adenocarcinoma of the esophagus (EAC) is mostly seen
in Western countries [3] while esophageal squamous cell
carcinoma (ESCC) is predominant in Eastern countries
and the eastern part of Africa [3]. Geographical and
genomic differences play a significant role in ESCC [4].
In African-Americans, ESCC is the predominant subtype, and the survival rate is worse than in patients of
other ethnic groups [5].
The combined action of genetic and environmental
factors is believed to underlie the etiology of esophageal
cancer. Recent genome-wide association studies, gene
expression profiling, DNA methylation and proteomic
studies conducted in Japanese and Chinese ESCCs
(reviewed in [6]) have identified multiple risk variants
and gene signatures associated with ESCC. These studies
presented additional evidence for the effect of environmental exposures such as alcohol intake, smoking,
opium abuse, hot food and beverage consumption, and
diet as risk factors for ESCC [3, 7–11].
Genetic and transcriptome analyses on AfricanAmerican ESCC have been particularly limited which
highlights the lack of understanding of the genetic architecture of ESCC in this ethnic group. In an earlier study
of black male ESCC samples, we detected loss of heterozygosity that spanned a significant portion of chromosome 18 [12]. To explore the entire anatomy of the
neoplastic genome in black ESCC, we performed comparative genomic hybridization (CGH) on a panel of 17
matched pairs of tumor and control esophageal tissues
[13]. Multiple chromosomal gains, amplifications and
losses that represent regions potentially involved in etiology defined the pattern of abnormalities in the tumor
genome [13]. We noted genomic imbalances that were
represented disproportionately in African-American
ESCC compared to those reported in ESCC of other
ethnic groups including Japanese [14–18], South African
black and mixed-race individuals [19], Taiwan Chinese
[20], Hong Kong Chinese [21], Chinese in Henan province [22], and Swedes [23].
The preponderance of chromosomal aberrations in
African-American ESCC predicts concomitant changes
in gene activity during carcinogenesis. We sought to
Page 2 of 13
identify dysregulated genes and pathways that could
define the expression signature in African-American
ESCC by conducting microarray expression profiling in
paired squamous esophageal tumors and normal tissue
specimens. Here, we report significant differential expression of a wide array of genes involved in multiple
pathways that may be crucial to causation and/or progression. Particularly noteworthy is the dysregulation of
NRF2 mediated oxidative stress genes and genes that encode drug-metabolizing enzymes and xenobiotics that
may, in part, contribute to the aggressive nature of
ESCC among blacks.
Methods
Samples
Seven paired specimens of the esophagus (tumor and
matching non-tumor tissues), each pair derived from the
same patient, were collected endoscopically or surgically
at the time of diagnosis, frozen and stored at -80 °C until
use. Staging indicated that all tumors included in this study
were at Stage IV. This study was done under a protocol
approved by the Washington D.C. VAMC Institutional
Review Board and a written informed consent was obtained from each patient prior to biopsy or surgery. The
demographics and risk factors of the patients are listed in
the Additional file 1.
RNA extraction
Tissue samples were subjected to total RNA extraction
using TRIzol-reagent (Invitrogen, Carlsbad, CA) and
purified with RNeasy Mini kit (Qiagen), according to the
manufacturer’s guidelines. The concentration of each
RNA sample was determined by NanoDrop spectrophotometer ND-1000 (NanoDrop Technologies, Wilmington,
DE). RNA quality was assessed using the Agilent 2100
Bioanalyzer (Agilent Technologies Inc., Santa Clara, CA).
cRNA preparation and expression profiling
An aliquot of 5 μg of high-quality total RNA from each
sample was used to synthesize cDNA and biotinylated
cRNA utilizing the Affymetrix GeneChip® Expression
3’Amplification One-Cycle Target Labeling and Control
Reagent kit according to manufacturer’s instructions.
Biotinylated cRNA was hybridized to Affymetrix GeneChips HG U133 Plus 2 (Affymetrix, Santa Clara, CA),
washed, stained on the Affymetrix Fluidics station 400
and scanned with a Hewlett Packard G2500A Gene
Array Scanner following Affymetrix instructions. All arrays used in the study passed the quality control set by
Tumor Analysis Best Practices Working Group [24].
Microarray data analysis
The Affymetrix scanner 3000 was used in conjunction with
Affymetrix GeneChip Operation Software to generate one.
Erkizan et al. BMC Cancer (2017) 17:426
CEL file per hybridized cRNA. These files have been deposited in NCBI Gene Expression Omnibus (GEO)
(www.ncbi.nlm.nih.gov/geo/) under the GEO accession
number of GSE77861 and are freely available for download.
The Affymetrix Expression Console was used to
summarize the data contained across all .CEL files and
generate 54,675 RMA normalized gene fragment expression values per file. Quality of the resulting values was
challenged and assured via Tukey box plot, covariancebased PCA scatter plot, and correlation-based heat map
using functions supported in “R” (www.cran.r-project.org).
Lowess modeling of the data (CV ~ mean expression) was
performed to characterize noise for the system and define
the low-end expression value at which the linear relationship between CV and mean was grossly lost (expression
value = 8). Gene fragments not having at least one sample
with an expression value greater than this low-end value
were discarded as noise-biased. For gene fragments not
discarded, differential expression was tested between
Tumor and Non-tumor biopsies via paired t-test under
Benjamini–Hochberg multiple comparison correction
condition (alpha = 0.05). Gene fragments having a corrected P < 0.05 by this test and an absolute difference of
means > = 1.5X were subset as those having differential
expression between Tumor and Non-Tumor. Gene annotations for these subset fragments were obtained from IPA
(www.ingenuity.com) along with the corresponding
enriched functions, enriched pathways, and significant
predicted upstream regulators. The analysis pipeline is
summarized in the Additional file 2.
Validation of results by real-time PCR
RT-PCR was performed for KRT17, PRDCSH, TNFRSF6B,
SELK, RAB5B, ALD, RAF genes. The delta-delta Ct calculation method was used for the quantification of the
RT-PCR results.
Pathway analysis
Ingenuity Pathway Analysis (IPA) (Qiagen- Build version
364,062 M, Content version 26,127,183) was used to determine perturbed pathways. In addition, we performed
IPA to identify perturbed pathways affected in ESCC
from different ethnic groups by utilizing publicly available datasets of ESCC mRNA expression microarrays
including GSE17351 [25], GSE20347 [26], GSE23400
[27], GSE29001 [28], GSE33426 [28], GSE33810 [29] and
GSE45670 [30] from the GEO repository (http://
www.ncbi.nlm.nih.gov/geo/). The characteristics of these
studies such as sample size, tissue storage, and control
tissue type are presented in the Additional file 3. The
differentially expressed gene lists were obtained by the
analysis with GEO2R ( />geo2r/). The p-values were adjusted with Benjamini and
Hochberg correction.
Page 3 of 13
Results
Transcriptome profiling of African-American ESCC tumors versus adjacent normal esophageal tissues revealed
significant differential expression of 756 genes comprising
340 over-expressed and 416 under-expressed loci that
were detected by 460 and 558 gene probes, respectively
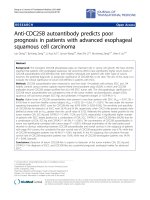
(Additional file 4). A volcano plot displayed genes that
underwent the highest alteration in expression (Fig. 1a).
Among the most strongly up-regulated genes are keratin
17 (KRT17), immunoglobulin genes including IGHG1 and
ornithine decarboxylase 1 (ODC1). Genes that showed a
huge loss of expression included cysteine-rich secretory
protein 3 (CRSP3) and sciellin (SCEL). Experimental validation of microarray results through a real-time PCR
assay on RNA derived from the same original samples for
selected up-regulated (KRT17, PRDCSH, TNFRSF6B) and
down-regulated (SELK, RAB5B, ALD, RAF) genes supported the microarray data (data not shown).
Principal component analysis of differentially expressed
genes indicated the magnitude of the co-variance between
paired tumor and non-tumor samples of each patient
(Fig. 1b). The first principal component contributed
57.9% of the variance among the samples. Correlationbased clustering of all differentially expressed genes
distinguished clearly tumor from the corresponding
non-tumor tissues (Fig. 1c).
Perturbed pathways and networks in African-American
ESCC
To determine the overall biological impact of the widespread transcriptional aberration in African-American
ESCC, we performed pathway and network analysis on
significantly dysregulated using Ingenuity Pathway Analysis
(IPA). The majority of differentially expressed genes
encoded a diversity of enzymes (Fig. 1d). Genes that coded
for transporters, transcription regulators, phosphatases,
translation regulators, ion channels and transmembrane
receptors were among those that were most prominently
down-regulated (Fig. 1d).
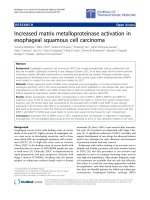
IPA detected the enrichment of 25 networks (Fig. 2,
Additional file 5), 14 of which were interconnected.
Networks 20, 21, and 22 displayed linkage to at least
five other networks representing the highest number
of interconnections. The cell cycle and organismal injury and abnormalities were the constituent pathways
of network 20. Network 21 included carbohydrate and
lipid metabolism and molecular transport, and network 22 comprised cell death and survival pathways.
(The complete list of genes in these networks is presented in Additional file 5).
Fifteen canonical pathways were significantly enriched
in African-American ESCC and the top three included
NRF2-mediated oxidative stress pathway, integrin signaling and protein ubiquitination, in that order (Fig. 2b,
Erkizan et al. BMC Cancer (2017) 17:426
a
Page 4 of 13
b
c
d
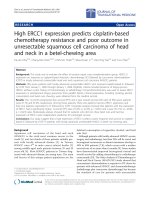
Fig. 1 Gene expression differences observed between paired Esophageal Tumor and Non-Tumor biopsies for seven patients. a Volcano Plot
depicting the differential expression testing results for 10,734 gene fragments. Gene fragments having significant difference in expression
between Tumor and Non-Tumor where the magnitude of difference is also > = 1.5X are represented as triangles (n = 756). b Covariancebased Principal Component Analysis (PCA) scatter plot depicting the paired sample relationships when the 756 gene fragments identified to
have significant difference in expression between Tumor and Non-Tumor are used. c Correlation-based clustered heat map depicting the
sample relationships (x-axis) when the 756 gene fragments identified to have significant difference in expression between Tumor and
Non-Tumor (y-axis) are used. d Bar plot describing the breakdown of the 756 gene fragments identified to have significant difference
in expression between Tumor and Non-Tumor by protein type (where known).
Additional file 6). The gene constituents of these pathways are presented in Additional file 7. These results
suggest that African-American ESCC is underpinned by
a dysregulation of genes that play an important role in
oxidative stress and xenobiotic metabolic responses.
Activation of NRF2 perturbs stress response and
detoxification pathways in ESCC
Enriched pathways involving stress response, xenobiotic
metabolism, and toxic response are noteworthy because
smoking and alcohol consumption have been consistently
Erkizan et al. BMC Cancer (2017) 17:426
Page 5 of 13
a
b
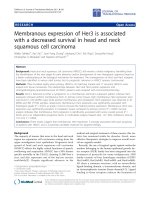
Fig. 2 Ingenuity Pathway Analysis (IPA) of ESCC. a Interconnected canonical pathways. Pathway 20 (injury and abnormalities and cell cycle),
pathway 21 (carbohydrate and lipid metabolism, and molecular transport), and pathway 22 (cell death and survival pathways) serve as hub for
interconnected canonical pathways. b The enriched canonical pathways in ESCC by IPA. The most enriched pathways represented the higher
–log(p-value). The white bar represents the genes that do not overlap with the data set. Green bar represents genes that are down-regulated
and red bar represents genes that are up-regulated. The gray bar demonstrates the genes without any change in expression.
shown to be strong contributing factors in ESCC etiology.
It was therefore important to focus on pathways involved
in detox networks.
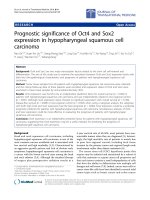
The NRF2-mediated oxidative stress response pathway
showed the highest enrichment (with a –log(p) of 6.25),
in general, and in the toxicology panel as well (Fig. 3).
NRF2 pathway is one of the primary mediators of detoxification and metabolism responses. Transcriptional
targets of NRF2 include genes involved in alcohol
metabolism such as ADH7, AKR1B1, ALDH3A1, and
ALDH7A1, all of which are differentially expressed in
our dataset (Additional file 8). Other targets that showed
altered expression in African-American ESCC include
genes with a wide range of function: MGST2, ABCC1,
ABCC5, GCLC GPX4, ACOX1, BLVRA, FTL1, CEBPB,
ACLY, ELOVL5, FABP5, ACAA1B.
IPA predicted that 19 upstream regulators are activated
in our dataset (Table 1 and Additional file 9). Nuclear
factor-erythroid 2 p45-related factor 2 gene, NFE2L2, a
known upstream regulator of the NRF2 pathway was predicted to have the highest activation z-score of 3.796,
followed by MEK, LDL, and CTNNB1 pathways, with
decreasing z-scores. In addition, MYC was predicted to be
an activated upstream regulator (Additional file 9).
The TP53 regulatory pathway was predicted to be the
most inhibited with a z-score of −3.113 and a p-value of
4.05E-19 (Table 1). In our sample, 99 differentially
expressed genes were downstream of the TP53 pathway
(Additional file 10). Inhibition of the TP53 pathway is a
hallmark of carcinogenesis and is predicted in our ESCC
dataset, as well.
Functional meta-analysis of gene expression of ESCC in
diverse ethnic groups
To determine whether African-American ESCC implicates genes that are unique or shared by ESCC of other
ethnic groups, we performed a meta-analysis that included our African-American ESCC expression data and
data from seven studies published in publicly available
datasets in the GEO database. We note that our expression profiling data is the first such study in AfricanAmerican ESCC to be deposited in the GEO repository.
ESCC expression profiles in GEO included those generated in Japan (GSE17351) [25], Hong Kong, China
(GSE33810) [29] and from various parts of China
(GSE23400 [27], GSE20347 [26], GSE45670 [30],
GSE33426 [28], and GSE29001 [28]). Ten genes that
Erkizan et al. BMC Cancer (2017) 17:426
Page 6 of 13
Fig. 3 The toxicology chart summarizes the enrichment of detoxification pathways enriched in our dataset by IPA. Ingenuity Pathway Analysis
(IPA) identified NRF2-mediated oxidative stress response pathway as the most enriched toxicology pathway. Blue bar represent –log(p-value)
and the ratio is the number of genes characterized in the dataset compared to the total number of genes belonging to that pathway
underwent the highest changes in expression in these
studies are listed in the Additional file 11. Of the upregulated genes, KRT17 was over-expressed in two other
studies, the rest of the up-regulated genes were ornithine
decarboxylase 1 (ODC1), Profilin 2 (PFN2), Glycoprotein
Nmb (GPNMB). Six out of 10 down-regulated genes
(CRISP3, TMPRSS11B, CLCA4, SCEL, SLURP1, KRT78)
were shared with four other studies.
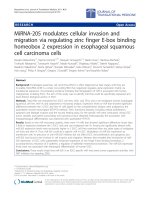
Analysis of the functional outcome of expression
profiles from all microarray studies showed that
NRF2-mediated oxidative stress pathway was significantly enriched only in our dataset (Fig. 4). Likewise,
the significant enrichment of ubiquitination, androgen,
and B- cell receptor signaling pathways was revealed
only in our dataset. Integrin, ephrin receptor and protein kinase A signaling pathways were shared by at
least two or more studies at or above the significance
threshold.
It was important to examine the dysregulation of genetic components of the detox networks in the ESCC
microarray expression datasets. All studies showed enrichment of toxicology pathways than other signaling
pathways (Fig. 5). Interestingly, our dataset contained
the highest number of genes in the NRF2-mediated oxidative stress response pathway while in other studies this
number was either at or below the significance threshold. Aryl hydrocarbon receptor, fatty acid metabolism,
xenobiotic metabolism signaling, G2/M DNA damage
checkpoint regulation and cell death genes were significantly perturbed in all studies. In our dataset
(GSE77861) and in GSE23400 [27], the number of genes
in retinoic acid receptor signaling was above the significance threshold.
Meta-analysis of the upstream regulatory pathways of
ESCC in various ethnic groups
Meta-analysis of all available ESCC gene expression profile datasets showed a distinctive upstream regulatory
pathway in African-Americans that highlighted a significant enrichment of the NRF2 mediated oxidative
stress response pathway (Table 1). The activated pathways such as CBX5, insulin, MEK, NFE2L2, ANXA7,
HSF2, NFE2L1, and PLIN5 were either uniquely represented in our study or shared with only one other study.
Six out of eight datasets predicted the activation of upstream pathways of E2F and RABL6 although the rankings of z-score of these pathways were diverse (Table 1
and Additional file 9). FOXM1 was also projected as one
of the common activated upstream pathways. Regardless
of the z-score rankings, the activation of angiopoietin 2
pathway is the third highly represented upstream pathway in five of the studies (Additional file 9). The activation of fibronectin, and beta-catenin pathways as
upstream regulators was revealed in five studies that
included ours.
The predicted inhibited upstream pathways were divergent among the studies. While the TP53 pathway was predicted to be the top inhibited pathway in our study, the
most common inhibited pathways including CDKN1A,
IRF4, KDM5B, ACKR2, BNIP3L, DYRK1A were found in
all datasets except in our study. In contrast, our dataset
exclusively demonstrated the inhibition of FGFR1,
ESRRA, EHF, and IL13 pathways.
Discussion
ESCC is the predominant esophageal carcinoma subtype
worldwide occurring in specific geographic areas and in
Erkizan et al. BMC Cancer (2017) 17:426
Page 7 of 13
Table 1 Comparison of the predicted upstream regulatory pathways in ESCC
GSE77861
Gene
GSE17351
GSE33810
z-score
-log(p)
Gene
GSE20347
z-score
-log(p)
Gene
z-score
-log(p)
Gene
z-score
-log(p)
NFE2L2
3.8
7.5
NUPR1
4.7
10.1
mir-8
2.6
1.2
RABL6
5.8
26.7
MEK
2.7
1.2
CLDN7
3.9
7.9
let-7
2.6
0.3
FOXM1
4.4
14.2
LDL
2.8
0.5
MYOCD
3.8
6.0
LYN
2.4
0.6
IgG complex
3.7
21.9
CTNNB1
2.6
1.6
NR3C1
3.7
4.2
IL10RA
2.3
1.0
MITF
3.5
15.8
RABL6
2.5
2.1
IRGM1
3.5
7.0
TRIM24
2.4
0.1
FOXO1
3.4
11.3
FOXM1
2.4
1.2
BNIP3L
3.4
8.2
miR-1-3p
2.2
0.8
RARA
3.3
16.2
CBX5
2.3
2.4
RBL2
3.2
4.8
IFI16
2.2
0.4
TLR7
3.3
4.2
ANGPT2
2.3
2.3
TP53
3.2
21.1
ZBTB16
2.2
2.0
PRL
3.3
8.1
PLIN5
2.2
2.2
IL1RN
3.1
4.3
miR-10
2.2
0.4
IFNL1
3.2
10.0
ANXA7
2.2
2.4
SRF
3.0
5.7
CDKN2A
2.1
0.1
TGFB1
3.2
46.3
TP53
−3.1
18.4
CSF2
−5.6
9.3
ERBB2
−3.2
8.2
TP53
−5.3
38.7
IL13
−3.0
0.7
RABL6
−4.1
8.9
SHH
−3.1
7.8
NUPR1
−4.4
19.5
CDKN2A
−3.0
2.6
SPP1
−4.1
5.3
IGFBP2
−3.1
7.5
SPDEF
−4.0
8.7
CD28
−2.8
2.0
EGFR
−3.8
14.0
TGFB3
−2.9
7.5
KDM5B
−3.4
12.6
EHF
−2.5
2.3
ERK1/2
−3.8
9.2
ERG
−2.9
7.0
HSF1
−3.3
6.7
CLDN7
−2.4
3.9
EGF
−3.7
9.9
CCTNB1
−2.7
7.1
CDKN1A
−3.3
9.5
let-7
−2.2
0.5
HGF
−3.6
17.1
CREB
−2.6
1.7
CLDN7
−3.1
6.7
ESRRA
−2.2
1.4
TNF
−3.4
3.9
WNT1
−2.5
0.6
BTK
−2.9
5.0
TCF3
−2.0
0
E2F1
−3.4
7.9
CCND1
−2.5
2.9
WISP2
−2.9
8.6
FGFR1
−2.0
0.8
FN1
−3.4
4.7
ERG2
−2.5
0.9
E2F6
−2.8
4.3
z-score
-log(p)
z-score
-log(p)
Gene
z-score
-log(p)
Gene
z-score
-log(p)
GSE29001
Gene
GSE33426
Gene
GSE45670
GSE23400
RABL6
5.8
25.2
TGFB1
7.7
42.9
TNF
5.3
24.0
CSF2
5.0
14.4
HGF
5.7
39.5
TNF
7.2
15.1
ERBB2
4.9
21.3
RABL6
4.7
19.7
VEGF
5.3
32.7
VEGF
7.0
15.0
CSF
4.2
4.8
VEGF
4.4
32.3
FOXM1
5.0
19.4
HGF
6.9
22.0
EGFR
3.9
13.6
HGF
4.2
38.8
CSF2
5.0
30.7
ESR1
6.9
42.0
IFNL1
3.8
5.8
FOXM1
4.0
16.0
E2F1
4.6
28.1
EGF
6.5
12.0
IFNG
3.7
21.3
ESR1
3.9
31.1
TBX2
4.4
13.0
CSF2
6.5
14.0
CCND1
3.7
18.5
ERBB2
3.7
56.4
E2F group
4.2
15.8
CTNNB1
6.3
13.0
IL1A
3.6
15.5
FN1
3.7
7.5
IFNA1
3.7
6.4
SMARCA4
6.2
11.0
RABL6
3.6
5.1
TBX2
3.6
12.2
IFNL1
3.6
13.0
IFNG
5.9
15.0
OSM
3.5
15.6
EGF
3.4
32.6
NUPR1
−6.2
15.6
let-7
−6.0
19.0
GATA4
−4.8
11.6
TP53
−5.2
53.0
let-7
−5.0
17.0
CD3
−5.1
15.0
IL10RA
−4.3
7.4
CDKN2A
−4.3
10.5
KDM5B
−4.5
10.7
SPDEF
−4.2
8.0
MYOCD
−3.9
11.2
let-7
−3.9
16.0
IRGM
−4.5
14.8
KDM5B
−4.1
7.5
IL1RN
−3.6
8.1
RB1
−3.8
17.7
TP53
−4.2
54.2
IRGM1
−4.0
9.0
IRGM1
−3.5
6.5
NR3C1
−3.5
7.9
SPDEF
−4.1
10.2
TRIM24
−4.9
4.0
HAND2
−3.3
5.7
SPDEF
−3.4
8.5
RBL2
−4.0
13.7
RB1
−3.9
14.0
SRF
−3.3
11.1
PPARG
−3.3
13.0
BNIP3L
−4.0
17.3
RBL2
−3.9
7.2
ACKR2
−3.2
5.3
let-7a-5p
−3.3
4.3
CDKN2A
−3.9
7.3
IL1RN
−3.8
2.2
PTEN
−3.2
5.0
IRGM1
−3.2
7.2
TRIM24
−3.8
18.2
CD28
−3.6
8.2
POU5F1
−3.0
2.4
CR1L
−3.1
8.9
The upstream regulatory pathways represented more than one study in the meta-analysis indicated in bold
Erkizan et al. BMC Cancer (2017) 17:426
Page 8 of 13
Fig. 4 Meta-analysis of the most enriched pathways in ESCC. Dark navy bars represent our dataset. Dark blue, blue, green, purple, pink, and red bars
represent the data sets of GSE23400, GSE20347, GSE45670, GSE33810, GSE29001, GSE17351, respectively.
various countries including China, Japan, Iran, Italy and
France [8, 31]. In the United States, a high incidence of
ESCC has been reported in the District of Columbia and
coastal areas of the southern states [32]. ESCC occurs at
a 5-fold greater frequency among African-Americans
than among white Americans while the converse has
been observed for EAC [7, 33]. Even though five-year
survival rates increased in both whites and black between 2004 and 2010, the mortality rate for esophageal
carcinoma is still far greater in blacks than among
whites [33–35]. Notably, in recent years, an increased
incidence of EAC has been observed, particularly among
whites [1, 34]. Altogether, these distinctive features indicate geographic and racial disparities in esophageal
cancer [31].
We conducted a transcriptome analysis to identify the
molecular repertoire involved in esophageal squamous
cell carcinoma in African-American males. To our
knowledge, this study is the first to investigate and
analyze the global gene expression pattern of stage IV
ESCC in African-Americans.
Heavy alcohol consumption, cigarette smoking, and
poor diet are environmental risk factors for ESCC. Our
findings in African-American ESCC reveal dysregulation
of genes involved in detox networks, including NRF2
pathway, which is a primary mediator of detoxification
and metabolism responses (Additional file 5) [36]. Nuclear
factor-erythroid 2 p45-related factor 2 (NFE2L2) gene encodes a transcription factor NRF2 that regulates the transcription of antioxidant/electrophile response element
Erkizan et al. BMC Cancer (2017) 17:426
Page 9 of 13
Fig. 5 Comparison of the toxicology pathway indicated the enrichment of NRF2 pathway in our dataset. Dark navy bars represent our dataset. Dark
blue, blue, green, purple, pink, and red bars represent the data sets of GSE23400, GSE20347, GSE45670, GSE33810, GSE29001, GSE17351, respectively.
(ARE)-containing target genes in response to oxidative
and/or toxic environmental changes. The NRF2 pathway
also regulates wound healing, resolution of inflammation,
autophagy, ER stress response and unfolded protein response [37], apoptosis, differentiation of keratinocytes [38]
and the embryonic development of the esophagus in response to growth factor-induced ROS production [39, 40].
The role of NRF2 pathway is cancer-type dependent.
NRF2 protects against chemical carcinogen-induced carcinogenesis in the stomach, bladder and skin [41]. However, NRF2 activation plays an oncogenic role in lung,
head and neck, ovarian and endometrial cancers [41].
Previous studies conducted in Asian samples demonstrated that higher expression of NRF2 is positively correlated with lymph node metastasis and drug resistance
in ESCC [42]. Mutations in NFE2L2 confer malignant
potential and resistance to therapy in advanced ESCC
[43]. However, only 10% of Asian ESCC carry mutations
in the NFE2L2 gene or its negative regulator KEAP1
[44]. Consistent with this data, our meta-analysis of gene
expression profiles only showed a modest involvement
of NRF2 in toxicology pathways in Asian ESCC datasets.
IPA demonstrated the enrichment of NRF2 pathway in
ESCC with high confidence in our dataset, suggesting a
unique molecular signature of African-American ESCC.
The significance of NRF2 pathway in African-American
ESCC merits further functional evaluation.
In our CGH data, we previously found a loss of 7q
in >50% of ESCC from African-American males [13].
Transcriptome mapping identified four genes located
Erkizan et al. BMC Cancer (2017) 17:426
in the 7q21.1–22.3 region among which is the cytochrome P450 gene cluster that includes CYP3A5,
CYP3A7, CYP3A4, and CYP3A43. It is noteworthy
that our analysis indicates a significant loss of expression of CYP3A5 in addition to the down-regulation of
three other genes that encode cytochrome P450 enzymes. It is well established that CYP3A enzymes
metabolize more than half of the drugs used clinically
[45]. Cytochrome P450 enzymes are also active in
metabolizing toxic compounds thus their loss potentially contributes to carcinogenesis.
The persistent metabolic imbalance and tumor promoters found in cigarette smoking activate growthpromoting, cancerous conditions. Thus, the continual
activation of NRF2 pathway could provide an adaptation
mechanism to environmental toxicant especially in cancers [37]. Aryl hydrocarbon signaling, fatty acid, and
xenobiotic metabolism also share some of the proteins
that function in the NRF2 pathway. Therefore, the effect
of the dysregulated NRF2 pathway may amplify the impairment of the dynamics of these pathways. In addition
to response to toxins, NRF2 might promote cell proliferation of cancer cell by reprogramming metabolism to
anabolic pathways [46]. However, further studies are required to investigate the causal association of NRF2
pathway in the esophageal tumor development in
African-Americans. Future genomic studies are important to evaluate the mutational spectra of NFE2L2 or
KEAP1 in African-American ESCC.
Recent studies that outlined the genomic and molecular characterization of esophageal carcinoma in the
Asian population suggested the dysregulation of the receptor tyrosine kinase (RTK)-MAPK-PI3K, NOTCH,
Hippo, cell cycle, and epigenetic pathways as the primary
molecular mechanism of ESCC [44, 47]. The amplification or over-expression of FGFR1, MET, EGFR, ERBB2,
ERBB4, and IL7R was observed in the majority of the patients and has been suggested as main drivers for the
ESCC tumorigenesis [47]. Our meta-analysis of ESCC
expression datasets indicated that the activation of
growth factors and or their receptors, RABL6, FOXM1,
CCND1, and CTNNB1 are upstream signaling drivers of
the cellular growth of ESCC.
The upstream regulatory role of RABL6 was predicted
in six out of eight ESCC datasets. RABL6 gene encodes a
member of the Ras superfamily of small GTPases. The
encoded protein RABL6, also known as RBEL or PARF,
binds to both GTP and GDP and may play a role in cell
growth and survival. Overexpression of this gene may
play a role in breast, and pancreatic cancer tumorigenesis [48–50]. Functional analysis of RABL6 in ESCC
warrants further study.
The most common inhibited upstream regulatory
pathways are TP53 and KDM5B across most of the
Page 10 of 13
ESCC datasets. Studies have shown that TP53 negatively
regulates NRF2-mediated gene expression [51]. The
down-regulation of TP53 could synergistically sustain
the activation of NRF2 seen in African-American ESCC.
We previously identified a single nucleotide mutation of
SCEL gene in both normal and squamous cell carcinoma
of esophagus in African-Americans [52]. In our present
study, SCEL is significantly under-expressed in AfricanAmerican ESCC, and thus could play a role in squamous
cell carcinogenesis as suggested by the down-regulation
of this gene in larynx and hypopharynx [53], and in
tongue squamous cell carcinoma [54].
The diversity among the inhibited upstream pathways
implies the variety of susceptibility loci remain to be discovered in ESCC tumorigenesis, particularly the contribution of the deregulation of immune components.
Given the differences in enriched pathways displayed by
ESCC in various ethnic groups, it is possible that different genetic backgrounds have dissimilar responses to
various environmental exposures. [55, 56].
Conceivably, our findings unmasked only a restricted
view of the processes that are compromised in ESCC
given the inherent limitations of microarray-based transcriptome profiling, the small sample size that was analyzed and incomplete modeling of biological reactions
due to lack of functional data. However, the present
study uncovered salient mechanistic aspects of the squamous esophageal cellular system in African-Americans,
which to our knowledge, have not been described
previously.
Conclusion
Our expression profiling study and pathway analysis suggest a widespread and prominent disruption of detox
networks as revealed by the involvement of the NRF2
pathway and loss of detoxifying enzymes as a potential
distinctive molecular mechanism in African-American
esophageal squamous cell carcinogenesis.
Additional files
Additional file 1: The list of the demographics and risk factors of the
patients. (XLSX 9 kb)
Additional file 2: Analysis pipeline. (EPS 830 kb)
Additional file 3: The characteristics of studies included in Metaanalysis. (XLSX 11 kb)
Additional file 4: The gene expression data file. (XLSX 118 kb)
Additional file 5: The description of 25 networks found enriched in our
data set by IPA. (XLSX 13 kb)
Additional file 6: Fifteen canonical pathways that were significantly
enriched in African-American ESCC. (EPS 1053 kb)
Additional file 7: The list of the gene constituents of fifteen canonical
pathways that were presented in Additional file 5. (XLSX 43 kb)
Additional file 8: The role of NRF2 pathway and transcriptional targets
of NRF2 which are differentially expressed in our dataset. (EPS 994 kb)
Erkizan et al. BMC Cancer (2017) 17:426
Additional file 9: The meta-analysis of ESCC gene expression studies.
(XLSX 438 kb)
Additional file 10: The schematic representation of 99 differentially
expressed genes that were downstream of the TP53 pathway. (EPS
27906 kb)
Additional file 11: The table of top ten of the most differentially expressed
genes in the studies contributed in the meta-analysis. (EPS 1532 kb)
Abbreviations
ABCC1: ATP binding cassette subfamily C member 1; ABCC5: ATP binding
cassette subfamily C member 5; ACAA1B: acetyl-Coenzyme A acyltransferase
1B; ACKR2: atypical chemokine receptor 2; ACLY: ATP citrate lyase;
ACOX1: acyl-CoA oxidase 1; ADH7: alcohol dehydrogenase 7 (class IV);
AKR1B1: aldo-keto reductase family 1 member B; ALD: ABCD1 ATP binding
cassette subfamily D member 1; ALDH3A1: aldehyde dehydrogenase 3 family
member A1; ALDH7A1: aldehyde dehydrogenase 7 family member A1;
ANXA7: Annexin 7; ARE: antioxidant/electrophile response element;
BLVRA: biliverdin reductase A; BNIP3L: BCL2 interacting protein 3 like;
CBX5: chromobox 5; CCND1: cyclin D1; CDKN1A: cyclin dependent kinase
inhibitor 1A; CEBPB: CCAAT/enhancer binding protein beta;
CGH: comparative genomic hybridization; CLCA4: chloride channel accessory
4; CRSP3: cysteine-rich secretory protein 3; CTNNB1: catenin beta 1;
CYP3A4: cytochrome P450 family 3 subfamily A member 4;
CYP3A43: cytochrome P450 family 3 subfamily A member 43;
CYP3A5: cytochrome P450 family 3 subfamily A member 5;
CYP3A7: cytochrome P450 family 3 subfamily A member 7; DYRK1A: dual
specificity tyrosine phosphorylation regulated kinase 1A;
EAC: Adenocarcinoma of esophagus; EC: esophageal cancer; EGFR: Epidermal
growth factor receptor; EHF: ETS homologous factor; ELOVL5 : ELOVL fatty
acid elongase 5; ER: Endoplasmic reticulum; ERBB2: erb-b2 receptor tyrosine
kinase 2; ERBB4: erb-b2 receptor tyrosine kinase 4; ESCC: esophageal
squamous cell carcinoma; ESRRA: estrogen related receptor alpha;
FABP5: fatty acid binding protein 5; FGFR1: fibroblast growth factor receptor
1; FOXM1: forkhead box M1; FTL1: ferritin light polypeptide 1; GCLC
: glutamate-cysteine ligase catalytic subunit; GEO: Gene Expression Omnibus;
GPX4: glutathione peroxidase 4; HSF2: heat shock transcription factor 2;
IGHG1: immunoglobulin; IL13: interleukin 13; IL7R: interleukin 7 receptor;
IPA: Ingenuity Pathway Analysis; IRF4: interferon regulatory factor 4;
IRGM1: immunity related GTPase M; KDM5B: lysine demethylase 5B;
KEAP1: kelch like ECH associated protein 1; KRT17: keratin 17; KRT78: Keratin
78; MAPK: MAP kinase; MEK : MAP kinse-ERK kinase; MET: MET protooncogene, receptor tyrosine kinase; MGST2: microsomal glutathione Stransferase 2; NCBI : The National Center for Biotechnology Information;
NFE2L1: nuclear factor erythroid-2–related factor 1; NFE2L2: Nuclear factorerythroid 2 p45-related factor 2; NRF2 : nuclear factor erythroid-2–related factor 2; ODC1: ornithine decarboxylase 1; PCA : Principal Component Analysis;
PI3K: phosphatidylinositol-4,5-bisphosphate 3-kinase; PLIN5: perilipin 5;
RAB5B: RAB5B, member RAS oncogene family; RABL6: RAB, member RAS
oncogene family-like 6; RABL6: RAB, member RAS oncogene family-like 6;
RAF: Raf-1 proto-oncogene, serine/threonine kinase; RTK: receptor tyrosine
kinase; RT-PCR: Real time polymerase chain reaction; SCC: Squamous cell
carcinoma; SCEL: sciellin; SELK: selenoprotein K; SLURP1: secreted LY6/PLAUR
domain; TMPRSS11B: transmembrane protease, serine 11B; TNFRSF6B: Tumor
necrosis factor receptor superfamily member 6b
Page 11 of 13
Role of the funding body: The Robert Leet and Clara Guthrie Patterson Trust
approved the study design, the plans for sample collection, and data analysis
before releasing the funds. The foundation also received a progress report
during the study term and a final report at the end of the study term. The
funding body did not contribute to the preparation and the revision of the
manuscript.
Availability of data and materials
The data was deposited to the NCBI GEO database. The link to data is below;
/>GSE77861.
Authors’ contributions
HVE: Analyzed microarray data, performed pathway analysis, performed
meta-analysis of expression profiling data, wrote and revised the manuscript.
KJ: Analyzed the microarray raw data, and contributed to the interpretation
of findings and intellectual content of the manuscript. SG: Performed RNA
extraction and microarray experiments. DK: Coordinated patient sample
collection, and contributed to the intellectual content of the manuscript.
GT: Provided patient samples, and assisted in the revision of the manuscript. HA:
Provided patient samples, and assisted in the revision of the manuscript. EPH:
Supervised microarray experiments and contributed to the intellectual content
of the manuscript. RGW: Designed the experiments, contributed for intellectual
content, and co-wrote and assisted in the revision of the manuscript. All authors
have read and approved the final version of this manuscript.
Competing interests
None of the authors have any competing interests in the manuscript.
This manuscript does not reflect the views of the U.S. Federal Government
or any of its agencies.
Consent for publication
The participants permitted to publish the results.
Ethics approval and consent to participate
This study was done under a protocol approved by the Washington DC
VAMC Institutional Review Board, and written informed consent was
obtained from patients prior to biopsy or surgery. The IRB ID for this
study is 00707.
Publisher’s Note
Springer Nature remains neutral with regard to jurisdictional claims in published
maps and institutional affiliations.
Author details
1
Institute for Clinical Research, Department of Veteran Affairs Medical Center
(VAMC), Washington, D.C., USA. 2Bioinformatics Neuroscience Group,
Information Technology Program, National Institute of Neurological Disorders
& Stroke, Bethesda, MD, USA. 3Research Center for Genetic Medicine,
Children’s National Medical Center, Washington, D.C., USA. 4Cardiothoracic
Surgery, VAMC, Washington, D.C., USA. 5Radiology Service, VAMC,
Washington, D.C., USA. 6Present address: School of Pharmacy, Binghamton
University – SUNY, Binghamton, NY, USA. 7Oncology Section, Washington DC
VAMC, 50 Irving St. NW, Washington DC 20422, USA.
Received: 3 August 2016 Accepted: 12 June 2017
Acknowledgments
We would like to thank Washington DC VA Medical Center and the Institute
for Clinical Research for their support.
Funding
Elsa U. Pardee Foundation.
Recipient: Robert Wadleigh MD, MS.
Role of the funding body: The Elsa U. Pardee Foundation approved the study
design, the plans for sample collection, and data analysis before releasing the
funds. The foundation also received a progress report during the study term
and a final report at the end of the study term. The funding body did
not contribute to the preparation and the revision of the manuscript.
The Robert Leet and Clara Guthrie Patterson Trust.
Recipient: Robert Wadleigh MD, MS.
References
1. Pennathur A, Gibson MK, Jobe BA, Luketich JD. Oesophageal carcinoma.
Lancet. 2013;381(9864):400–12.
2. Yoon H, Gibson MK. Molecular Outcome Prediction In: Jobe BA, Thomas CR,
Hunter JG (eds) Esophageal cancer: principles and practice. New York:
Demos Medical Publishing; 2009. pp. 771–82.
3. Chung CS, Lee YC, Wu MS. Prevention strategies for esophageal cancer:
perspectives of the east vs. west. Best Pract Res Clin Gastroenterol.
2015;29(6):869–83.
4. Ohashi S, Miyamoto S, Kikuchi O, Goto T, Amanuma Y, Muto M. Recent
advances from basic and clinical studies of esophageal Squamous cell
carcinoma. Gastroenterology. 2015;149(7):1700–15.
Erkizan et al. BMC Cancer (2017) 17:426
5.
6.
7.
8.
9.
10.
11.
12.
13.
14.
15.
16.
17.
18.
19.
20.
21.
22.
23.
24.
Zhang Y. Epidemiology of esophageal cancer. World J Gastroenterol.
2013;19(34):5598–606.
Chen J, Kwong DL, Cao T, Hu Q, Zhang L, Ming X, et al. Esophageal
squamous cell carcinoma (ESCC): advance in genomics and molecular
genetics. Dis Esophagus. 2015;28(1):84–9.
Brown LM, Hoover R, Silverman D, Baris D, Hayes R, Swanson GM, et al. Excess
incidence of squamous cell esophageal cancer among US black men: role of
social class and other risk factors. Am J Epidemiol. 2001;153(2):114–22.
Lin Y, Totsuka Y, He Y, Kikuchi S, Qiao Y, Ueda J, et al. Epidemiology of
esophageal cancer in Japan and China. J Epidemiol. 2013;23(4):233–42.
Morita M, Kumashiro R, Kubo N, Nakashima Y, Yoshida R, Yoshinaga K, et al.
Alcohol drinking, cigarette smoking, and the development of squamous cell
carcinoma of the esophagus: epidemiology, clinical findings, and
prevention. Int J Clin Oncol. 2010;15(2):126–34.
Shakeri R, Kamangar F, Nasrollahzadeh D, Nouraie M, Khademi H, Etemadi A,
et al. Is opium a real risk factor for esophageal cancer or just a methodological
artifact? Hospital and neighborhood controls in case-control studies. PLoS One.
2012;7(3):e32711.
Andrici J, Eslick GD. Hot food and beverage consumption and the risk of
esophageal cancer: a meta-analysis. Am J Prev Med. 2015;49(6):952–60.
Karkera JD, Balan KV, Yoshikawa T, Lipman TO, Korman L, Sharma A,
Patterson RH, Sani N, Detera-Wadleigh SD, Wadleigh RG: Systematic
screening of chromosome 18 for loss of heterozygosity in esophageal
squamous cell carcinoma. Cancer Genet Cytogenet 1999, 111(1):81-86.
Pack SD, Karkera JD, Zhuang Z, Pak ED, Balan KV, Hwu P, et al. Molecular
cytogenetic fingerprinting of esophageal squamous cell carcinoma by
comparative genomic hybridization reveals a consistent pattern of
chromosomal alterations. Genes Chromosomes Cancer. 1999;25(2):160–8.
Sakai N, Kajiyama Y, Iwanuma Y, Tomita N, Amano T, Isayama F, et al. Study
of abnormal chromosome regions in esophageal squamous cell carcinoma
by comparative genomic hybridization: relationship of lymph node
metastasis and distant metastasis to selected abnormal regions. Dis
Esophagus. 2010;23(5):415–21.
Shinomiya T, Mori T, Ariyama Y, Sakabe T, Fukuda Y, Murakami Y, et al.
Comparative genomic hybridization of squamous cell carcinoma of the
esophagus: the possible involvement of the DPI gene in the 13q34
amplicon. Genes Chromosomes Cancer. 1999;24(4):337–44.
Shiomi H, Sugihara H, Kamitani S, Tokugawa T, Tsubosa Y, Okada K, et al.
Cytogenetic heterogeneity and progression of esophageal squamous cell
carcinoma. Cancer Genet Cytogenet. 2003;147(1):50–61.
Sugimoto T, Arai M, Shimada H, Hata A, Seki N. Integrated analysis of
expression and genome alteration reveals putative amplified target genes
in esophageal cancer. Oncol Rep. 2007;18(2):465–72.
Tada K, Oka M, Tangoku A, Hayashi H, Oga A, Sasaki K. Gains of
8q23-qter and 20q and loss of 11q22-qter in esophageal squamous
cell carcinoma associated with lymph node metastasis. Cancer.
2000;88(2):268–73.
Du Plessis L, Dietzsch E, Van Gele M, Van Roy N, Van Helden P, Parker MI, et
al. Mapping of novel regions of DNA gain and loss by comparative
genomic hybridization in esophageal carcinoma in the black and colored
populations of South Africa. Cancer Res. 1999;59(8):1877–83.
Yen CC, Chen YJ, Chen JT, Hsia JY, Chen PM, Liu JH, et al. Comparative
genomic hybridization of esophageal squamous cell carcinoma: correlations
between chromosomal aberrations and disease progression/prognosis.
Cancer. 2001;92(11):2769–77.
Kwong D, Lam A, Guan X, Law S, Tai A, Wong J, et al. Chromosomal aberrations
in esophageal squamous cell carcinoma among Chinese: gain of 12p predicts
poor prognosis after surgery. Hum Pathol. 2004;35(3):309–16.
Qin YR, Wang LD, Fan ZM, Kwong D, Guan XY. Comparative genomic
hybridization analysis of genetic aberrations associated with development
of esophageal squamous cell carcinoma in Henan, China. World J
Gastroenterol. 2008;14(12):1828–35.
Carneiro A, Isinger A, Karlsson A, Johansson J, Jonsson G, Bendahl PO, et al.
Prognostic impact of array-based genomic profiles in esophageal squamous
cell cancer. BMC Cancer. 2008;8:98.
Eric P Hoffman TA, John Palma, Teresa Webster, Earl Hubbell, Janet A
Warrington, Avrum Spira, George Wright, Jonathan Buckley, Tim Triche,
Ron Davis, Robert Tibshirani, Wenzhong Xiao, Wendell Jones, Ron
Tompkins, and Mike West: Guidelines: Expression profiling — best
practices for data generation and interpretation in clinical trials. Nat Rev
Genet 2004, 5(3):229-237.
Page 12 of 13
25. Nakagawa H, Rustgi AK. Expression data from esophageal squamous cell
carcinoma. 2009. Obtained from />acc.cgi?acc=GSE17351.
26. Hu N, Clifford RJ, Yang HH, Wang C, Goldstein AM, Ding T, et al. Genome
wide analysis of DNA copy number neutral loss of heterozygosity (CNNLOH)
and its relation to gene expression in esophageal squamous cell carcinoma.
BMC Genomics. 2010;11:576.
27. Su H, Hu N, Yang HH, Wang C, Takikita M, Wang QH, et al. Global
gene expression profiling and validation in esophageal squamous cell
carcinoma and its association with clinical phenotypes. Clin Cancer
Res. 2011;17(9):2955–66.
28. Yan W, Shih JH, Rodriguez-Canales J, Tangrea MA, Ylaya K, Hipp J, et al.
Identification of unique expression signatures and therapeutic targets in
esophageal squamous cell carcinoma. BMC Res Notes. 2012;5:73.
29. Chen K, Li Y, Dai Y, Li J, Qin Y, Zhu Y, et al. Characterization of tumor
suppressive function of cornulin in esophageal squamous cell carcinoma.
PLoS One. 2013;8(7):e68838.
30. Wen J, Yang H, Liu MZ, Luo KJ, Liu H, Hu Y, et al. Gene expression analysis
of pretreatment biopsies predicts the pathological response of esophageal
squamous cell carcinomas to neo-chemoradiotherapy. Ann Oncol.
2014;25(9):1769–74.
31. Kamangar F, Dores GM, Anderson WF. Patterns of cancer incidence,
mortality, and prevalence across five continents: defining priorities to
reduce cancer disparities in different geographic regions of the world. J
Clin Oncol. 2006;24(14):2137–50.
32. Ashktorab H, Nouri Z, Nouraie M, Razjouyan H, Lee EE, Dowlati E, et al.
Esophageal carcinoma in African Americans: a five-decade experience. Dig
Dis Sci. 2011;56(12):3577–82.
33. Pickens A. Ethnic disparities in cancer of the esophagus. In: Esophageal
cancer principles and practice. 1st edn. Edited by Jobe BA TC, Jr, Hunter JG.
New York: Demos Medical Publishing; 2009. 137–141.
34. Brown LM, Devesa SS, Chow WH. Incidence of adenocarcinoma of the
esophagus among white Americans by sex, stage, and age. J Natl Cancer
Inst. 2008;100(16):1184–7.
35. American Cancer Society. Cancer Facts & Figures 2015. Atlanta: American
Cancer Society; 2015.
36. Gorrini C, Harris IS, Mak TW. Modulation of oxidative stress as an anticancer
strategy. Nat Rev Drug Discov. 2013;12(12):931–47.
37. Ma Q. Role of nrf2 in oxidative stress and toxicity. Annu Rev Pharmacol
Toxicol. 2013;53:401–26.
38. Sykiotis GP, Bohmann D. Stress-activated cap‘n’collar transcription factors in
aging and human disease. Sci Signal. 2010;3(112):re3.
39. Chen H, Li J, Li H, Hu Y, Tevebaugh W, Yamamoto M, et al. Transcript
profiling identifies dynamic gene expression patterns and an important role
for Nrf2/Keap1 pathway in the developing mouse esophagus. PLoS One.
2012;7(5):e36504.
40. Jiang M, Ku WY, Zhou Z, Dellon ES, Falk GW, Nakagawa H, et al. BMP-driven
NRF2 activation in esophageal basal cell differentiation and eosinophilic
esophagitis. J Clin Invest. 2015;125(4):1557–68.
41. Jaramillo MC, Zhang DD. The emerging role of the Nrf2-Keap1 signaling
pathway in cancer. Genes Dev. 2013;27(20):2179–91.
42. Mao JT, Tangsakar E, Shen H, Wang ZQ, Zhang MX, Chen JX, et al.
Expression and clinical significance of Nrf2 in esophageal squamous cell
carcinoma. Xi Bao Vu Fen Zi Mian Vi Xue Za Zhi. 2011;27(11):1231–3.
43. Shibata T, Kokubu A, Saito S, Narisawa-Saito M, Sasaki H, Aoyagi K, et
al. NRF2 mutation confers malignant potential and resistance to
chemoradiation therapy in advanced esophageal squamous cancer.
Neoplasia. 2011;13(9):864–73.
44. Gao YB, Chen ZL, Li JG, Hu XD, Shi XJ, Sun ZM, et al. Genetic
landscape of esophageal squamous cell carcinoma. Nat Genet. 2014;
46(10):1097–102.
45. Paulussen A, Lavrijsen K, Bohets H, Hendrickx J, Verhasselt P, Luyten W, et al.
Two linked mutations in transcriptional regulatory elements of the CYP3A5
gene constitute the major genetic determinant of polymorphic activity in
humans. Pharmacogenetics. 2000;10(5):415–24.
46. Mitsuishi Y, Taguchi K, Kawatani Y, Shibata T, Nukiwa T, Aburatani H, et al.
Nrf2 redirects glucose and glutamine into anabolic pathways in metabolic
reprogramming. Cancer Cell. 2012;22(1):66–79.
47. Lin DC, Hao JJ, Nagata Y, Xu L, Shang L, Meng X, et al. Genomic and
molecular characterization of esophageal squamous cell carcinoma. Nat
Genet. 2014;46(5):467–73.
Erkizan et al. BMC Cancer (2017) 17:426
Page 13 of 13
48. Li YY, Fu S, Wang XP, Wang HY, Zeng MS, Shao JY. Down-regulation of
c9orf86 in human breast cancer cells inhibits cell proliferation, invasion and
tumor growth and correlates with survival of breast cancer patients. PLoS
One. 2013;8(8):e71764.
49. Montalbano J, Jin W, Sheikh MS, Huang Y. RBEL1 is a novel gene that
encodes a nucleocytoplasmic Ras superfamily GTP-binding protein and is
overexpressed in breast cancer. J Biol Chem. 2007;282(52):37640–9.
50. Hagen J, Muniz VP, Falls KC, Reed SM, Taghiyev AF, Quelle FW, et al. RABL6A
promotes G1-S phase progression and pancreatic neuroendocrine
tumor cell proliferation in an Rb1-dependent manner. Cancer Res.
2014;74(22):6661–70.
51. Faraonio R, Vergara P, Di Marzo D, Pierantoni MG, Napolitano M, Russo T, et
al. p53 suppresses the Nrf2-dependent transcription of antioxidant response
genes. J Biol Chem. 2006;281(52):39776–84.
52. Corona W, Karkera DJ, Patterson RH, Saini N, Trachiotis GD, Korman LY, et al.
Analysis of Sciellin (SCEL) as a candidate gene in esophageal squamous cell
carcinoma. Anticancer Res. 2004;24(3a):1417–9.
53. Nair J, Jain P, Chandola U, Palve V, Vardhan NR, Reddy RB, et al. Gene and
miRNA expression changes in squamous cell carcinoma of larynx and
hypopharynx. Genes Cancer. 2015;6(7–8):328–40.
54. Ye H, Yu T, Temam S, Ziober BL, Wang J, Schwartz JL, et al. Transcriptomic
dissection of tongue squamous cell carcinoma. BMC Genomics. 2008;9:69.
55. Timme S, Ihde S, Fichter CD, Waehle V, Bogatyreva L, Atanasov K, et al.
STAT3 expression, activity and functional consequences of STAT3 inhibition
in esophageal squamous cell carcinomas and Barrett’s adenocarcinomas.
Oncogene. 2014;33(25):3256–66.
56. Zhang Y, Du XL, Wang CJ, Lin DC, Ruan X, Feng YB, et al. Reciprocal
activation between PLK1 and Stat3 contributes to survival and proliferation
of esophageal cancer cells. Gastroenterology. 2012;142(3):521–30. e523
Submit your next manuscript to BioMed Central
and we will help you at every step:
• We accept pre-submission inquiries
• Our selector tool helps you to find the most relevant journal
• We provide round the clock customer support
• Convenient online submission
• Thorough peer review
• Inclusion in PubMed and all major indexing services
• Maximum visibility for your research
Submit your manuscript at
www.biomedcentral.com/submit