Effect of genetic variants and traits related to glucose metabolism and their interaction with obesity on breast and colorectal cancer risk among postmenopausal women
Bạn đang xem bản rút gọn của tài liệu. Xem và tải ngay bản đầy đủ của tài liệu tại đây (472.94 KB, 14 trang )
Jung et al. BMC Cancer (2017) 17:290
DOI 10.1186/s12885-017-3284-7
RESEARCH ARTICLE
Open Access
Effect of genetic variants and traits
related to glucose metabolism and their
interaction with obesity on breast and
colorectal cancer risk among
postmenopausal women
Su Yon Jung1*, Eric M. Sobel2, Jeanette C. Papp2 and Zuo-Feng Zhang3
Abstract
Background: Impaired glucose metabolism–related genetic variants and traits likely interact with obesity and related
lifestyle factors, influencing postmenopausal breast and colorectal cancer (CRC), but their interconnected pathways are
not fully understood. By stratifying via obesity and lifestyles, we partitioned the total effect of glucose metabolism
genetic variants on cancer risk into two putative mechanisms: 1) indirect (risk-associated glucose metabolism genetic
variants mediated by glucose metabolism traits) and 2) direct (risk-associated glucose metabolism genetic variants
through pathways other than glucose metabolism traits) effects.
Method: Using 16 single-nucleotide polymorphisms (SNPs) associated with glucose metabolism and data from 5379
postmenopausal women in the Women’s Health Initiative Harmonized and Imputed Genome-Wide Association Studies,
we retrospectively assessed the indirect and direct effects of glucose metabolism-traits (fasting glucose, insulin, and
homeostatic model assessment–insulin resistance [HOMA-IR]) using two quantitative tests.
Results: Several SNPs were associated with breast cancer and CRC risk, and these SNP–cancer associations
differed between non-obese and obese women. In both strata, the direct effect of cancer risk associated with
the SNP accounted for the majority of the total effect for most SNPs, with roughly 10% of cancer risk due to
the SNP that was from an indirect effect mediated by glucose metabolism traits. No apparent differences in
the indirect (glucose metabolism-mediated) effects were seen between non-obese and obese women. It is
notable that among obese women, 50% of cancer risk was mediated via glucose metabolism trait, owing to
two SNPs: in breast cancer, in relation to GCKR through glucose, and in CRC, in relation to DGKB/TMEM195
through HOMA-IR.
Conclusions: Our findings suggest that glucose metabolism genetic variants interact with obesity, resulting in
altered cancer risk through pathways other than those mediated by glucose metabolism traits.
Keywords: Glucose metabolism–related genetic variant, Obesity, Physical activity, High-fat diet, Breast cancer,
Colorectal cancer, Postmenopausal women
* Correspondence:
1
Translational Sciences Section, Jonsson Comprehensive Cancer Center,
School of Nursing, University of California Los Angeles, 700 Tiverton Ave,
3-264 Factor Building, Los Angeles, CA 90095, USA
Full list of author information is available at the end of the article
© The Author(s). 2017 Open Access This article is distributed under the terms of the Creative Commons Attribution 4.0
International License ( which permits unrestricted use, distribution, and
reproduction in any medium, provided you give appropriate credit to the original author(s) and the source, provide a link to
the Creative Commons license, and indicate if changes were made. The Creative Commons Public Domain Dedication waiver
( applies to the data made available in this article, unless otherwise stated.
Jung et al. BMC Cancer (2017) 17:290
Page 2 of 14
Background
Breast cancer is the most commonly occurring cancer and
the second most common cause of cancer-related deaths
in the United States [1]. Colorectal cancer (CRC) is the
second most commonly diagnosed cancer and one of the
leading causes of cancer-related mortality throughout the
world [2]. Impaired glucose metabolism, i.e. insulin
resistance (IR), is characterized by hyperinsulinemia and
hyperglycemia, and demonstrates strong associations with
breast cancer and CRC [3–8]. The association is particularly strong in postmenopausal women, in whom high insulin levels have been associated with a twofold increase
in breast cancer risk [9, 10]. The homeostatic model assessment–insulin resistance (HOMA-IR) reflecting high
blood levels of insulin and glucose is positively associated
with breast cancer in the postmenopausal women [11].
Besides its importance in glucose homeostasis, insulin is
an essential hormone in anabolic processes in early cell
growth and development, directly through the insulin
receptor and indirectly through the insulin-like growth
factor receptor [12, 13]. Insulin receptors that are mainly
found in adipose tissues, muscle, and liver cells are overexpressed in breast cancer and CRC cells. This overexpression results in the enhanced anabolic state necessary
for cell proliferation, differentiation, and anti-apoptosis,
via abnormal stimulation of multiple signaling pathways,
including the phosphatidylinositol 3-kinase (PI3K)/serine/
threonine-specific protein kinase (Akt) and mitogenactivated protein kinase (MAPK) pathways [14, 15]. In
addition, high glucose levels owing to glucose intolerance
induce high levels of intracellular glucose, facilitating
breast cancer and CRC cell growth [6, 8]. Thus, impaired
glucose metabolism, such as IR, leading to hyperglycemia
and hyperinsulinemia, contributes to overexpression of
these receptors and multiple abnormal cellular signaling
cascades, and therefore may be associated with carcinogenesis. Considering the relationships of these glycemic
phenotypes and cancer risk, the glucose metabolismrelated genetic variants that are related to impaired glucose metabolic syndromes (e.g. high glucose, insulin, and
HOMA-IR levels) are plausibly associated with increased
risk of breast cancer and CRC. A limited number of
population-based epidemiologic studies have been
performed to examine these relationships [16–22].
Breast cancer, particularly in postmenopausal women,
and CRC risk are elevated among those who are obese
[4, 23–26]. Obesity status and obesity-related lifestyle factors are accompanied by elevated glucose metabolism traits
(e.g., insulin, glucose, and HOMA-IR levels) [4, 23, 24]. Specifically, physical inactivity and high-fat diet, as modifiable
factors for obesity, [3] increase insulin levels and IR, and are
associated with increased risk of breast cancer [8, 27, 28]
and CRC [29–32]. Further, previous in vitro studies have revealed obesity– glucose metabolism-related gene signature–
breast cancer or CRC risk pathways, suggesting that glucose
metabolism-related genetic variants interact with obesity
and jointly influence cancer susceptibility [15, 27, 33–36].
In this study among postmenopausal women, we examined the pathway of glucose metabolism genetic variants, glucose metabolism traits (fasting insulin, glucose,
and HOMA-IR levels), and cancer risk. We focused on
the mediation effects relating glucose metabolism genetic variants (exposure) and breast cancer and CRC risk
(outcome), and on the role of glucose metabolism traits
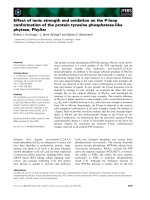
(mediator) that play in this association (Fig. 1). We first
evaluated the magnitude of the total effect of glucose
metabolism genetic variants on breast cancer and CRC
(i.e. the overall genetic effect, without considering the
effect of glucose metabolism traits). We then evaluated
how this total effect is partitioned into direct (cancer
A
C
X (SNPs in glucose metabolism genes)
Total effect
Y (Cancer risk)
B
M (Mediator: glucose metabolism traits)
[Fasting levels of glucose, insulin and HOMA-IR]
a
b
Indirect effect (=a*b[ C-C'])
C'
X (Independent variable: SNPs)
Y (Outcome variable: Cancer risk)
Direct effect
Fig. 1 Diagrams of total, direct, and indirect pathways of SNPs in glucose metabolism genes, glucose metabolism traits, and cancer risk.
(HOMA-IR, homeostatic model assessment–insulin resistance; HR, hazard ratio; SNP, single-nucleotide polymorphism.). a C is a total effect
(overall genetic effect, without considering the effect of glucose metabolism traits), expressed via HR. b C′ is a direct effect (cancer risk associated with glucose metabolism-relevant genetic variants through pathways other than glucose metabolism traits), expressed via HR
after accounting for mediator; a*b (≈C-C′) is an indirect effect (cancer risk associated with glucose metabolism-relevant genetic variants
through pathways mediated by glucose metabolism traits)
Jung et al. BMC Cancer (2017) 17:290
risk associated with glucose metabolism genetic variants
through pathways other than glucose metabolism traits)
and indirect effects (cancer risk associated with glucose
metabolism genetic variants through pathways mediated
by glucose metabolism traits). This approach allowed us
to test the hypothesis that glucose metabolism-related
genetic variants are associated with increased risk of
cancers and that the relationships depend on impaired
glucose metabolism symptoms (high insulin, glucose,
and HOMA-IR levels).
Given that the association between glucose-metabolism
genetic factors and glucose-metabolism traits could be influenced by obesity [4, 8, 23, 24, 27–32], and through this
glycemic mechanism, obesity status and related factors are
associated with breast cancer and CRC [15, 27, 33–36], we
evaluated how the pathway of glucose metabolism genetic
factors, glucose metabolism traits, and cancer is influenced by obesity and obesity-related factors. We examined
whether glucose metabolism genetic variants’ interactions
with obesity and relevant lifestyle factors influence glucose
metabolism traits and whether these changes in traits alter
the association between glucose metabolism traits and
cancer risk. Further, we assessed whether these altered relationships (glucose metabolism gene–glucose metabolism
traits relationship and glucose metabolism traits–cancer
risk relationship) influence the association between
glucose metabolism genetic variants and cancer risk.
Disentangling these complicated gene–phenotype–lifestyle interactions will provide insights into the role of
glucose intolerance in the development of obesityrelated breast cancer and CRC and suggest strategies to
reduce cancer risk in postmenopausal women.
Methods
Study population
This study included data from 5379 participants enrolled
in the Women’s Health Initiative (WHI) Harmonized and
Imputed Genome-Wide Association Studies (GWAS),
which is the effort of a joint imputation and
harmonization effort for GWAS within the WHI Clinical
Trials and Observational Studies. Details of this study’s rationale and design have been described elsewhere [37, 38].
Briefly, WHI study participants were recruited from 40
clinical centers nationwide between October 1, 1993, and
December 31, 1998. Eligible women were 50–79 years old,
postmenopausal, expected to live near the clinical centers
for at least 3 years after enrollment, and able to provide
written consent. For our study, we included only
European-American women. From among the 7835
women who did not have diabetes mellitus (DM) at enrollment or later, and had at least 8 hours’ fasting glucose
and/or insulin concentrations available at baseline, we excluded women who had been followed up for less than 1
year or those diagnosed with any cancer at enrollment,
Page 3 of 14
resulting in 6748 participants. We excluded another 1369
women whose information on covariates was unavailable,
leaving a final total of 5379 women (80% of the eligible
6748). This study was approved by the institutional review
boards at the University of California, Los Angeles.
Data collection and outcome variables
Standardized written protocols had been used and periodic
quality assurance performed by the WHI coordinating
center to ensure uniform data collection. At baseline,
participants had completed self-questionnaires on demographic and lifestyle factors and their medical and reproductive histories. Anthropometric measurements, including
height, weight, and waist and hip circumferences had been
obtained at baseline by trained staff. Of 33 variables initially
chosen from a literature review for their associations with
glucose metabolism and breast cancer and CRC, we
selected 29 final variables (Table 1) for this study after performing univariate and stepwise regression analyses and
multicollinearity testing.
Cancer outcomes were determined via a centralized
review of medical charts, and cancer cases were coded
according to the National Cancer Institute’s Surveillance,
Epidemiology, and End-Results guidelines [39]. The
outcome variables were the specific cancer type (breast
cancer and CRC) and the time to develop such cancer.
The time from enrollment to cancer development,
censoring, or study end-point was recorded as the
number of days and then converted into years.
Genotyping and laboratory methods
The WHI imputed GWAS comprises six substudies
(Hip Fracture GWAS, SHARe, GARNET, WHIMS,
GECCO, and MOPMAP) within the WHI study. Participants provided DNA samples at baseline and genotyping
included alignment (“flipping”) to the same reference
panel and imputation via the 1000 Genomes reference
panels. Single-nucleotide polymorphisms (SNPs) for
harmonization were checked for pairwise concordance
among all samples in the substudies. Initial quality assurance was conducted according to a standardized protocol,
with a missing call rate of <2% and Hardy-Weinberg Equilibrium of p ≥ 10−4. Sixteen SNP candidates, available for
this study with 97% R-squared imputation quality scores,
were selected on the basis of their association (p < 5 × 10⁻⁸)
with fasting glucose and/or insulin concentrations in a previous meta-analysis with independent replication [40–42].
Fasting blood samples had been collected from each
participant at baseline by trained phlebotomists and immediately centrifuged and stored at −70 °C. Serum glucose
was measured using the hexokinase method on a Hitachi
747 analyzer (Boehringer Mannheim Diagnostics), with
coefficient of variation of 1.6% and correlation coefficient
of values of 0.99. Serum insulin testing had been
Jung et al. BMC Cancer (2017) 17:290
Page 4 of 14
Table 1 Characteristics of participants, stratified by obesity (measured via BMI)
Characteristic
Non-obese group (BMI < 30.0)
Obese group (BMI ≥ 30.0)
(n = 3675)
(n = 1704)
n
(%)
n
(%)
68
(50–79)
67
(50–71)*
≤ High school
1272
(34.6)
701
(41.1)*
> High school
2403
(65.4)
1003
(58.9)
No
2714
(73.9)
1122
(65.8)*
Yes
961
(26.1)
582
(34.2)
No
1327
(36.1)
567
(33.3)
Yes
2348
(63.9)
1137
(66.7)
No
3070
(83.5)
1428
(83.8)
Yes
605
(16.5)
276
(16.2)
No
3106
(84.5)
1430
(83.9)
Yes
569
(15.5)
274
(16.1)
No
3161
(86.0)
1430
(83.9)
Yes
514
(14.0)
274
(16.1)
No
2702
(73.5)
1026
(60.2)*
Yes
973
(26.5)
678
(39.8)
No
3178
(86.5)
1460
(85.7)
Yes
497
(13.5)
244
(14.3)
Never
1882
(51.2)
897
(52.6)*
Past
1498
(40.8)
705
(41.4)
Current
295
(8.0)
102
(6.0)
Have never had sex
56
(1.5)
38
(2.2)
Have had sex
3619
(98.5)
1666
(97.8)
< 0.06
3392
(92.3)
1556
(91.3)
≥ 0.06
283
(7.7)
148
(8.7)
< 10
1875
(51.0)
1160
(68.1)*
≥ 10
Age in years, median (range)
Education
Family history of diabetes mellitus
Family history of cancer
Family history of breast cancer
Family history of colorectal cancer
Cardiovascular disease ever
Hypertension ever
High cholesterol requiring pills ever
Smoking status
Lifetime partner
Depressive symptoma
-1 b
METs·hour·week
1800
(49.0)
544
(31.9)
Total HEI-2005 score, median (range)c
68.7
(25.8–90.8)
65.7
(27.9–91.2)*
Dietary total sugars in g, median (range)
91.6
(4.6–350.2)
94.9
(10.8–474.5)*
Dietary alcohol per day in g, median (range)
1.506
(0.0–106.7)
0.561
(0.0–148.6)*
d
% calories from fat
Jung et al. BMC Cancer (2017) 17:290
Page 5 of 14
Table 1 Characteristics of participants, stratified by obesity (measured via BMI) (Continued)
< 40%
3057
(83.2)
≥ 40%
1268
(74.4)*
618
(16.8)
436
(25.6)
Waist circumference in cm, median (range)
81.0
(37.5–177.0)
100.0
(69.0–191.8)*
Waist-to-hip ratio, median (range)
0.798
(0.341–1.893)
0.849
(0.633–1.696)*
Never
2448
(66.6)
1123
(65.9)
Ever
1227
(33.4)
581
(34.1)
2457
(66.9)
1006
(59.0)*
Oral contraceptive use
History of hysterectomy or oophorectomy
No
1218
(33.1)
698
(41.0)
Age at menarche in years, median (range)
Yes
13
(≤ 9–≥ 17)
12
(≤ 9–≥ 17)*
Age at menopause in years, median (range)
50
(20–60)
50
(21–60)
No
276
(7.5)
134
(7.9)
Yes
3399
(92.5)
1570
(92.1)
No
1649
(44.9)
812
(47.7)
Yes
2026
(55.1)
892
(52.3)
No
2224
(60.5)
1122
(65.8)*
Yes
1451
(39.5)
582
(34.2)
Glucose in mg/dl, median (range)
92.0
(39.0–369.0)
97.0
(62.0–347.0)*
Insulin in μIU/ml, median (range)
5.5
(0.5–119.4)
9.8
(0.3–57.0)*
HOMA-IR, median (range)
1.3
(0.1–25.1)
2.4
(0.1–42.3)*
Pregnancy history
Breastfeeding at least one month
Exogenous estrogen use
BMI body mass index, HEI-2005 Healthy Eating Index-2005, HOMA-IR homeostatic model assessment–insulin resistance, MET metabolic equivalent
*p < 0.05, chi-squared or Wilcoxon’s rank-sum test
a
Depression scales were estimated by using a short form of the Center for Epidemiologic Studies Depression Scale and categorized with 0.06 as the cutoff to
detect depressive disorders
b
Physical activity was estimated from recreational physical activity combining walking and mild, moderate, and strenuous physical activity
c
HEI-2005 is a measure of diet quality that assesses adherence to the U.S. Department of Agriculture’s Dietary Guidelines for Americans. The total HEI score ranges
from 0 to 100, with higher scores indicating higher diet quality
d
Participants were stratified by high-fat diet using 40% as a cutoff value relevant to glucose intolerance [47]
conducted by Sandwich Immunoassay on a Roche Elecsys
2010 analyzer (Roche Diagnostics). The coefficient of variation and correlation coefficient of values for insulin were
4.9% and 0.99, respectively. HOMA-IR was estimated as
glucose (unit: mg/dl) × insulin (unit: μIU/ml) / 405 [43].
Statistical analysis
Participants’ differences in baseline characteristics,
stratified by obesity status (body mass index [BMI], waist
circumference, and waist-to-hip ratio [w/h]), level of physical activity, and dietary fat intake, were assessed by using
unpaired two-sample t tests for continuous variables, and
chi-squared tests for categorical variables. If continuous
variables were skewed or had outliers, Wilcoxon’s ranksum test was implemented. With the regression
assumptions met, multiple linear regression was performed to produce effect sizes and 95% confidence intervals (CIs) of the exposure (glucose metabolism-related
SNPs with an additive and dominant model) to predict
the outcomes (fasting glucose, insulin, and HOMA-IR
levels) (Additional file 1: Tables S1.1–6).
The Cox proportional hazards regression model was
used to obtain hazard ratios (HRs) and 95% CIs for
glucose, insulin, and HOMA-IR levels and glucose
metabolism-related SNPs in predicting breast cancer and
CRC. The proportional hazards assumption was tested
via a Schoenfeld residual plot and rho. The model was
adjusted for covariates (e.g., age, education, family
history of DM and cancer, comorbidity, lifestyle factors
including smoking, physical activity, depression, lifetime
partner, and diet, obesity, and reproductive history).
A direct and total effect size of glucose metabolismrelated SNP (exposure) on breast cancer and CRC (outcome) was produced from the HR for glucose
metabolism-related SNP on cancer in the Cox model
that included all covariates, with (direct) and without
Jung et al. BMC Cancer (2017) 17:290
(total) glucose, insulin, and HOMA-IR levels (mediator).
The mediation effect size and testing for its significance
(i.e. the pathway of glucose metabolism-SNPs and cancer
risk through insulin, glucose, and HOMA-IR levels) were
produced via the use of two complementary statistical
methods [44–46]: 1) bootstrapping the sampling distribution for standard errors using Mplus software and 2)
the percentage change in the HRs by comparing a model
that includes all covariates with a model that includes all
covariates and the mediator [44, 45]. These two
approaches, differently from traditional Baron-Kenny
steps, enabled us not only to prevent results from being affected by Type II errors but also to estimate the amount
and test the significance of the mediation effect [44]. To
evaluate the role of obesity and correlated lifestyle factors
as an effect modifier on the pathway of glucose metabolism
genetic factors, glucose metabolism traits, and cancer, we
stratified participants by those potential effect modifiers,
and within the strata, compared the proportions of the cancer risk contributed by glucose metabolism genetic variants
through the glucose metabolism traits (indirect effect) and
non-glucose metabolism pathways (direct effect). A twotailed p-value <0.05 was considered statistically significant.
The R statistical package (v 2.15.1) was used.
Results
Participants’ baseline characteristics between non-obese
(BMI <30.0) and obese (BMI ≥30.0) women are presented
in Table 1. Obese women were younger, less educated,
and more likely to have a history of hypertension and a
family history of DM than non-obese women. Also obese
women were less likely to be current smokers, and to
meet the physical activity and dietary guidelines, and they
were more likely to have higher percentages of calories
from dietary fat intake. Further, more obese women
tended to have a history of hysterectomy or oophorectomy and earlier menarche, and they were less likely to
use exogenous estrogen. They also had higher serum
levels of fasting glucose, insulin, and HOMA-IR. We
stratified participants by waist circumference, w/h, level of
physical activity, and dietary fat intake, using a cutoff value
relevant to glucose intolerance, [47] and compared their
characteristics (Additional file 2: Tables S2.1–4). The participants had been followed up through August 29, 2014
(a median follow-up period of 16 years), resulting in 326
participants (5% of non-obese and 8% of obese women)
diagnosed with breast cancer, and 364 participants (6% of
non-obese and 8% of obese women) diagnosed with CRC.
Sixteen SNPs were selected from previous GWAS as being associated with glucose metabolism traits. The allele
frequencies of these SNPs in our population were consistent with frequencies of those in a European population
[48]. No significant differences in allele frequency between
Page 6 of 14
strata (obesity, physical activity, and high-fat diet) were
observed (Additional file 3: Tables S3.1–5).
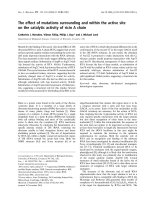
Breast cancer risk associated with glucose metabolism-related
SNPs mediated through glucose metabolism traits, stratified
by obesity status (BMI, waist, and w/h), level of physical
activity, and dietary fat intake
We partitioned the total effect of glucose metabolismrelated SNPs on breast cancer risk into indirect (via glucose
metabolism traits) and direct (not via glucose metabolism
traits) effects. Each of these analyses was mediated by fasting glucose (Table 2), HOMA-IR (Table 3), and insulin
levels (Additional file 4: Table S4.1). For each mediator, the
glucose metabolism-SNP–cancer association was evaluated,
stratified by obesity status (BMI < 30 vs. ≥ 30; waist ≤88 cm
vs. > 88 cm; and w/h ≤ 0.85 vs. > 0.85), level of physical
activity (metabolic equivalent [MET] ≥ 10 vs. < 10), and
dietary fat intake (< 40% vs. ≥ 40% calories from fat).
Of the 16 candidate SNPs, three had significant associations with breast cancer risk. The SNP–cancer risk effect was stronger in each SNP for a direct effect than an
indirect effect regardless of the mediator. Carriers of the
G6PC2 rs560887 T minor-allele were associated with increased breast cancer risk in obese women, stratified by
BMI, waist, w/h, and dietary fat intake (Tables 2 and 3,
and Additional file 4: Table S4.1). Roughly 15% of the
breast cancer risk owing to this genetic variant was mediated via glucose metabolism traits in the obese group;
no significant differences in mediation effect were found
between the obese and non-obese women.
Carriers of the IGF1 rs35767 A minor-allele had associations similar to those found in the carriers of G6PC2
(Tables 2 and 3, and Additional file 4: Table S4.1). Compared with the carriers in the non-obese group (w/
h ≤ 0.85), in whom no significant association with cancer
was found, the carriers in the obese group (w/h > 0.85)
had an association with increased breast cancer risk; further, in this obese group, about 10% of the breast cancer
risk associated with this genetic variant was dependent on
glucose metabolism traits. In addition, no differences were
apparent in mediation effect between women with w/
h ≤ 0.85 and those with w/h > 0.85. Carriers of the GCKR
rs780094 C major-allele had an association with increased
risk of breast cancer in women with w/h > 0.85 (Table 2);
approximately 50% of cancer risk attributable to this variant was mediated via glucose levels in this obese group.
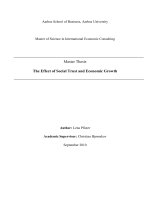
CRC risk associated with glucose metabolism-related SNPs
mediated through glucose metabolism traits, stratified by
obesity status (BMI, waist, and w/h), level of physical
activity, and dietary fat intake
We also split the total effect of the CRC risk–glucose
metabolism SNP relationship into direct and indirect
effects through fasting glucose (Table 4), HOMA-IR
rs560887
G6PC2
1.14
(0.95–1.37)
(0.68–1.21)
(0.82–1.23)
(0.89–1.39)
(0.85–1.39)
(0.89–1.39)
−0.01
(−0.003–0.02)
(−0.01–0.004)
(−0.03–0.01)
0.002
(−0.03–0.01)
−0.01
(−0.02–0.01)
(−0.04–0.02)
0.01
0.004
0.01
1.14
0.93
1.02
1.10
1.10
1.12
HRa
(0.95–1.37)
(0.70–1.23)
(0.84–1.24)
(0.89–1.36)
(0.86–1.40)
(0.90–1.39)
95% CI
1.56
1.43
1.33
1.47
1.35
1.34
HRa
(1.07–2.28)
(1.03–1.98)
(1.00–1.76)
(1.13–1.92)
(1.07–1.70)
(1.04–1.73)
95% CI
0.02
<0.001
0.002
−0.003
−0.01
−0.004
Effect sizea
(−0.07–0.03)
(−0.004–0.004)
(−0.003–0.01)
(−0.003–0.01)
(−0.01–0.02)
(−0.01–0.02)
95% CI
1.59
1.48
1.22
1.42
1.33
1.35
HRa
(1.10–2.31)
(1.08–2.03)
(0.93–1.60)
(1.10–1.85)
(1.06–1.66)
(1.05–1.74)
95% CI
Breast cancer risk
in relation to SNP
Total effect
BMI body mass index, CI confidence interval, HR hazard ratio, SNP single–nucleotide polymorphism, w/h ratio waist-to-hip ratio
Note: Proportions explained by glucose for SNP–breast cancer risk association for rs560887 (8.3%,10.0%, 30.0%, and 0% among non-obese group [BMI < 30, waist ≤88 cm, w/h ≤ 0.85, and <40% calories from fat, respectively]; 2.9%, 6.1%, 11.9%, and 5.1% among obese-group [BMI ≥ 30, waist >88 cm, w/h > 0.85, and ≥40% calories from fat, respectively]), for rs780094 (61.7% in w/h ≤ 0.85; 48.9% in w/h > 0.85), and for rs35767
(1.9% in w/h ≤ 0.85; 9.7% in w/h > 0.85). Only SNPs having statistically significant results are included. Numbers in bold face are statistically significant
a
Multivariate regression was adjusted by covariates (age, education, family history of diabetes mellitus, family history of breast cancer, cardiovascular disease ever, hypertension ever, high cholesterol requiring pills
ever, total Healthy Eating Index-2005 score, dietary alcohol and total sugars per day, smoking status, lifetime partner, depressive symptom, oral contraceptive use, history of hysterectomy or oophorectomy, age at menarche, age at menopause, pregnancy history, breastfeeding at least 1 month, and hormone therapy); effect-modifier variables (physical activity, BMI, and w/h ratio), when not evaluated as effect modifier variables,
were adjusted as a covariate; when stratified via waist circumference, w/h ratio was not adjusted
b
Participants stratified by BMI as non-obese (BMI < 30, n = 3675) or obese (BMI ≥ 30, n = 1704); interaction test presented for the effect of BMI on the association between breast cancer and rs560887 (effect size
−0.38, p-value 0.28)
c
Participants stratified by waist circumference as non-obese (waist ≤88 cm; n = 3042) or obese (waist >88 cm; n = 2337); interaction test presented for the effect of waist circumference on the association between
breast cancer and rs560887 (effect size −0.55, p-value 0.13)
d
Participants stratified by w/h as non-obese (w/h ≤ 0.85; n = 3712) or obese (w/h > 0.85; n = 1667); interaction tests presented for the effect of w/h on the association between breast cancer and rs560887 (effect size
−0.57, p-value 0.11), rs780094 (effect size 0.58, p-value 0.08), and rs35767 (effect size 0.54, p-value 0.01)
e
Participants stratified by dietary fat intake as non-obese (< 40% calories from fat; n = 4325) or obese (≥ 40% calories from fat; n = 1054); interaction test presented for the effect of dietary fat intake on the association
between breast cancer and rs560887 (effect size −0.45, p-value 0.26)
T/C
0.91
A/G
IGF1
rs35767
Dietary fat intakee
1.01
C/T
GCKR
1.07
1.09
1.11
95% CI
Effect sizea
95% CI
HRa
Breast cancer risk in
relation to SNP through
glucose
Indirect effect
Direct effect
Breast cancer risk in relation
to SNP through pathways
other than glucose
Breast cancer risk in relation
to SNP through glucose
Breast cancer risk in
relation to SNP through
pathways other than glucose
Breast cancer risk
in relation to SNP
Unfavorable Energy Balance Group
Direct effect
Total effect
Indirect effect
Favorable Energy Balance Group
G6PC2
T/C
T/C
T/C
Effect
allele/
Other
allele
rs780094
G6PC2
G6PC2
Nearest
gene
rs560887
w/h Ratiod
rs560887
Waistc
rs560887
BMI
b
SNP
Table 2 Mediation effect of glucose on the relationship between glucose metabolism–relevant SNPs and breast cancer risk, stratified by obesity status and obesity-related
factors
Jung et al. BMC Cancer (2017) 17:290
Page 7 of 14
A/G
1.16
0.92
1.11
1.11
1.17
(0.96–1.41)
(0.69–1.24)
(0.72–1.12)
(0.86–1.42)
(0.93–1.46)
95% CI
0.01
0.001
0.001
−0.003
<0.001
HRa
(−0.01–0.003)
(−0.01–0.003)
(−0.01–0.004)
(−0.01–0.01)
1.14
0.93
1.10
1.10
(−0.003–0.003) 1.12
Effect sizea 95% CI
(0.95–1.37)
(0.70–1.23)
(0.89–1.36)
(0.86–1.40)
(0.90–1.39)
95% CI
1.59
1.42
1.50
1.39
1.35
HRa
(1.08–2.34)
(1.02–1.98)
(1.14–1.97)
(1.10–1.77)
(1.04–1.76)
95% CI
Total effect
(−0.02–0.02)
(−0.01–0.01)
0.003
(−0.01–0.01)
−0.002
(−0.01–0.01)
(−0.02–0.02)
95% CI
−0.001
−0.002
<0.001
Effect sizea
95% CI
1.59 (1.10–2.31)
1.48 (1.08–2.03)
1.42 (1.10–1.85)
1.33 (1.06–1.66)
1.35 (1.05–1.74)
HRa
Breast cancer risk in relation Breast cancer risk
to SNP through HOMA-IR
in relation to SNP
Indirect effect
BMI body mass index, CI confidence interval, HOMA-IR homeostatic model assessment–insulin resistance, HR hazard ratio, SNP single–nucleotide polymorphism, w/h ratio waist-to-hip ratio
Note: Proportions explained by HOMA-IR for SNP–breast cancer risk association for rs560887 (41.7%,10%, 10%, and 14.3% among non-obese group [BMI < 30, waist ≤88 cm, w/h ≤ 0.85, and <40% calories from fat, respectively]; 0%, 18.1%, 19.1%, and 0% among obese-group [BMI ≥ 30, waist >88 cm, w/h > 0.85, and ≥40% calories from fat, respectively]), and for rs35767 (0.4% in w/h ≤ 0.85; 11.9% in w/h > 0.85). Only SNPs having
statistically significant results are included. Numbers in bold face are statistically significant
a
Multivariate regression was adjusted by covariates (age, education, family history of diabetes mellitus, family history of breast cancer, cardiovascular disease ever, hypertension ever, high cholesterol requiring pills
ever, total Healthy Eating Index-2005 score, dietary alcohol and total sugars per day, smoking status, lifetime partner, depressive symptom, oral contraceptive use, history of hysterectomy or oophorectomy, age at menarche, age at menopause, pregnancy history, breastfeeding at least 1 month, and hormone therapy); effect-modifier variables (physical activity, BMI, and w/h ratio), when not evaluated as effect modifier variables,
were adjusted as a covariate; when stratified via waist circumference, w/h ratio was not adjusted
b
Participants stratified by BMI as non-obese (BMI < 30, n = 3675) or obese (BMI ≥ 30, n = 1704); interaction test presented for the effect of BMI on the association between breast cancer and rs560887 (effect size
−0.38, p-value 0.28)
c
Participants stratified by waist circumference as non-obese (waist ≤88 cm; n = 3042) or obese (waist >88 cm; n = 2337); interaction test presented for the effect of waist circumference on the association between
breast cancer and rs560887 (effect size −0.55, p-value 0.13)
d
Participants stratified by w/h as non-obese (w/h ≤ 0.85; n = 3712) or obese (w/h > 0.85; n = 1667); interaction tests presented for the effect of w/h on the association between breast cancer and rs560887 (effect size
−0.57, p-value 0.11) and rs35767 (effect size 0.54, p-value 0.01)
e
Participants stratified by dietary fat intake as non-obese (< 40% calories from fat; n = 4325) or obese (≥ 40% calories from fat; n = 1054); interaction test presented for the effect of dietary fat intake on the association
between breast cancer and rs560887 (effect size −0.45, p-value 0.26)
rs560887 G6PC2
Dietary fat intake
e
T/C
T/C
IGF1
rs35767
T/C
T/C
rs560887 G6PC2
Waist/hip Ratiod
rs560887 G6PC2
Waistc
HRa
Nearest Effect Favorable Energy Balance Group
Unfavorable Energy Balance Group
gene
allele/
Direct effect
Indirect effect
Total effect
Direct effect
Other
Breast cancer risk in relation Breast cancer risk in Breast cancer risk in relation to SNP
allele Breast cancer risk in
relation to SNP through to SNP through HOMA-IR
relation to SNP
through pathways other than HOMA-IR
pathways other than
HOMA-IR
rs560887 G6PC2
BMI
b
SNP
Table 3 Mediation effect of HOMA-IR on the relationship between glucose metabolism–relevant SNPs and breast cancer risk, stratified by obesity status and obesity-related
factors
Jung et al. BMC Cancer (2017) 17:290
Page 8 of 14
FADS1
CRY2
rs174550
rs11605924
CRY2
rs11605924
e
f
GCK
SLC30A8
rs11558471
A/G
G/A
G/A
G/T
C/A
T/C
T/C
C/A
T/C
G/A
Effect allele/
Other allele
1.07
0.91
0.73
0.80
0.84
1.17
0.75
0.89
1.15
0.79
(0.87–1.31)
(0.71–1.17)
(0.52–1.00)
(0.59–1.07)
(0.67–1.06)
(0.91–1.51)
(0.58–0.99)
(0.73–1.09)
(0.92–1.43)
(0.60–1.02)
(−0.004–0.03)
(−0.04–0.004)
−0.02
(−0.01–0.04)
0.01
0.01
(−0.01–0.01)
(−0.01–0.02)
−0.01
−0.002
(−0.02–0.01)
−0.01
(−0.01–0.02)
−0.004
(−0.03–0.004)
(−0.01–0.01)
−0.002
0.01
(0.002–0.04)
0.02
95% CI
Effect sizea
HRa
95% CI
CRC risk in relation to
SNP through glucose
CRC risk in relation to SNP
through pathways other
than glucose
0.95
0.94
0.72
0.84
0.81
1.03
0.88
0.82
1.05
0.80
HRa
(0.80–1.12)
(0.76–1.17)
(0.55–0.95)
(0.64–1.08)
(0.66–0.99)
(0.83–1.28)
(0.70–1.11)
(0.69–0.98)
(0.87–1.27)
(0.64–1.00)
95% CI
CRC risk in
relation to SNP
1.60
0.57
0.95
1.36
1.20
1.23
1.00
1.32
1.40
1.00
HRa
(0.93–2.75)
(0.33–1.01)
(0.70–1.31)
(0.81–2.30)
(0.92–1.56)
(0.93–1.63)
(0.75–1.34)
(0.94–1.85)
(0.97–2.03)
(0.65–1.55)
95% CI
CRC risk in relation to SNP
through pathways other
than glucose
−0.002
−0.003
0.01
<0.001
0.004
0.01
0.01
<0.001
<0.001
0.001
Effect sizea
(−0.01–0.01)
(−0.01–0.01)
(−0.01–0.02)
(−0.003–0.003)
(−0.02–0.01)
(−0.01–0.02)
(−0.04–0.02)
(−0.004–0.004)
(−0.01–0.01)
(−0.01–0.01)
95% CI
CRC risk in relation
to SNP through glucose
Indirect effect
Unfavorable Energy Balance Group
Direct effect
Total effect
Direct effect
Indirect effect
Favorable Energy Balance Group
Total effect
1.60
0.66
0.99
1.58
0.97
1.25
1.01
1.07
1.37
1.06
HRa
(1.07–2.40)
(0.43–1.00)
(0.76–1.28)
(1.01–2.48)
(0.79–1.20)
(1.00–1.57)
(0.80–1.27)
(0.82–1.39)
(1.02–1.83)
(0.75–1.51)
95% CI
CRC risk in relation
to SNP
BMI body mass index, CI confidence interval, CRC colorectal cancer, HR hazard ratio, SNP single–nucleotide polymorphism, w/h ratio waist-to-hip ratio
Note: Proportions explained by glucose for SNP–CRC risk association for rs4607517 (1.5%, 0.5%, and 3.3% among non-obese group [BMI < 30, MET ≥10, and <40% calories from fat, respectively]; N/A [> 100%], 3.3%,
and 12.5% among obese-group [BMI ≥ 30, MET <10, and ≥40% calories from fat, respectively]), for rs174550 (N/A [> 100%] and N/A [> 100%] among non-obese group [BMI < 30 and waist ≤88 cm, respectively]; 9.9%
and 10.3% among obese-group [BMI ≥ 30 and waist >88 cm, respectively]), for rs11605924 (8.5% and 3.7% among non-obese group [BMI < 30 and waist ≤88 cm, respectively]; N/A [> 100%] and N/A [> 100%] among
obese-group [BMI ≥ 30 and waist >88 cm, respectively]), for rs560887 (14.7% in waist ≤88 cm; N/A [>100%] in waist >88 cm), for rs10885122 (4.7% in w/h ≤ 0.85; 37.7% in w/h > 0.85), and for rs11558471 (12.5% in
<40% calories from fat; 0.9% in ≥40% calories from fat). Only SNPs having statistically significant results are included. Numbers in bold face are statistically significant
a
Multivariate regression was adjusted by covariates (age, education, family history of diabetes mellitus, family history of colorectal cancer, cardiovascular disease ever, hypertension ever, high cholesterol requiring pills
ever, total Healthy Eating Index-2005 score, dietary alcohol and total sugars per day, smoking status, lifetime partner, depressive symptom, oral contraceptive use, history of hysterectomy or oophorectomy, age at menarche, age at menopause, pregnancy history, breastfeeding at least 1 month, and hormone therapy); effect-modifier variables (physical activity, BMI, and w/h ratio), when not evaluated as effect modifier variables,
were adjusted as a covariate; when stratified via waist circumference, w/h ratio was not adjusted
b
Participants stratified by BMI as non-obese (BMI < 30, n = 3675) or obese (BMI ≥ 30, n = 1704); interaction tests presented for the effect of BMI on the association between CRC and rs4607517 (effect size −0.30, pvalue 0.65), rs174550 (effect size −0.70, p-value 0.09), and rs11605924 (effect size −0.38, p-value 0.15)
c
Participants stratified by waist circumference as non-obese (waist ≤88 cm; n = 3042) or obese (waist >88 cm; n = 2337); interaction tests presented for the effect of waist circumference on the association between
CRC and rs560887 (effect size −0.40, p-value 0.27), rs174550 (effect size −0.89, p-value 0.01), and rs11605924 (effect size −0.42, p-value 0.09)
d
Participants stratified by w/h as non-obese (w/h ≤ 0.85; n = 3712) or obese (w/h > 0.85; n = 1667); interaction test presented for the effect of w/h on the association between CRC and rs10885122 (effect size 0.59,
p-value 0.02)
e
Participants stratified by physical activity level as non-obese (MET ≥10; n = 2344) or obese (MET <10; n = 3035); interaction test presented for the effect of physical activity on the association between CRC and
rs4607517 (effect size 0.94, p-value 0.14)
f
Participants stratified by dietary fat intake as non-obese (< 40% calories from fat; n = 4325) or obese (≥ 40% calories from fat; n = 1054); interaction tests presented for the effect of dietary fat intake on the association
between CRC and rs4607517 (effect size 1.45, p-value 0.01) and rs11558471 (effect size −1.53, p-value 0.04)
GCK
rs4607517
Dietary fat intake
rs4607517
Physical activity level
rs10885122
w/h Ratio
ADRA2A
FADS1
rs174550
d
G6PC2
rs560887
Waist
c
GCK
Nearest
gene
rs4607517
BMI
b
SNP
Table 4 Mediation effect of glucose on the relationship between glucose metabolism–relevant SNPs and CRC risk, stratified by obesity status and obesity-related factors
Jung et al. BMC Cancer (2017) 17:290
Page 9 of 14
Jung et al. BMC Cancer (2017) 17:290
(Table 5), and insulin levels (Additional file 4: Table
S4.2). For each mediator, those effects were stratified by
obesity status (BMI, waist, and w/h), level of physical
activity, and dietary fat intake. Overall, the direct effect
of glucose metabolism SNPs on increased CRC risk
accounted for a majority of the total effect, suggesting a
minimal influence of indirect effect on the total effect.
In addition, the indirect effects mediated via glucose
metabolism traits were not apparently different between
obesity strata.
Carriers of the GCK rs4607517 G major-allele had an
association with decreased CRC risk in non-obese women
with BMI < 30 and MET ≥10, and in obese women with
≥40% calories from fat (see total effect in Tables 4 and 5).
Compared with the total effects, the direct effects of
glucose metabolism-related SNP on CRC risk, after
accounting for glucose (Table 4) or HOMA-IR (Table 5),
decreased slightly but were no longer statistically significant; it suggested existence of glucose metabolism traits’
mediation effects (roughly, 10%) on the SNP–cancer risk.
Similarly, carriers of the CRY2 rs11605924 C major-allele
had an association with decreased CRC risk in women
with BMI < 30 and waist ≤88 cm (Tables 4 and 5); after
accounting for glucose (Table 4) or HOMA-IR (Table 5),
the direct effects were no longer significant, indicating potential mediation effects (roughly 5%) on the SNP–CRC
risk association. In addition, carriers of the G6PC2
rs560887 T minor-allele had an association with decreased
CRC risk in women with waist ≤88 cm, and the mediation
effect of glucose on the SNP–CRC risk association in
these non-obese carriers resulted in the decreased direct
effect (roughly 15%) of CRC risk in relation to G6PC2
carriers (Table 4).
In contrast, carriers of the FADS1 rs174550 T majorallele, the ADRA2A rs10885122 G major-allele, and the
SLC30A8 rs11558471 A major-allele had associations with
increased CRC risk in obese women (BMI ≥ 30, waist
>88 cm for FADS1 carriers; w/h > 0.85 for ADRA2A carriers; and ≥40% calories from fat for SLC30A8 carriers)
(Tables 4 and 5, and Additional file 4: Table S4.2).
Roughly, less than 10% of the CRC risk due to each
genetic variant was mediated via glucose, HOMA-IR, or
insulin in the relevant obese groups. No significantly
different mediation effects were found between obesity
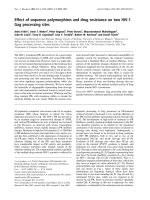
strata. Likewise, carriers of the DGKB/TMEM195
rs2191349 G minor-allele had an association with increased risk of CRC in obese women (BMI ≥ 30, waist
>88 cm, and w/h > 0.85) (Table 5 and Additional file 4:
Table S4.2). The insulin effect as a mediator in these obese
carriers was minimal (15%) (Additional file 4: Table S4.2).
On the contrary, the HOMA-IR mediator effect in this
group (Table 5) accounted for approximately 50% of the
total effect. This resulted in the elevated and significant
direct effect of SNP–CRC risk (i.e. from total effect after
Page 10 of 14
accounting for the mediators); it suggests a positive effect
of HOMA-IR on the total effect of the SNP–CRC
association.
Discussion
In this retrospective study of data from a large cohort of
postmenopausal women, by using 16 glucose metabolismrelated SNPs previously associated with glycemic metabolic
traits, [40–42] we partitioned the total effect of glucose metabolism genetic variants on breast cancer and CRC into
direct (cancer risk associated with SNPs mediated through
pathways other than glucose metabolism traits) and indirect
(cancer risk associated with SNPs mediated by glucose metabolism traits) effects. By stratifying data via obesity status
and obesity-relevant lifestyle factors, we also assessed how
those effects differed between strata. There have been relatively few population-based epidemiologic studies between
glucose metabolism genetic variants and breast cancer and
CRC risk [16–22]. To our knowledge, this is the first study
to evaluate the association between glucose metabolism
genetic variants and breast cancer and CRC risk by partitioning the glucose metabolism genetic variants’ effects on
the risk for those cancers into direct and indirect effects.
Additionally, we assessed the role of obesity and related
factors as effect modifiers.
We found that among the16 glucose metabolismrelated SNPs evaluated, three were associated with
breast cancer risk, and seven with CRC risk. These
SNPs’ associations with cancer risk differed between
non-obese and obese carriers, indicating that glucose
metabolism-related SNPs’ interactions with obesity and
related lifestyle factors influence cancer risk. For most of
the SNPs we studied, the direct effects on cancer risk
accounted for a majority of the total effect: only roughly
15% of the cancer risk associated with glucose
metabolism-related SNPs was mediated via glucose metabolism traits. This suggests that glucose metabolism
traits are not the main mediators through which glucose
metabolism-related SNPs are associated with increased
risk for breast cancer and CRC. Further, no apparent
differences in the indirect effects (mediated via glucose
metabolism traits) were observed between non-obese
and obese strata. Our findings thus indicate that glucose
metabolism-related genetic variants interact with obesity
and lifestyle factors, resulting in altered cancer risk not
through glucose metabolism traits pathways, but
through different mechanisms.
In relation to breast cancer risk, obese carriers of G6PC2,
IGF1, and GCKR had an association with increased risk.
Expression of the G6PC2 gene (glycolytic inhibitor) is elevated in cancer cells and related to a decreased survival rate
in cancer patients, suggesting its role in glucose metabolism
and cell cycle control in cancer cells [49–51]. The IGF1
and GCKR variants are related to glucose metabolism; both
Nearest gene
Effect Favorable Energy Balance Group
allele/
Indirect effect
Other Direct effect
allele CRC risk in relation to
CRC risk in relation
SNP through pathways to SNP through
HOMA-IR
other than HOMA-IR
HRa
95% CI
Effect sizea 95% CI
HRa
95% CI
Total effect
CRC risk in
relation to SNP
Unfavorable Energy Balance Group
Direct effect
Indirect effect
CRC risk in relation
CRC risk in relation to
SNP through pathways to SNP through
HOMA-IR
other than HOMA-IR
HRa
95% CI
Effect sizea 95% CI
HRa
Total effect
CRC risk in relation
to SNP
b
95% CI
BMI
rs2191349 DGKB/TMEM195 G/T
1.04
(0.84–1.28)
<0.001
(−0.004–0.004) 1.07 (0.90–1.28) 1.45
(1.03–2.03)
<0.001
(−0.003–0.003) 1.17 (0.90–1.52)
rs4607517 GCK
G/A
0.79
(0.61–1.03)
<0.001
(−0.01–0.01)
0.80 (0.64–1.00) 1.04
(0.66–1.62)
<0.001
(−0.004–0.003) 1.06 (0.75–1.51)
rs174550
FADS1
T/C
1.16
(0.93–1.45)
<0.001
(−0.001–0.001) 1.05 (0.87–1.27) 1.40
(0.96–2.04)
−0.01
(−0.02–0.01)
1.37 (1.02–1.83)
rs11605924 CRY2
C/A
0.87
(0.71–1.07)
<0.001
(−0.01–0.01)
0.82 (0.69–0.98) 1.32
(0.93–1.87)
<0.001
(−0.003–0.003) 1.07 (0.82–1.39)
Waistc
rs2191349 DGKB/TMEM195 G/T
0.97
(0.76–1.23)
0.002
(−0.01–0.01)
1.00 (0.81–1.23) 1.37
(1.05–1.79)
−0.002
(−0.004–0.01) 1.20 (0.97–1.48)
rs174550
FADS1
T/C
1.22
(0.94–1.58)
−0.002
(−0.01–0.01)
1.03 (0.83–1.28) 1.24
(0.93–1.65)
−0.01
(−0.02–0.002) 1.25 (1.00–1.57)
rs11605924 CRY2
C/A
0.84
(0.67–1.06)
<0.001
(−0.01–0.01)
0.81 (0.66–0.99) 1.17
(0.90–1.54)
<0.001
(−0.01–0.01)
0.97 (0.79–1.20)
Waist/hip Ratiod
rs2191349 DGKB/TMEM195 G/T
1.04
(0.84–1.29)
0.003
(−0.01–0.004) 1.03 (0.86–1.23) 1.38
(1.00–1.89)
<0.001
(−0.01–0.01)
1.24 (0.97–1.59)
rs10885122 ADRA2A
G/T
0.78
(0.58–1.05)
<0.001
(−0.01–0.01)
0.84 (0.64–1.08) 1.31
(0.77–2.20)
<0.001
(−0.01–0.01)
1.58 (1.01–2.48)
rs174550
FADS1
T/C
1.15
(0.92–1.45)
0.002
(−0.004–0.01) 1.08 (0.89–1.30) 1.43
(1.01–2.03)
−0.008
(−0.02–0.004) 1.27 (0.97–1.66)
Physical activity levele
rs4607517 GCK
G/A
0.73
(0.52–1.01)
<0.001
(−0.003–0.003) 0.72 (0.55–0.95) 0.95
(0.69–1.31)
−0.001
(−0.01–0.004) 0.99 (0.76–1.28)
Dietary fat intakef
rs4607517 GCK
G/A
0.92
(0.72–1.18)
<0.001
(−0.01–0.004) 0.94 (0.76–1.17) 0.58
(0.33–1.03)
−0.001
(−0.01–0.001) 0.66 (0.43–1.00)
rs11558471 SLC30A8
A/G
1.08
(0.88–1.33)
<0.001
(−0.01–0.01)
0.95 (0.80–1.12) 1.64
(0.94–2.85)
−0.003
(−0.01–0.01)
1.60 (1.07–2.40)
BMI body mass index, CI confidence interval, CRC colorectal cancer, HOMA-IR homeostatic model assessment–insulin resistance, HR hazard ratio, SNP single–nucleotide polymorphism, w/
h ratio waist-to-hip ratio
Note: Proportions explained by HOMA-IR for SNP–CRC risk association for rs2191349 (42.8%, 2.0%, and 33.3% among non-obese group [BMI < 30, waist ≤88 cm, w/h ≤ 0.85, respectively];
N/A [> 100%], 85.0%, and 58.3% among obese-group [BMI ≥ 30, waist >88 cm, w/h > 0.85, respectively]), for rs4607517 (0.4%, 0.7%, and 2.7% among non-obese group [BMI < 30, MET
≥10, and <40% calories from fat, respectively]; 42.8%, 3.6%, and 10.9% among obese-group [BMI ≥ 30, MET <10, and ≥40% calories from fat, respectively]), for rs174550 (N/A [> 100%],
N/A [> 100%], and N/A[> 100%] among non-obese group [BMI < 30, waist ≤88 cm, and w/h ≤ 0.85, respectively]; 8.7%, 6.3%, and 63.3% among obese-group [BMI ≥ 30, waist >88 cm,
and w/h > 0.85, respectively]), for rs11605924 (6.1% and 3.7% among non-obese group [BMI < 30 and waist ≤88 cm, respectively]; N/A [> 100%] and N/A [> 100%] among obese-group
[BMI ≥ 30 and waist >88 cm, respectively]), for rs10885122 (6.7% in w/h ≤ 0.85; 47.6% in w/h > 0.85), and for rs11558471 (13.8% in <40% calories from fat; 5.7% in ≥40% calories from
fat).
Only SNPs having statistically significant results are included. Numbers in bold face are statistically significant
a
Multivariate regression was adjusted by covariates (age, education, family history of diabetes mellitus, family history of colorectal cancer, cardiovascular disease ever, hypertension ever,
high cholesterol requiring pills ever, total Healthy Eating Index-2005 score, dietary alcohol and total sugars per day, smoking status, lifetime partner, depressive symptom, oral contraceptive use, history of hysterectomy or oophorectomy, age at menarche, age at menopause, pregnancy history, breastfeeding at least 1 month, and hormone therapy); effect-modifier variables (physical activity, BMI, and w/h ratio), when not evaluated as effect modifier variables, were adjusted as a covariate; when stratified via waist circumference, w/h ratio was
not adjusted
b
Participants stratified by BMI as non-obese (BMI < 30, n = 3675) or obese (BMI ≥ 30, n = 1704); interaction tests presented for the effect of BMI on the association between CRC and
rs2191349
(effect size −0.10, p-value 0.70), rs4607517 (effect size −0.30, p-value 0.65), rs174550 (effect size −0.70, p-value 0.09), and rs11605924 (effect size −0.38, p-value 0.15)
c
Participants stratified by waist circumference as non-obese (waist ≤88 cm; n = 3042) or obese (waist >88 cm; n = 2337); interaction tests presented for the effect of waist circumference
on
the association between CRC and rs2191349 (effect size −0.21, p-value 0.38), rs174550 (effect size −0.89, p-value 0.01), and rs11605924 (effect size −0.42, p-value 0.09)
d
Participants stratified by w/h as non-obese (w/h ≤ 0.85; n = 3712) or obese (w/h > 0.85; n = 1667); interaction tests presented for the effect of w/h on the association between CRC and
rs2191349
(effect size −0.21, p-value 0.40), rs10885122 (effect size 0.59, p-value 0.02), and rs174550 (effect size −0.34, p-value 0.34)
e
Participants stratified by physical activity level as non-obese (MET ≥10; n = 2344) or obese (MET <10; n = 3035); interaction test presented for the effect of physical activity on the association
between
CRC and rs4607517 (effect size 0.94, p-value 0.14)
f
Participants stratified by dietary fat intake as non-obese (< 40% calories from fat; n = 4325) or obese (≥ 40% calories from fat; n = 1054); interaction tests presented for the effect of dietary fat intake on the association between CRC and rs4607517 (effect size 1.45, p-value 0.01) and rs11558471 (effect size −1.53, p-value 0.04)
SNP
Table 5 Mediation effect of HOMA-IR on the relationship between glucose metabolism–relevant SNPs and CRC risk, stratified by obesity status and obesity-related factors
Jung et al. BMC Cancer (2017) 17:290
Page 11 of 14
Jung et al. BMC Cancer (2017) 17:290
are highly expressed in the liver, contributing to hepatic
glucose metabolism [41]. IGFI encodes insulin-like growth
factor I, which is well known to increase cancer risk, and
elevates HOMA-IR levels [22, 40]. Additionally, GCKR
inhibits glucokinase, a key protein in glucose metabolism,
leading to increased hepatic glucose production [41, 52].
These facts support the biological plausibility of the
carriers’ association with increased breast cancer risk.
Further, in this study, the carriers of these variants had
association with breast cancer, but only among the obese
women, suggesting that adiposity plays a strong role in
modulating the effect of these variants on carcinogenesis.
Interestingly, the mediation effects of glucose metabolism
traits accounted for only a small portion of the overall the
G6PC2– and IGF1–cancer associations in both non-obese
and obese women, suggesting that different pathways exist
through which obesity interacts with the G6PC2 and IGF1
genetic variants and breast cancer risk. In contrast, the
GCKR variant’s effect on cancer was mediated through
glucose by 50% in obese women (but not in non-obese
women), indicating that an adiposity-related carcinogenetic pathway in this variant intermingles with the
glucose-intolerance system.
Of the seven SNPs related to CRC risk, three (GCK,
CRY2, and G6PC2) had a lower association with CRC
among non-obese women. GCK opposing G6PC2 encodes
for glucokinsase, and mutation of this gene is related to
DM and glucose metabolism; further, the GCK variant is
associated with prostatic and pancreatic cancers [53, 54].
Our study showed a reduced CRC risk in non-obese female
carriers of this variant, indicating that a cancer-specific
mechanism incorporating glucose metabolism traits and
genes as well as obesity should be investigated. In addition,
mutation of CRY2 results in dysfunction of circadian
rhythms and is associated with tumorigenesis [20, 55]. Our
finding of reduced CRC risk associated with the CRY2
variant in non-obese women warrants further study.
The other four of the seven CRC related SNPs in our
study (FADS1, ADRA2A, SLC30A8, and DGKB/TMEM195)
had an increased relationship with CRC among obese
women. FADS1, which encodes fatty acid desaturase 1,
produces arachidonic acid related to increased insulin.
One earlier study [19] reported CRC risk associated
with this genetic variant, and their results are consistent with ours. ADRA2A and SLC30A8 have not been
studied for an association with CRC, but the functional changes that have been reported followed by
mutations (in ADRA2A, modified insulin release by
adrenergic suppression, and in SLC30A8, altered storage and maturation of insulin in beta cells [40, 56])
support our findings of increased CRC risk in relation
to these variants. Finally, DGKB regulates diacylglycerol and potentiates insulin secretion, indicating that
its mutation influences glucose homeostasis [40]; our
Page 12 of 14
findings suggest that this genetic variant is related to
carcinogenesis in obese women.
Although obesity interacts with these seven SNPs and
influences CRC risk differently between non-obese and
obese carriers, the indirect effects of glucose metabolism
traits on the SNP–CRC risk were minimal and did not
differ between obesity strata (except in the case of
DGKB/TMEM195). Further study is needed to examine
obesity–glycemic gene–CRC mechanisms mediated
through different pathways. In contrast, among obese
women, roughly 50% of CRC risk associated with
DGKB/TMEM195 variant was mediated via HOMA-IR.
This supports the role of adiposity in carcinogenesis
through deregulated glycemic metabolism.
We did not conduct any subtype analyses of breast
cancer cases due to insufficient statistical power (cases
represented less than 3% of each subset). Since we were
using this analysis to generate new hypotheses, we
did not include any multiple-testing adjustments in
our analyses. On the basis of prior findings of 16 loci
associated with glucose metabolism, we tested the
hypothesis that these genetic variants’ interactions
with obesity and lifestyle modifiers influence glucose
homeostasis, resulting in altered cancer risk. The
small indirect effect could be due to measurement
error in the mediators. Since our study was conducted using data from only European-American
postmenopausal women, care should be taken when
generalizing our findings to other populations.
Conclusions
Our results suggest that in postmenopausal women,
glucose intolerance has a potential role in the risk for breast
cancer and CRC. Obesity modulates the glucose metabolism genetic variant–cancer risk association through pathways other than glucose metabolism traits. Further studies
are needed to explore these complicated mechanisms. Our
study provides insight into gene–lifestyle interactions and
suggests data on potential genetic targets for use in clinical
trials for cancer prevention and intervention strategies to
reduce the cancer risk in postmenopausal women.
Additional files
Additional file 1: Effect size of glucose metabolism–relevant SNPs on
metabolic biomarkers. Table S1.1.Effect size of glucose metabolism–relevant
SNPs on glucose level in the pathway of glucose metabolism genetic variants,
glucose metabolism traits, and breast cancer risk, stratified by obesity status
and obesity-related factors. Table S1.2. Effect size of glucose metabolism–
relevant SNPs on HOMA-IR level in the pathway of glucose metabolism
genetic variants, glucose metabolism traits, and breast cancer risk, stratified
by obesity status and obesity-related factors. Table S1.3. Effect size of
glucose metabolism–relevant SNPs on glucose level in the pathway of
glucose metabolism genetic variants, glucose metabolism traits, and CRC
risk, stratified by obesity status and obesity-related factors. Table S1.4. Effect
size of glucose metabolism–relevant SNPs on HOMA-IR level in the pathway
Jung et al. BMC Cancer (2017) 17:290
of glucose metabolism genetic variants, glucose metabolism traits, and CRC
risk, stratified by obesity status and obesity-related factors. Table S1.5. Effect
size of glucose metabolism–relevant SNPs on insulin level in the pathway of
glucose metabolism genetic variants, glucose metabolism traits, and breast
cancer risk, stratified by obesity status and obesity-related factors. Table S1.6.
Effect size of glucose metabolism–relevant SNPs on insulin level in the pathway
of glucose metabolism genetic variants, glucose metabolism traits, and CRC
risk, stratified by obesity status and obesity-related factors. (DOC 188 kb)
Additional file 2: Characteristics of participants. Table S2.1.
Characteristics of participants, stratified by obesity (measured via waist
circumference). Table S2.2. Characteristics of participants, stratified by
obesity (measured via w/h ratio). Table S2.3. Characteristics of
participants, stratified by physical activity level. Table S2.4. Characteristics
of participants, stratified by dietary fat intake. (DOC 387 kb)
Additional file 3: Allele frequencies of 16 glucose metabolism–relevant
SNPs. Table S3.1. Allele frequencies of 16 glucose metabolism–relevant
SNPs, stratified by obesity (measured via BMI). Table S3.2. Allele
frequencies of 16 glucose metabolism–relevant SNPs, stratified by obesity
(measured via waist circumference). Table S3.3. Allele frequencies of 16
glucose metabolism–relevant SNPs, stratified by obesity (measured via waist/
hip). Table S3.4. Allele frequencies of 16 glucose metabolism–relevant SNPs,
stratified by physical activity level. Table S3.5. Allele frequencies of 16 glucose
metabolism–relevant SNPs, stratified by dietary fat intake. (DOC 174 kb)
Additional file 4: Mediation effect of insulin on the relationship
between glucose metabolism–relevant SNPs and cancer risk. Table S4.1.
Mediation effect of insulin on the relationship between glucose
metabolism–relevant SNPs and breast cancer risk, stratified by obesity
status and obesity-related factors. Table S4.2. Mediation effect of insulin
on the relationship between glucose metabolism–relevant SNPs and CRC
risk, stratified by obesity status and obesity-related factors. (DOC 139 kb)
Abbreviations
BMI: Body mass index; CI: Confidence interval; CRC: Colorectal cancer;
DM: Diabetes mellitus; GWAS: Genome-wide association studies; HOMAIR: Homeostatic model assessment–insulin resistance; HR: Hazard ratio;
IR: Insulin resistance; MET: Metabolic equivalent; SNP: Single-nucleotide
polymorphism; w/h: Weight-to-hip ratio; WHI: Women’s health initiative
Acknowledgements
N/A
Funding
No specific funding was received for this study.
Availability of data and materials
All datasets on which the conclusions of the manuscript rely have been
deposited in publicly available WHI repositories (phs000200.v10.p3).
Authors’ contributions
SJ formulated the research question, designed and conducted data analysis,
and wrote the article. ES and JP contributed to the study concept, data
analysis and interpretation, and drafting of the article. ZZ contributed to the
study concept, research design, data interpretation, and drafting of the
article. In addition, all authors reviewed the final manuscript. All authors read
and approved the final manuscript.
Competing interests
The authors declare that they have no competing interests.
Consent for publication
Not applicable.
Ethics approval and consent to participate
Each institution obtained human subjects committee approval. All
participants provided written informed consent. This study was approved by
the ethics committees of each participating clinical center of the WHI and
the University of California, Los Angeles.
Page 13 of 14
Publisher’s Note
Springer Nature remains neutral with regard to jurisdictional claims in
published maps and institutional affiliations.
Author details
1
Translational Sciences Section, Jonsson Comprehensive Cancer Center,
School of Nursing, University of California Los Angeles, 700 Tiverton Ave,
3-264 Factor Building, Los Angeles, CA 90095, USA. 2Department of Human
Genetics, David Geffen School of Medicine, University of California Los
Angeles, Los Angeles, CA, USA. 3Department of Epidemiology, Fielding
School of Public Health, University of California Los Angeles, Los Angeles, CA,
USA.
Received: 26 May 2016 Accepted: 19 April 2017
References
1. American Cancer Society. Breast Cancer Facts & Figures 2015–2016. Atlanta:
American Cancer Society Inc.; 2015.
2. American Cancer Society. Global Cancer Facts & Figures 3rd Edition. Atlanta:
American Cancer Society, Inc.;2015.
3. Tenesa A, Campbell H, Theodoratou E, Dunlop L, Cetnarskyj R, Farrington SM,
Dunlop MG. Common genetic variants at the MC4R locus are associated with
obesity, but not with dietary energy intake or colorectal cancer in the Scottish
population. Int J Obes. 2009;33(2):284–8.
4. Pendyala S, Neff LM, Suarez-Farinas M, Holt PR. Diet-induced weight loss
reduces colorectal inflammation: implications for colorectal carcinogenesis.
Am J Clin Nutr. 2011;93(2):234–42.
5. Nimptsch K, Aleksandrova K, Boeing H, Janke J, Lee YA, Jenab M, Kong SY,
Tsilidis KK, Weiderpass E, Bueno-De-Mesquita HB, et al. Plasma fetuin-a
concentration, genetic variation in the AHSG gene and risk of colorectal
cancer. Int J Cancer. 2015;137(4):911–20.
6. Lee SK, Moon JW, Lee YW, Lee JO, Kim SJ, Kim N, Kim J, Kim HS, Park SH.
The effect of high glucose levels on the hypermethylation of protein
phosphatase 1 regulatory subunit 3C (PPP1R3C) gene in colorectal cancer.
J Genet. 2015;94(1):75–85.
7. Wairagu PM, Phan AN, Kim MK, Han J, Kim HW, Choi JW, Kim KW, Cha SK,
Park KH, Jeong Y. Insulin priming effect on estradiol-induced breast cancer
metabolism and growth. Cancer Biol Ther. 2015;16(3):484–92.
8. Wahdan-Alaswad R, Fan Z, Edgerton SM, Liu B, Deng XS, Arnadottir SS,
Richer JK, Anderson SM, Thor AD. Glucose promotes breast cancer
aggression and reduces metformin efficacy. Cell Cycle. 2013;12(24):3759–69.
9. Kabat GC, Kim M, Caan BJ, Chlebowski RT, Gunter MJ, Ho GY, Rodriguez BL,
Shikany JM, Strickler HD, Vitolins MZ, et al. Repeated measures of serum
glucose and insulin in relation to postmenopausal breast cancer. Int J
Cancer. 2009;125(11):2704–10.
10. Vona-Davis L, Rose DP. Type 2 diabetes and obesity metabolic interactions:
common factors for breast cancer risk and novel approaches to prevention
and therapy. Curr Diabetes Rev. 2012;8(2):116–30.
11. Sieri S, Muti P, Claudia A, Berrino F, Pala V, Grioni S, Abagnato CA, Blandino G,
Contiero P, Schunemann HJ, et al. Prospective study on the role of glucose
metabolism in breast cancer occurrence. Int J Cancer. 2012;130(4):921–9.
12. Clayton PE, Banerjee I, Murray PG, Renehan AG. Growth hormone, the
insulin-like growth factor axis, insulin and cancer risk. Nat Rev Endocrinol.
2011;7(1):11–24.
13. Boyd DB. Insulin and cancer. Integr Cancer Ther. 2003;2(4):315–29.
14. Argiles JM, Lopez-Soriano FJ. Insulin and cancer (review). Int J Oncol.
2001;18(4):683–7.
15. Arcidiacono B, Iiritano S, Nocera A, Possidente K, Nevolo MT, Ventura V, Foti D,
Chiefari E, Brunetti A. Insulin resistance and cancer risk: an overview of the
pathogenetic mechanisms. Exp Diabetes Res. 2012;2012:789174.
16. Ollberding NJ, Cheng I, Wilkens LR, Henderson BE, Pollak MN, Kolonel LN, Le
Marchand L. Genetic variants, prediagnostic circulating levels of insulin-like
growth factors, insulin, and glucose and the risk of colorectal cancer: the
multiethnic cohort study. Cancer Epidemiol Biomarkers Prev. 2012;21(5):810–20.
17. Feik E, Baierl A, Hieger B, Fuhrlinger G, Pentz A, Stattner S, Weiss W, Pulgram T,
Leeb G, Mach K, et al. Association of IGF1 and IGFBP3 polymorphisms with
colorectal polyps and colorectal cancer risk. Cancer Causes Control. 2010;21(1):91–7.
18. Kaabi B, Belaaloui G, Benbrahim W, Hamizi K, Sadelaoud M, Toumi W,
Bounecer H. ADRA2A Germline Gene polymorphism is associated to the
Jung et al. BMC Cancer (2017) 17:290
19.
20.
21.
22.
23.
24.
25.
26.
27.
28.
29.
30.
31.
32.
33.
34.
35.
36.
37.
38.
39.
40.
severity, but not to the risk, of breast cancer. Pathol Oncol Res.
2016;22(2):357–65.
Zhang B, Jia WH, Matsuda K, Kweon SS, Matsuo K, Xiang YB, Shin A, Jee SH,
Kim DH, Cai Q, et al. Large-scale genetic study in east Asians identifies six new
loci associated with colorectal cancer risk. Nat Genet. 2014;46(6):533–42.
Mazzoccoli G, Colangelo T, Panza A, Rubino R, De Cata A, Tiberio C, Valvano MR,
Pazienza V, Merla G, Augello B, et al. Deregulated expression of cryptochrome
genes in human colorectal cancer. Mol Cancer. 2016;15(1):6.
Mao Y, Fu A, Hoffman AE, Jacobs DI, Jin M, Chen K, Zhu Y. The circadian
gene CRY2 is associated with breast cancer aggressiveness possibly via
epigenomic modifications. Tumour Biol. 2015;36(5):3533–9.
Pechlivanis S, Wagner K, Chang-Claude J, Hoffmeister M, Brenner H, Forsti A.
Polymorphisms in the insulin like growth factor 1 and IGF binding protein 3
genes and risk of colorectal cancer. Cancer Detect Prev. 2007;31(5):408–16.
Iyengar NM, Hudis CA, Dannenberg AJ. Obesity and inflammation: new
insights into breast cancer development and progression. Am Soc Clin
Oncol Educ Book. 2013;33:46-51.
Rose DP, Vona-Davis L. The cellular and molecular mechanisms by which
insulin influences breast cancer risk and progression. Endocr Relat Cancer.
2012;19(6):R225–41.
Catalan V, Gomez-Ambrosi J, Rodriguez A, Ramirez B, Silva C, Rotellar F,
Hernandez-Lizoain JL, Baixauli J, Valenti V, Pardo F, et al. Up-regulation of
the novel proinflammatory adipokines lipocalin-2, chitinase-3 like-1 and
osteopontin as well as angiogenic-related factors in visceral adipose tissue
of patients with colon cancer. J Nutr Biochem. 2011;22(7):634–41.
Liu L, Zhong R, Wei S, Xiang H, Chen J, Xie D, Yin J, Zou L, Sun J, Chen W,
et al. The leptin gene family and colorectal cancer: interaction with smoking
behavior and family history of cancer. PLoS One. 2013;8(4):e60777.
Creighton CJ, Sada YH, Zhang Y, Tsimelzon A, Wong H, Dave B, Landis MD,
Bear HD, Rodriguez A, Chang JC. A gene transcription signature of obesity
in breast cancer. Breast Cancer Res Treat. 2012;132(3):993–1000.
Wasserman L, Flatt SW, Natarajan L, Laughlin G, Matusalem M, Faerber S,
Rock CL, Barrett-Connor E, Pierce JP. Correlates of obesity in
postmenopausal women with breast cancer: comparison of genetic,
demographic, disease-related, life history and dietary factors. Int J Obes
Relat Metab Disord. 2004;28(1):49–56.
Morimoto LM, Newcomb PA, White E, Bigler J, Potter JD. Insulin-like growth
factor polymorphisms and colorectal cancer risk. Cancer Epidemiol
Biomarkers Prev. 2005;14(5):1204–11.
Khoury-Shakour S, Gruber SB, Lejbkowicz F, Rennert HS, Raskin L, Pinchev M,
Rennert G. Recreational physical activity modifies the association between a
common GH1 polymorphism and colorectal cancer risk. Cancer Epidemiol
Biomarkers Prev. 2008;17(12):3314–8.
Seti H, Leikin-Frenkel A, Werner H. Effects of omega-3 and omega-6 fatty
acids on IGF-I receptor signalling in colorectal cancer cells. Arch Physiol
Biochem. 2009;115(3):127–36.
Slattery ML, Lundgreen A, Herrick JS, Caan BJ, Potter JD, Wolff RK. Diet and
colorectal cancer: analysis of a candidate pathway using SNPS, haplotypes,
and multi-gene assessment. Nutr Cancer. 2011;63(8):1226–34.
McCarthy MI. Genomics, type 2 diabetes, and obesity. N Engl J Med. 2010;
363(24):2339–50.
Weichhaus M, Broom J, Wahle K, Bermano G. A novel role for insulin
resistance in the connection between obesity and postmenopausal breast
cancer. Int J Oncol. 2012;41(2):745–52.
Simons CC, van den Brandt PA, Stehouwer CD, van Engeland M, Weijenberg
MP. Body size, physical activity, early-life energy restriction, and associations
with methylated insulin-like growth factor-binding protein genes in
colorectal cancer. Cancer Epidemiol Biomarkers Prev. 2014;23(9):1852–62.
Slattery ML, Murtaugh M, Caan B, Ma KN, Neuhausen S, Samowitz W. Energy
balance, insulin-related genes and risk of colon and rectal cancer. Int J
Cancer. 2005;115(1):148–54.
The Women's Health Initiative Study Group. Design of the Women's Health
Initiative clinical trial and observational study. The Women's Health Initiative
study group. Control Clin Trials. 1998;19(1):61–109.
WHI Harmonized and Imputed GWAS Data. dbGaP Study Accession:
phs000746.v1.p3 [ />cgi?study_id=phs000746.v1.p3].
National Cancer Institute. SEER Program: Comparative Staging Guide For
Cancer. 1993.
Dupuis J, Langenberg C, Prokopenko I, Saxena R, Soranzo N, Jackson AU,
Wheeler E, Glazer NL, Bouatia-Naji N, Gloyn AL, et al. New genetic loci
Page 14 of 14
41.
42.
43.
44.
45.
46.
47.
48.
49.
50.
51.
52.
53.
54.
55.
56.
implicated in fasting glucose homeostasis and their impact on type 2
diabetes risk. Nat Genet. 2010;42(2):105–16.
Ingelsson E, Langenberg C, Hivert MF, Prokopenko I, Lyssenko V, Dupuis J,
Magi R, Sharp S, Jackson AU, Assimes TL, et al. Detailed physiologic
characterization reveals diverse mechanisms for novel genetic loci
regulating glucose and insulin metabolism in humans. Diabetes. 2010;
59(5):1266–75.
Nettleton JA, Hivert MF, Lemaitre RN, McKeown NM, Mozaffarian D, Tanaka T,
Wojczynski MK, Hruby A, Djousse L, Ngwa JS, et al. Meta-analysis investigating
associations between healthy diet and fasting glucose and insulin levels and
modification by loci associated with glucose homeostasis in data from 15
cohorts. Am J Epidemiol. 2013;177(2):103–15.
Matthews DR, Hosker JP, Rudenski AS, Naylor BA, Treacher DF, Turner RC.
Homeostasis model assessment: insulin resistance and beta-cell function
from fasting plasma glucose and insulin concentrations in man.
Diabetologia. 1985;28(7):412–9.
MacKinnon DP, Fairchild AJ, Fritz MS. Mediation analysis. Annu Rev Psychol.
2007;58:593–614.
Mackinnon DP, Warsi G, Dwyer JH. A simulation study of mediated effect
measures. Multivar Behav Res. 1995;30(1):41.
Shrout PE, Bolger N. Mediation in experimental and nonexperimental
studies: new procedures and recommendations. Psychol Methods.
2002;7(4):422–45.
Buettner R, Scholmerich J, Bollheimer LC. High-fat diets: modeling the
metabolic disorders of human obesity in rodents. Obesity (Silver Spring).
2007;15(4):798–808.
Institute EB. 1000 genomes browser orientation. In: Based on Project Phase I
Data. 2011.
Guo T, Chen T, Gu C, Li B, Xu C. Genetic and molecular analyses reveal
G6PC as a key element connecting glucose metabolism and cell cycle
control in ovarian cancer. Tumour Biol. 2015;36(10):7649–58.
Abbadi S, Rodarte JJ, Abutaleb A, Lavell E, Smith CL, Ruff W, Schiller J,
Olivi A, Levchenko A, Guerrero-Cazares H, et al. Glucose-6-phosphatase
is a key metabolic regulator of glioblastoma invasion. Mol Cancer Res.
2014;12(11):1547–59.
Wang B, Hsu SH, Frankel W, Ghoshal K, Jacob ST. Stat3-mediated activation of
microRNA-23a suppresses gluconeogenesis in hepatocellular carcinoma by
down-regulating glucose-6-phosphatase and peroxisome proliferator-activated
receptor gamma, coactivator 1 alpha. Hepatology. 2012;56(1):186–97.
Nettleton JA, McKeown NM, Kanoni S, Lemaitre RN, Hivert MF, Ngwa J, van
Rooij FJ, Sonestedt E, Wojczynski MK, Ye Z, et al. Interactions of dietary
whole-grain intake with fasting glucose- and insulin-related genetic loci in
individuals of European descent: a meta-analysis of 14 cohort studies.
Diabetes Care. 2010;33(12):2684–91.
Murad AS, Smith GD, Lewis SJ, Cox A, Donovan JL, Neal DE, Hamdy FC,
Martin RM. A polymorphism in the glucokinase gene that raises plasma
fasting glucose, rs1799884, is associated with diabetes mellitus and prostate
cancer: findings from a population-based, case-control study (the ProtecT
study). Int J Mol Epidemiol Genet. 2010;1(3):175–83.
Dong X, Tang H, Hess KR, Abbruzzese JL, Li D. Glucose metabolism
gene polymorphisms and clinical outcome in pancreatic cancer. Cancer.
2011;117(3):480–91.
Mazzoccoli G, Panza A, Valvano MR, Palumbo O, Carella M, Pazienza V,
Biscaglia G, Tavano F, Di Sebastiano P, Andriulli A, et al. Clock gene
expression levels and relationship with clinical and pathological features in
colorectal cancer patients. Chronobiol Int. 2011;28(10):841–51.
Kirchhoff K, Machicao F, Haupt A, Schafer SA, Tschritter O, Staiger H, Stefan N,
Haring HU, Fritsche A. Polymorphisms in the TCF7L2, CDKAL1 and SLC30A8
genes are associated with impaired proinsulin conversion. Diabetologia.
2008;51(4):597–601.