Metformin produces growth inhibitory effects in combination with nutlin-3a on malignant mesothelioma through a cross-talk between mTOR and p53 pathways
Bạn đang xem bản rút gọn của tài liệu. Xem và tải ngay bản đầy đủ của tài liệu tại đây (1.13 MB, 14 trang )
Shimazu et al. BMC Cancer (2017) 17:309
DOI 10.1186/s12885-017-3300-y
RESEARCH ARTICLE
Open Access
Metformin produces growth inhibitory
effects in combination with nutlin-3a
on malignant mesothelioma through a
cross-talk between mTOR and p53
pathways
Kengo Shimazu1,2,3†, Yuji Tada1†, Takao Morinaga2, Masato Shingyoji4, Ikuo Sekine5, Hideaki Shimada6,
Kenzo Hiroshima7, Takao Namiki3, Koichiro Tatsumi1 and Masatoshi Tagawa2,8*
Abstract
Background: Mesothelioma is resistant to conventional treatments and is often defective in p53 pathways. We then
examined anti-tumor effects of metformin, an agent for type 2 diabetes, and combinatory effects of metformin and
nutlin-3a, an inhibitor for ubiquitin-mediated p53 degradation, on human mesothelioma.
Methods: We examined the effects with a colorimetric assay and cell cycle analyses, and investigated molecular events
in cells treated with metformin and/or nutlin-3a with Western blot analyses. An involvement of p53 was tested with
siRNA for p53.
Results: Metformin suppressed cell growth of 9 kinds of mesothelioma including immortalized cells of mesothelium
origin irrespective of the p53 functional status, whereas susceptibility to nutlin-3a was partly dependent on the p53
genotype. We investigated combinatory effects of metformin and nutlin-3a on, nutlin-3a sensitive MSTO-211H and
NCI-H28 cells and insensitive EHMES-10 cells, all of which had the wild-type p53 gene. Knockdown of p53 expression
with the siRNA demonstrated that susceptibility of MSTO-211H and NCI-H28 cells to nutlin-3a was p53-dependent,
whereas that of EHMES-10 cells was not. Nevertheless, all the cells treated with both agents produced additive or
synergistic growth inhibitory effects. Cell cycle analyses also showed that the combination increased sub-G1 fractions
greater than metformin or nutlin-3a alone in MSTO-211H and EHMES-10 cells. Western blot analyses showed that
metformin inhibited downstream pathways of the mammalian target of rapamycin (mTOR) but did not activate the
p53 pathways, whereas nutlin-3a phosphorylated p53 and suppressed mTOR pathways. Cleaved caspase-3 and
conversion of LC3A/B were also detected but it was dependent on cells and treatments. The combination of both
agents in MSTO-211H cells rather suppressed the p53 pathways that were activated by nutrin-3a treatments, whereas
the combination rather augmented the p53 actions in NCI-H28 and EHMES-10 cells.
Conclusion: These data collectively indicated a possible interactions between mTOR and p53 pathways, and the
combinatory effects were attributable to differential mechanisms induced by a cross-talk between the pathways.
Keywords: Mesothelioma, Metformin, Nutlin-3a, p53, Mammalian target of rapamycin
* Correspondence:
†
Equal contributors
2
Division of Pathology and Cell Therapy, Chiba Cancer Center Research
Institute, 666-2 Nitona, Chuo-ku, Chiba 260-8717, Japan
8
Department of Molecular Biology and Oncology, Graduate School of
Medicine, Chiba University, 1-8-1 Inohana, Chuo-ku, Chiba 260-8670, Japan
Full list of author information is available at the end of the article
© The Author(s). 2017 Open Access This article is distributed under the terms of the Creative Commons Attribution 4.0
International License ( which permits unrestricted use, distribution, and
reproduction in any medium, provided you give appropriate credit to the original author(s) and the source, provide a link to
the Creative Commons license, and indicate if changes were made. The Creative Commons Public Domain Dedication waiver
( applies to the data made available in this article, unless otherwise stated.
Shimazu et al. BMC Cancer (2017) 17:309
Background
Malignant mesothelioma, developed in the pleural cavity,
is resistant to conventional treatments and the patient
numbers are growing particularly in emerging countries
[1]. A combination of cisplatin and pemetrexed, the
current first-line chemotherapy, demonstrated its effectiveness compared with cisplatin alone [2], but no further improvement in the chemotherapy was reported for more
than a decade. A possible second-line agent is not yet
established and molecular-targeting agents turned out to
be ineffective in current clinical trials [3].
Metformin, an agent for type 2 diabetes, showed the
anti-tumor activity in various types of tumors, and the
therapeutic effects were mainly attributable to inhibition
of the mammalian target of rapamycin (mTOR) pathways through AMP-activated protein kinase (AMPK)
and others molecules such as regulated in development
and DNA damage responses 1 (REDD1) [4]. Many types
of human tumors up-regulated expression of the mTOR
complex 1 which regulated cell growth and metabolism
according to their cellular energy levels, and suppression
of the mTOR pathways inhibited tumor cell growth via
4E–BP1 and p70S6K molecules [5, 6]. Inhibition of the
mTOR pathways is consequently one of the targeted
areas for development of anti-cancer agents. An agent
for suppressing the mTOR complex 1 activity, everolimus, was in fact demonstrated to inhibit tumor growth
and is currently in use for renal cell carcinoma and
breast cancer [7, 8]. An inhibitor for mTOR pathways in
general suppressed cell cycle progression but the action
mechanism was complex. Metformin, an inhibitor for
mTOR pathways, showed a number of effects including
induction of cycle arrest, apoptosis and autophagy, depending on the cell type tested [4, 5]. Previous studies
showed that the mTOR pathways were often activated in
many of mesothelioma clinical specimens and the elevated expression was linked with poor prognosis of the
patients [9–11]. Nevertheless, an effect of metformin has
not yet been examined in mesothelioma.
A majority of the p53 genotype of clinical specimens
from mesothelioma patients is wild-type but the INK4A/
ARF region, which includes the p14 and p16 genes, is
often deleted in the specimens [12]. The p14 defect in
mesothelioma facilitated ubiquitin-mediated p53 degradation since p14 blocked a MDM2 action which degraded
p53 through the ubiquitination-proteasome pathway.
The genetic characteristic led to a functional p53 deficiency and suppressed the downstream pathways despite
the wild-type p53 genotype. Nutlin-3a, an inhibitor for
interaction between MDM2 and p53, suppressed
MDM2-mediated p53 ubiquitination, and subsequently
augmented p53 expression levels by increasing p53 stability without any genotoxic stimulations [13]. Tumor
cells bearing the wild-type p53 gene in fact showed cell
Page 2 of 14
cycle arrest followed by apoptosis with nutlin-3a treatments [14, 15]. An inhibitor for the MDM2-p53 interaction is therefore a therapeutic agent for mesothelioma
since up-regulation of endogenous wild-type p53 levels
restores the p53 functions and activates the downstream
pathways. In contrast, deficiency of p16 augmented
phosphorylation of pRb and induced uninhibited cell
growth. Increased p53 levels also inhibited the pRb
phosphorylation through induction of p21, one of the
p53 target molecules [16]. Consequently, up-regulation
of p53 is a therapeutic strategy for mesothelioma by enhancing the downstream pathways and inhibiting cell
cycle progression.
Interactions between the p53 pathways and the
AMPK/mTOR pathways are not well characterized and
are influenced by a number of factors. Growth signals
through the insulin-like growth factor-mTOR pathways
are regulated by metabolic conditions, and a cross-talk
between the two pathways caused by genotoxicity is subjected to a number of cellular stresses. Accumulating
data also suggest that the activated AMPK phosphorylated p53 at serine 15 residue, a marker for p53 activation, partly through inhibition of the mTOR functions,
and that the activated p53 pathways in turn inhibited
the mTOR activities through AMPK under stress or
non-stress conditions [17–19]. Moreover, mTOR inhibitors, metformin and rapamycin, enhanced cytotoxicity of
anti-cancer agents in p53-mutated tumors but rather
protected normal cells with the wild-type p53 from the
drug-induced cytotoxicity [20]. We thereby examined
anti-tumor effects of metformin and non-genotoxic
nutlin-3a, and possible combinatory effects on mesothelioma under no metabolic stress. We further investigated a possible mechanism of the combinatory effects
in terms of interactions between up-regulation of p53
levels and inhibition of the mTOR pathways.
Methods
Cells and agents
Human mesothelioma cells, MSTO-211H (CRL-2081),
NCI-H28 (CRL-5820), NCI-H226 (CRL-5826), NCIH2052 (CRL-5915) and NCI-H2452 (CRL-5946), and
mesothelial cells immortalized with SV40 T antigen,
Met-5A (CRL-9444), were purchased from American
Type Culture Collection (Manassas, VA, USA), and
JMN-1B, EHMES-1 and EHMES-10 cells were kindly
provided by Dr. Hironobu Hamada, Hiroshima University, Japan [21]. The p53 genotypes of JMN-1B and
EHMES-1 cells are mutated and those of the others including Met-5A are wild-type. All the mesothelioma
cells with the wild-type p53 except Met-5A showed defective p14ARF and p16INK4A expression due to either
lack of the transcription or deletion of the corresponding
genomic DNA [12], whereas Met-5A cells had the
Shimazu et al. BMC Cancer (2017) 17:309
p14ARF and p16INKA genes but lost the p53 functions
because of SV40 T antigen expressed [22]. The p53
genotype of NCI-H2452 was wild-type but p53 protein
was truncated [23]. All the cells were cultured with
RPMI 1640 supplemented with 10% fetal calf serum.
Metformin (N, N-dimethylimidodicarbonimidic diamide
hydrochloride) and nutlin-3a were purchased from Wako
(Osaka, Japan) and Selleck Chemicals (Houston, TX,
USA), respectively.
Page 3 of 14
(#4108), Atg-5 (#2630), Beclin-1 (#3495) (Cell Signaling,
Danvers, MA, USA), REDD1 (10638–1-AP) (Proteintech,
Chicago, IL, USA), p53 (Ab-6, Clone DO-1) (Thermo
Fisher Scientific, Fremont, CA, USA) and glyceraldehyde3-phosphate dehydrogenase (GAPDH) (ab9484) (Abcam,
Cambrige, UK) as a loading control followed by appropriate second antibody. Dimethyl sulfoxide (DMSO), a
solvent for nutlin-3a, was also used as a control. The
membranes were developed with the ECL system (GE
Healthcare, Buckinghamshire, UK).
In vitro cytotoxicity and cell counts
Cells (5 × 10³/well) were seeded in 96-well plates and
were cultured for 4 days with different concentrations of
an agent. Cell viability was determined with a cellcounting WST kit (Wako). The amount of formazan
produced was determined with the absorbance at
450 nm and the relative viability was calculated based on
the absorbance without any treatments. Cell numbers
were also counted with the trypan blue dye exclusion
assay. Combinatory effects were examined with CalcuSyn
software (Biosoft, Cambridge, UK). Combination index
(CI) values at respective fractions affected (Fa) points
which showed relative levels of suppressed cell viability,
were calculated based on the WST assay. CI < 1, CI = 1
and CI > 1 indicate synergistic, additive and antagonistic
actions, respectively. Half maximal inhibitory concentration (IC50) values were also estimated with the CalcuSyn
software.
RNA interference
Cells were transfected with small interfering RNA
(siRNA) duplex targeting p53 or with non-coding siRNA
as a control (Invitrogen, Carlsbad, CA, USA) for 24 h
using Lipofectamine RNAiMAX according to the manufacturer’s protocol (Invitrogen).
Cell cycle analysis
Cells were treated with an agent were fixed in ice-cold
70% ethanol, incubated with RNase (50 μg/ml) and
stained with propidium iodide (50 μg/ml). The staining
profiles were analyzed with FACSCalibur (BD Biosciences, San Jose, CA, USA) and CellQuest software (BD
Biosciences).
Western blot analysis
Cell lysate was subjected to sodium dodecyl sulfate polyacrylamide gel electrophoresis. The protein was transferred to a nylon filter and was hybridized with antibody
against AMPK (catalog number: #2532), phosphorylated
AMPKα (Thr172) (#2535), 4E–BP1 (#9452), phosphorylated 4E–BP1 (#9459), p70 S6 kinase (p70S6K) (#9202),
phosphorylated p70S6K (Thr389) (#9205), Bcl-2 (#2872),
Bax (#2772), phosphorylated p53 (Ser15) (#9284),
caspase-3 (#9668), cleaved caspase-3 (#9661), LC3A/B
Results
Growth inhibitory effects of metformin or nutlin-3a on
mesothelioma
We examined anti-tumor effects of metformin with the
WST assay on 8 kinds of mesothelioma cells and an immortalized line, Met-5A cells, and compared the sensitivity with IC50 values according to the p53 functional
status (Fig. 1a, Additional file 1: Table S1). EHMES-1
and JMN-1B cells with mutated p53 gene, NCI-H2452
cells with truncated p53 protein that cannot induce p21
[23], and Met-5A cells with a loss of p53 functions by
expressed SV40 T antigen that inactivated p53, were
consequently classified as a non-functional p53 group
and the others as a functional p53 group. These cells
with the functional p53 in fact increased p53 responding
to DNA damaging agents (data not shown). Metformin
suppressed viability of all the cells but the relative viability
was different among the cells tested. The susceptibility to
metformin was independent of the p53 functionality.
Average IC50 values of cells in the functional p53 group
was 8.5 + 7.4 (SE) mM and that of cells in the nonfunctional p53 group was 8.2 + 3.5 mM (P = 0.93). We
also tested growth of cells treated with metformin with a
dye exclusion test (Fig. 1b). The suppressed growth rates
varied among the cells but the proliferation was inhibited
in a dose-dependent manner.
We investigated inhibitory effects of nutlin-3a with
the WST assay on the mesothelioma cell panel (Fig. 2,
Additional file 1: Table S1). Nutlin-3a blocked the interaction between p53 and MDM2, and consequently increased levels of p53, phosphorylated p53 and MDM2,
one of the p53 target proteins, in mesothelioma with
the wild-type p53 gene (Additional file 2: Figure S1).
The relative viability demonstrated that cells with functional p53 except EHMES-10 were susceptible to a low
concentration of nutlin-3a (IC50; less than 6 μM),
whereas others with non-functional p53 were relatively
insensitive (IC50; more than 17 μM) (Fig. 2). Average
IC50 values were lower in the functional p53 cells even
including EHMES-10 cells (8.0 + 5.6 μM) than in the
non-functional p53 cells (24.5 + 2.7) (P < 0.05). These
data indicated that nutlin-3a suppressed viability of
Shimazu et al. BMC Cancer (2017) 17:309
Page 4 of 14
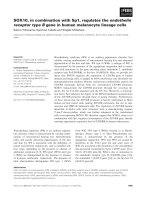
Fig. 1 Susceptibility of mesothelioma and immortalized mesothelial cells to metformin. a Cells were treated with metformin at various concentrations
for 4 days and the cell viabilities were measured with the WST assay. Relative viability was calculated based on untreated cells. IC50 values were
calculated with CalcuSyn software. b Cells were treated with metformin as indicated and the live cell numbers were counted with a trypan blue dye
exclusion assay. Averages and SE bars are shown (n=3). *P<0.05
cells with intact p53 downstream pathways although
EHMES-10 cells were less sensitive to nutlin-3a despite
the wild-type p53 gene.
Combinatory effects of metformin and nutlin-3a
We selected 3 representative mesothelioma cells bearing
the wild-type p53 gene, MSTO-211H, NCI-H28 and
EHMES-10 cells, to examine possible combinatory effects of metformin and nutlin-3a (Fig. 3a). All the cells
were sensitive to metformin, while MSTO-211H and
NCI-H28 but not EHMES-10 cells were sensitive to
nutlin-3a. These data suggested that inhibition of mTOR
pathways and activation of the p53 downstream pathways
differentially produced cytotoxicity. We tested growth inhibitory actions with a low concentration of metformin
and various concentrations of nutlin-3a. Analyses with the
CalcuSyn software showed that combination of metformin
and nutlin-3a produced additive or synergistic growth
Shimazu et al. BMC Cancer (2017) 17:309
Page 5 of 14
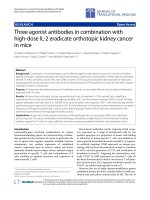
Fig. 2 Susceptibility of mesothelioma and immortalized mesothelial cells to nutlin-3a. Cells were treated with nutlin-3a at various concentrations
and the cell viabilities were measured with the WST assay. Relative viability was calculated based on uninfected cells. IC50 values were calculated
with CalcuSyn software. Averages and SE bars are shown (n=3)
suppressive effects at Fa points between 0.35 and 0.8 in
MSTO-211H and EHMES-10 cells, and between 0.2 and
0.6 in NCI-H28 cells (Fig. 3b). We also examined growth
kinetics by the combination (Fig. 3c). We tested the
growth retardation with a high metformin concentration
to ensure the growth suppression and with nutlin-3a at
10 μM, which was enough to suppress growth of MSTO211H and NCI-H28 cells but not EHMES-10 cells.
Growth inhibition by nutlin-3a was subsequently minimum in EHMES-10 cells, but a combinatory use of metformin and nutlin-3a induced growth suppression greater
than a single agent in all the cells including EHMES-10
cells. These data indicated that both agents produced
combinatory effects.
Involvement of p53 in metformin- and nutlin-3a-mediated
effects
We examined a role of p53 in metformin- and nutlin3a-induced growth inhibition with cells treated with
siRNA for p53 or control siRNA (Fig. 4). We firstly examined down-regulation of p53 expression in MSTO-211H
cells treated with siRNA and/or nutlin-3a (Fig. 4a). Expression of p53 was scarcely detectable in MSTO-211H
cells but was induced in nutlin-3a-treated cells. Treatments
with p53-siRNA suppressed nutlin-3a-mediated p53 expression completely, whereas a control siRNA minimally
influenced the p53 expression. These data indicated that
nutlin-3a augmented p53 expression and the expression
was depleted with p53-siRNA. Effects of metformin or
nutlin-3a were then examined under the siRNA-treated
condition (Fig. 4b). Down-regulation of p53 did not influence the susceptibility of any of the cells to metformin, indicating that the metformin-induced growth
suppression was independent of the p53 pathways. In
contrast, cytotoxicity of nutlin-3a was significantly reduced in MSTO-211H and NCI-H28 cells treated with
p53-siRNA but not with control siRNA. Susceptibility
of p53-siRNA-treated EHMES-10 cells to nutlin-3a
remained unchanged, indicating that the p53 pathways
was irrelevant to the growth suppression. The p53independent cytotoxicity was associated with insensitivity of EHMES-10 cells to nutlin-3a. We also examined
effects of nutlin-3a on p53 phosphorylation, which was a
marker of p53 activation (Fig. 5, Additional file 2: Figure
S1). Phosphorylation of p53 was induced in EHMES-10
cells as well as in MSTO-211H and NCI-H28 cells, indicating that the p53 pathways were also activated in
EHMES-10 cells. These data therefore showed that growth
Shimazu et al. BMC Cancer (2017) 17:309
Page 6 of 14
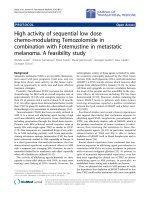
Fig. 3 Combinatory effects of metformin and nutlin-3a. a Cells were treated with metformin, nutlin-3a or metformin plus nutlin-3a as indicated.
Relative viability was calculated based on uninfected cells. Averages and SE bars are shown (n=3). b CI values in combination of metformin and
nutlin-3a were calculated with CalcuSyn software at various Fa points. c Cell numbers were counted with a trypan blue dye exclusion assay after
cells were treated with metformin, nutlin-3a or metformin plus nutlin-3a as indicated. Averages and SE bars are shown (n=3). *P<0.05
inhibitory effects produced by nutlin-3a in EHMES-10
cells were attributable to a p53-independent mechanism.
Cell cycle changes induced by metformin and nutlin-3a
We examined cell cycle progression of MSTO-211H,
NCI-H28 and EHMES-10 cells after treatments of metformin, nutlin-3a or metformin plus nutlin-3a. We investigated the effects with different concentrations, metformin
at 20 and 60 mM, and nutlin-3a at 10, 40 and 60 μM
depending on cells (Table 1, Additional file 3: Figure S2).
The cell cycle analyses showed that metformin at 20 mM
did not influence cell cycles although viability with the
WST assay was suppressed at the concentration. Metformin at 60 mM induced differential effects on cell cycle
progression patterns. MSTO-211H cells showed increased
sub-G1 fractions, whereas NCI-H28 cells and to a lesser
extent EHMES-10 cells increased G2/M populations.
Nutlin-3a also showed differential effects on cell cycle
Shimazu et al. BMC Cancer (2017) 17:309
Page 7 of 14
Fig. 4 Involvement of p53 in metformin- and nutlin-3a-mediated cytotoxicity. a Western blot analysis to analyze p53 down-regulation. MSTO-211H
cells treated with either p53-siRNA or control siRNA were incubated with nutlin-2a for 24 h. GAPDH expression was used as a loading control. b Cells
were treated with p53-siRNA or control siRNA, and susceptibility to metformin or nutlin-3a was examined with the WST assay. Relative viability was
calculated based on untreated cells. Averages and SE bars are shown (n=3)
Fig. 5 Western blot analyses with cells treated with metformin and/or nutlin-3a. Cells were treated with metformin, nutlin-3a, DMSO as a solvent
control, or metformin pulse nutlin-3a at the indicated concentrations for 24 and 48 h. Cell lysates were probed with antibody as indicated. GAPDH
was used as a loading control
Shimazu et al. BMC Cancer (2017) 17:309
Page 8 of 14
Table 1 Cell cycle changes caused by metformin and/or nutlin-3a
Cells
MSTO-211H
Time (hrs)
24
48
72
NCI-H28
24
48
72
Treatment
(-)
Cell cycle distribution (%)(Average ± SE)
Sub-G1
G1
S
G2/M
4.35 ± 0.22
56.30 ± 0.35
17.93 ± 0.04
20.88 ± 0.44
Met 20mM
5.43 ± 0.23
68.82 ± 0.25
12.91 ± 0.22
12.39 ± 0.23
Met 60 mM
10.92 ± 0.63
63.25 ± 1.75
4.71 ± 0.16
20.88 ± 2.13
Nut 10 μM
5.95 ± 0.11
84.18 ± 0.43
2.35 ± 0.16
7.32 ± 0.23
Met 20mM
+ Nut 10 μM
7.39 ± 0.14
72.91 ± 0.29
3.00 ± 0.14
16.23 ± 0.29
Met 60 mM
+ Nut 10 μM
10.56 ± 1.42
61.41 ± 1.50
7.93 ± 0.69
19.71 ± 0.71
(-)
0.76 ± 0.03
68.87 ± 0.65
12.70 ± 0.59
17.31 ± 0.20
Met 20mM
3.40 ± 0.06
70.64 ± 0.26
11.96 ± 0.06
13.43 ± 0.21
Met 60 mM
7.44 ± 0.12*
68.10 ± 0.30
5.29 ± 0.08
18.84 ± 0.13
Nut 10 μM
6.11 ± 0.22*
85.90 ± 0.25
1.89 ± 0.03
5.92 ± 0.13
Met 20mM
+ Nut 10 μM
6.51 ± 0.16
76.44 ± 0.24
2.82 ± 0.08
13.87 ± 0.18
Met 60 mM
+ Nut 10 μM
11.34 ± 0.22*
63.25 ± 0.24
2.97 ± 0.04
22.25 ± 0.22
(-)
1.15 ± 0.11
82.29 ± 0.39
4.04 ± 0.17
12.26 ± 0.18
Met 20mM
3.08 ± 0.09
76.19 ± 0.21
8.07 ± 0.14
12.25 ± 0.42
Met 60 mM
13.28 ± 0.27*
65.29 ± 1.07
4.99 ± 0.10
16.24 ± 0.71
Nut 10 μM
11.38 ± 0.14*
81.30 ± 0.28
1.88 ± 0.10
5.29 ± 0.13
Met 20mM
+ Nut 10 μM
7.39 ± 0.15
75.38 ± 0.21
2.63 ± 0.06
14.26 ± 0.23
Met 60 mM
+ Nut 10 μM
36.25 ± 0.44*
44.02 ± 0.25
3.28 ± 0.06
16.15 ± 0.26
(-)
0.47 ± 0.04
60.27 ± 0.19
16.66 ± 0.34
22.06 ± 0.25
Met 20mM
0.43 ± 0.02
67.39 ± 0.41
11.76 ± 0.29
19.66 ± 0.13
Met 60 mM
0.89 ± 0.08
44.81 ± 0.07
15.01 ± 0.17
38.33 ± 0.17
Nut 10 μM
0.77 ± 0.02
40.63 ± 0.20
9.25 ± 0.42
47.61 ± 0.36
Nut 40 μM
1.22 ± 0.07
44.87 ± 0.57
15.17 ± 0.57
37.12 ± 0.65
Met 20mM
+ Nut 10 μM
1.25 ± 0.04
42.33 ± 0.36
13.30 ± 0.38
41.28 ± 0.06
Met 60 mM
+ Nut 40 μM
1.24 ± 0.15
48.20 ± 0.37
20.92 ± 0.17
28.35 ± 0.38
(-)
1.54 ± 0.05
60.08 ± 0.39
16.04 ± 0.36
21.88 ± 0.01
Met 20mM
0.45 ± 0.04
73.97 ± 0.18
6.35 ± 0.05
18.66 ± 0.10
Met 60 mM
1.06 ± 0.10
40.68 ± 0.08
14.65 ± 0.19
42.61 ± 0.19
Nut 10 μM
3.84 ± 0.10
43.82 ± 0.29
8.28 ± 0.20
42.47 ± 0.26
Nut 40 μM
2.50 ± 0.10
49.77 ± 0.22
10.35 ± 0.10
36.08 ± 0.21
Met 20mM
+ Nut 10 μM
0.91 ± 0.09
46.45 ± 0.74
9.23 ± 0.29
41.90 ± 0.90
Met 60 mM
+ Nut 40 μM
1.38 ± 0.12
49.24 ± 0.21
20.16 ± 0.30
27.63 ± 0.15
(-)
1.49 ± 0.02
64.68 ± 0.34
15.58 ± 0.03
17.79 ± 0.30
Met 20mM
0.52 ± 0.09
75.59 ± 0.14
4.52 ± 0.08
18.86 ± 0.21
Met 60 mM
1.50 ± 0.31
41.66 ± 0.37
15.31 ± 0.03
40.59 ± 0.27
Nut 10 μM
6.09 ± 0.20
43.98 ± 0.25
8.75 ± 0.23
39.57 ± 0.41
Nut 40 μM
8.96 ± 0.83
61.92 ± 0.79
7.31 ± 0.02
21.05 ± 0.49
Shimazu et al. BMC Cancer (2017) 17:309
Page 9 of 14
Table 1 Cell cycle changes caused by metformin and/or nutlin-3a (Continued)
EHMES-10
24
48
72
Met 20mM
+ Nut 10 μM
1.01 ± 0.28
46.14 ± 0.66
9.14 ± 0.11
42.20 ± 0.41
Met 60 mM
+ Nut 40 μM
9.00 ± 0.72
44.61 ± 0.43
15.83 ± 0.25
29.48 ± 0.45
(-)
0.46 ± 0.05
70.86 ± 0.69
9.64 ± 0.3
18.63 ± 0.57
Met 20mM
1.04 ± 0.06
73.58 ± 0.31
8.78 ± 0.05
16.18 ± 0.32
Met 60 mM
1.61 ± 0.06
67.93 ± 0.31
6.95 ± 0.14
23.13 ± 0.28
Nut 20 μM
1.19 ± 0.10
73.47 ± 0.21
10.38 ± 0.26
14.38 ± 0.29
Nut 60 μM
1.19 ± 0.08
80.17 ± 0.16
3.49 ± 0.06
14.74 ± 0.05
Met 20mM
+ Nut 20 μM
0.85 ± 0.02
76.79 ± 0.23
7.35 ± 0.09
14.61 ± 0.19
Met 60 mM
+ Nut 60 μM
2.37 ± 0.19
73.06 ± 0.38
5.2 ± 0.38
18.93 ± 0.32
(-)
0.92 ± 0.04
73.14 ± 0.06
10.34 ± 0.23
15.22 ± 0.35
Met 20mM
1.46 ± 0.13
61.87 ± 0.16
13.00 ± 0.12
23.04 ± 0.21
Met 60 mM
2.67 ± 0.12*
66.72 ± 0.12
9.32 ± 0.11
20.73 ± 0.13
Nut 20 μM
1.62 ± 0.20
67.78 ± 0.21
12.12 ± 0.17
18.02 ± 0.17
Nut 60 μM
1.85 ± 0.16*
84.44 ± 0.12
3.32 ± 0.05
10.15 ± 0.06
Met 20mM
+ Nut 20 μM
1.35 ± 0.04
66.71 ± 0.35
13.01 ± 0.32
18.19 ± 0.42
Met 60 mM
+ Nut 60 μM
4.57 ± 0.17*
74.63 ± 0.17
5.44 ± 0.16
15.11 ± 0.2
(-)
2.18 ± 0.55
56.86 ± 0.62
12.2 ± 0.75
27.79 ± 1.57
Met 20mM
1.89 ± 0.11
63.77 ± 0.19
11.90 ± 0.21
21.64 ± 0.42
Met 60 mM
3.07 ± 0.14*
64.22 ± 0.13
8.22 ± 0.12
23.99 ± 0.22
Nut 20 μM
0.73 ± 0.03
67.46 ± 0.28
11.05 ± 0.19
20.22 ± 0.39
Nut 60 μM
3.47 ± 0.11*
84.27 ± 0.25
3.4 ± 0.17
8.74 ± 0.07
Met 20mM
+ Nut 20 μM
1.27 ± 0.03
70.85 ± 0.23
9.44 ± 0.43
17.85 ± 0.19
Met 60 mM
+ Nut 60 μM
13.85 ± 0.86*
62.12 ± 0.26
6.35 ± 0.25
17.57 ± 0.86
*P < 0.05, compared between combination and either metformin or nutlin-3a single treatment. N = 3
Met Metformin, Nut Nutlin-3a
progressions. MSTO-211H cells, sensitive to nutlin-3a,
were tested at 10 μM, and NCI-H28 cells were also treated
at 40 μM. MSTO-211H cells increased G1 and decreased
S-phase fractions, whereas NCI-H28 cells increased G2/M
populations at both 10 and 40 μM. Augmented sub-G1
fractions followed thereafter in both cells. Cell cycle patterns of EHMES-10 cells were not influenced at 10 μM
since the cells were insensitive to the dose of nutlin-3a,
but showed increased G1 with decreased S-phase populations at 60 μM.
A combinatory use of metformin at 20 mM and
nutlin-3a at 10 μM did not influence the cell cycle in any
of the cells. We therefore increased metformin concentration at 60 mM. Combination of metformin and nutlin-3a
at 10 μM increased sub-G1 populations in MSTO-211H
cells, and that of metformin with nutlin-3a at 60 μM also
augmented sub-G1 fractions in EHMES-10 cells. The
increased sub-G1 fraction was greater than that caused by
single agent alone. In contrast, cell cycle changes by the
combination with 40 μM of nutlin-3a in NCI-H28 cells
remained the same as those by nutlin-3a alone, and metformin did not influence cell cycle patterns in the combination. Cell cycle changes were thus differentially induced
in the cells tested. MSTO-211H cells were prone to be
arrested at G1 phase followed by increased sub-G1 populations, while NCI-H28 cells were likely to be arrested at
G2/M phase. In contrast, EHMES-10 cells showed complex results in cell cycle progressions.
Differential influence of metformin and nutlin-3a on
signal pathways
We investigated molecular events in cells treated with metformin, nutlin-3a or the combination and analyzed a possible involvement of the mTOR and the p53 downstream
Shimazu et al. BMC Cancer (2017) 17:309
pathways (Fig. 5). The agent concentrations for Western
blot analyses were similar to those used for cell cycle
analyses except nutlin-3a at 20 μM in MSTO-211H
cells because the concentration induced p53 expression
in the cells and the induction was blocked by siRNA for
p53 (Fig. 4a). Metformin treatments induced different responses on the AMPK/mTOR-mediated pathways. MSTO211H cells treated with metformin down-regulated AMPK,
4E–BP1, REDD1 and to a lesser extent p70S6K levels, and
subsequently phosphorylated AMPK, 4E–BP1 and p70S6K
levels decreased. These data indicated that metformin suppressed the mTOR pathways in an AMPK- and a REDD1independent manners. In contrast, NCI-H28 cells treated
with metformin dephosphorylated 4E–BP1 and p70S6K
despite unchanged AMPK phosphorylation levels, suggesting that metformin suppressed the mTOR pathways without augmenting the AMPK activity. EHMES-10 cells
treated with metformin showed increased phosphorylated
AMPK and down-regulated 4E–BP1 phosphorylation,
indicating that suppression of the mTOR pathways was
associated with AMPK activation. These data showed
that metformin induced mTOR inhibition but involvement of AMPK was inconsistent among the cells. We
further examined apoptosis and autophagy pathways in
metformin-treated cells. MSTO-211H cells showed
down-regulation of Bax, Atg-5 and Beclin-1 expression
levels but cleavage of caspase-3 was not induced. NCI-H28
showed slight increase of Bax and decrease of Atg-5 without caspase-3 cleavage, and EHMES-10 cells did not show
any changes in expressions of molecules associated with
apoptosis or autophagy compared with solvent-treated cells
as a control. Expression of p53 was minimally increased in
NCI-H28 cells but remained unchanged in MSTO-211H
and EHMES-10 cells. Moreover, phosphorylation of p53
was not induced in any of the cells. These analysis indicated
that both apoptosis and autophagy did not play a major role
in metformin-induced growth suppression and that inhibited mTOR pathways scarcely influenced p53 levels and the
downstream.
Nutlin-3a augmented p53 and the phosphorylation
levels in all the cells although the induction levels were
different among the cells. Cleaved caspase-3 levels were
induced in MSTO-211H and to a lesser extent in NCIH28 cells but not in EHMES-10 cells. The differential
cleavage may be linked with p53 induction levels. Bax
expression was up-regulated only in NCI-H28 cells.
Conversion from LC3A/B I to LC3A/B II was detected
in nutlin-3a-treated NCI-H28 and EHMES-10 cells but
not in MSTO-211H cells. Beclin-1 was minimally upregulated in EHMES-10 cells but not in other cells, and
up-regulated Atg-5 expression was not detected in all the
cells. These data consequently indicated that nutlin-3a
augmented apoptosis through p53 in MSTO-211H cells
but enhanced autophagy in EHMES-10 cells. In contrast,
Page 10 of 14
NCI-H28 cells to a lesser extent showed activation of both
apoptosis and autophagy. Nutlin-3a up-regulated AMPK
phosphorylation and decreased phosphorylation levels of
4E–BP1 and p70S6K in MSTO-211H and to a lesser extent
in NCI-H28 cells, whereas EHMES-10 cells did not show
any changes in these phosphorylation levels. Expression of
REDD-1 decreased in MSTO-211H cells at 24 h but the expression in NCI-211H and EHMES-10 cells was minimally
changed. These data collectively showed that nutlin-3a
augmented p53-mediated apoptosis in MESO-211H
and NCI-H28 cells, and autophagy was also involved in
NCI-H28 and EHMES-10 cells. Up-regulated p53 expression thus inhibited the mTOR pathways in nutlin3a-sensitive cells.
Combination of metformin and nutlin-3a decreased
apoptotic pathways in MSTO-211H cells. The combination decreased p53 and the phosphorylation levels and
consequently cleavage caspase-3 levels were downregulated. Expression of Bax, Bcl-2, Atg-5 and Bclin-1
levels in MSTO-211H cells were minimally changed and
the expression levels were almost similar to those at
between metformin- and nutlin-3a-treated cells. The
combination down-regulated levels of AMPK, phosphorylated AMPK, phosphorylated 4E–BP-1, p70S6K
and phosphorylated p70S6K and the levels were also
comparable to those in metformin-treated cells. These
data suggested that metformin suppressed nutlin-3amediated effects in MSTO-211H cells. In contrast,
NCI-H28 cells showed further increase of p53 phosphorylation, cleaved caspase-3 and Bcl-2 levels with the combination, but the levels of Atg-5 and to a lesser degree LC3A/
B increased compared with nutlin-3a-treated cells. The
combination also augmented REDD1 expression and
phosphorylation of 4E–BP1 and p70S6K, but downregulated phosphorylation levels of AMPK, indicating
that the mTOR pathways rather activated in NCI-H28
cells despite of enhanced apoptosis and autophagy signaling. EHMES-10 cells treated with the combination
increased cleavage of caspas-3 and Bax but p53 phosphorylation levels remained unchanged. Beclin-1 expression levels
decreased but a ratio between LC3A/B I and LC3A/B II
was not different from that of nutlin-3a-treated cells. As for
the mTOR pathways, the phosphorylated 4E–BP1 level in
the combination was similar to that of between metformintreated and nutlin-3a-treated cells. Furthermore, REDD1
expression increased in the combinatory treatments, and
phosphorylated AMPK levels were slightly down-regulated
in EHMES-10 cells. These data showed that the combination induced apoptosis without further p53 activation and
suppressed the mTOR pathways through an augmented
REDD1 level despite down-regulated AMPK actions. These
molecular analyses collectively suggested that growth
inhibition produced by the combination was attributable
to multiple mechanisms including apoptosis, autophagy,
Shimazu et al. BMC Cancer (2017) 17:309
and machinery irrelevant to apoptosis or autophagy. Metformin also influenced negatively or positively the p53
pathways, suppressed the pathways in MSTO-211H cells
but augmented in NCI-H28 and EHMES-10 cells.
Discussion
We showed in the present study that metformin suppressed growth of mesothelioma in a p53-independent
manner and firstly reported to our knowledge that a
combinatory use of metformin and nutlin-3a produced
additive or synergistic inhibitory effects. The mechanism
underlying the metformin- and combination-mediated
growth suppression was complex and non-AMPK/mTOR
pathways were also involved. Moreover, nutlin-3a-mediated
augmentation of p53 inhibited the mTOR pathways but
metformin did not influence p53 levels without nutlin-3a.
Nevertheless, metformin affected p53 activation either positively or negatively under nutlin-3a treatments.
Metformin produced cytotoxic effects on human tumors and multiple mechanisms were involved in the
anti-tumor activities [4]. We used mesothelioma and immortalized cells of a mesothelium origin, and examined
the metformin-induced growth suppression in terms of
the p53 genotype. The suppressive activity was not associated with the p53 status or with functionality of the
p53 downstream pathways in contrast to nutlin-3a.
Moreover, down-regulated p53 with siRNA but did not
influence metformin-mediated suppression. Metformin
scarcely modulated p53 and the phosphorylated p53,
and apoptosis as well as autophagy were not involved in
the growth inhibition. Cell cycle progression patterns
under the non-apoptosis and non-autophagy conditions
showed either increased sub-G1 or G2/M fractions
depending on cells tested.
We showed that metformin-induced suppression of cell
viability was attributable to multiple systems. Previous
studies demonstrated at least 4 mechanisms responsible
for the suppression, (A) activation of AMPK with downregulated mTOR actions [4, 5], (B) suppression of the
mTOR complex 1 activities through augmented REDD1mediated pathways without an AMPK involvement [24],
(C) inhibition of the Stat3/Bcl-2 signal [25], and (D)
modulation of miRNAs which includes augmented
miRNA let7A and down-regulated miRNA 181 [26].
Metformin-treated MSTO-211H cells showed decreased
phosphorylation of mTOR downstream molecules
without enhanced AMPK phosphorylation, suggesting
the (B) mechanism with little involvement of apoptosis
or autophagy-mediated pathways. Decreased AMPK
phosphorylation did not however deny an involvement
of AMPK in the metformin-mediated suppression. We
in fact found that an AMPK inhibitor, compound C,
negated the metformin effects, which indicated that
AMPK activation played a role in the suppression
Page 11 of 14
(Additional file 4: Figure S3). Moreover, metformin
also down-regulated REDD1 expression, which suggested
that regulation of the mTOR pathways was balanced
between AMPK and REDD1 pathways in MSTO-211H
cells. In contrast, metformin-treated NCI-H28 cells decreased phosphorylation of the mTOR downstream molecules without AMPK or REDD1 activations, indicating
mTOR regulations bypassing the AMPK and the REDD1
pathways. EHMES-10 cells treated with metformin inhibited mTOR pathways through AMPK activation as listed
in the (A) mechanism. We detected little changes of Bcl-2
expression levels and the mechanism (C) was not involved
in mesothelioma tested. These data collectively indicated
that metformin suppressed mTOR downstream pathways
with a differential involvement of AMPK and REDD1
molecules. A possible involvement of p53-mediated apoptosis was scarcely detected in all the cells tested and
autophagy might minimally contribute to the growth inhibition in MSTO-211H cells. These data together with
the p53-siRNA treatments indicated that metformin did
not influence the p53 pathways and cell cycle changes induced by metformin were independent of the pathways.
A mechanism of nutlin-3a-mediated growth inhibition
was less complex than that of metformin. Nutlin-3a
phosphorylated p53 in all the cells tested, and induced
apoptosis at different levels and to some extent autophagy.
Moreover, augmentation of p53 by nutlin-3a induced inhibition of the mTOR pathways, which was evidenced by
dephosphorylation of 4E–BP1 and p70S6K. In contrast,
EHMES-10 cells were susceptible to nutlin-3a only at a
high concentration, and induced the LC3A/B conversion
without caspase-3 cleavages under the condition. These
data suggested a possible involvement of autophagy as an
off-target effect of nutlin-3a. In addition, EHMES-10 cells
did not improve sensitivity to nutlin-3a in a p53-siRNA
treatment. Interestingly, a recent study demonstrated that
nutlin-3a induced autophagy in p53 wild-type cells, and
activation of AMPK was involved in the cell death [27].
We observed the same mechanism operating in nutlin-3atreated NCI-H28 cells. EHMES-10 cells however did not
show any changes in the AMPK/mTOR systems, which
further suggested an AMPK-independent autophagy induced by nutlin-3a.
Combination of metformin and nutlin-3a produced
additive or synergistic effects detected with the WST and
the dye exclusion test. MSTO-211H cells treated with both
agents showed enhanced sub-G1 fractions but the mechanism underlying the cytotoxicity, in the context of the
AMPK/mTOR pathways and the p53 activation, seemed to
be similar to that in the metformin-treated case. Nutlin-3a
alone augmented mTOR inhibition in MSTO-211H cells
but the combination with metformin did not further
suppress the mTOR pathways. Furthermore, metformin
rather down-regulated nutlin-3a-induced effects. These
Shimazu et al. BMC Cancer (2017) 17:309
data collectively indicated that increased cell death in
the combination was not associated with apoptosis or
inhibited mTOR pathways. The combinatory effects
were therefore not due to just augmentation of the
metformin-induced signal pathways, but an additional
undefined mechanism should be involved. NCI-H28
and EHMES-10 cells augmented caspase-3 cleavage levels
in the combination. In contrast, cell cycle analyses showed
increased sub-G1 populations in EHMES-10 cells but not
in NCI-H28 cells. NCI-H28 cells treated with both agents
increased conversion of LC3A/B which was accompanied
by autophagy, and augmented Bcl-2 expression which
might block apoptosis. These data suggested that NCI-H28
cells were subjected to autophagy rather than apoptosis.
Metformin in fact decreased Atg-5 levels but the combination with nutlin-3a restored the levels. We also found that
the down-regulated Atg-5 was irrelevant to AMPK activation since an AMPK activator, A769662, did not influence
the Atg-5 expression (Additional file 5: Figure S4A). In
contrast, EHMES-10 cells treated with the combination
did not show further conversion of LC3A/B or Bcl-2
up-regulation but augmented Bax expression, which indicated that EHMES-10 cells were prone to be apoptotic.
The dissimilar ratios of sub-G1 fraction between NCI-H28
and EHMES-10 cells can therefore be attributable to the
differential cell death mechanisms. Influence on the
AMPK/mTOR pathways could also bring the dissimilar
results between NCI-H28 and EHMES-10 cells. Both cells
augmented REDD1 expression levels and down-regulated
phosphorylated AMPK levels in the combination, but
phosphorylated 4E–BP1 and p70S6K levels, mapped in
the mTOR pathways, were rather up-regulated in NCIH28 cells. In contrast, EHMES-10 cells did not show such
up-regulated mTOR pathways. These data collectively
suggested that the combinatory effects was attributable to
enhanced apoptotic and/or non-apoptotic pathways, and
contribution of the mTOR pathways to the effects was inconsistent. We also found that AMPK activation itself
might not directly contribute to the combinatory effects
with nutlin-3a in NCI-H28 cells (Additional file 5: Figure
S4B, Additional file 6: Table S2), which could be associated with up-regulated mTOR downstream pathways and
further indicated complexity of mechanism regarding the
combinatory effects.
Mesothelioma has another frequent genetic alternations,
mutations of NF2 and those of the downstream genes
found in about 50% of the clinical specimens [28]. The loss
of functions caused by these mutation led to activation of
the Hippo pathway, and the activation augmented the
mTOR downstream pathways [29]. A combinatory use of
metformin and nutlin-3a in mesothelioma therefore affects
a possible cross-talk between the p53 and the Hippo pathways. The present analyses of the AMPK pathways after
nutrin-3a treatments in the p53 wild-type cells revealed the
Page 12 of 14
cross-talk under no metabolic and genotoxic stresses. We
showed that nutlin-3a-mediated p53 up-regulation activated the AMPK pathways and inhibited the mTOR pathways in MSTO-211 and NCI-H28 cells, whereas activation
of AMPK did not directly enhance p53 levels in NCI-H28
cells (Additional file 5: Figure S4A). On the other hand,
EHMES-10 cells treated with nutlin-3a did not activate the
AMPK and failed to cleave caspase-3. Furthermore, metformin negated nutlin-3a-induced activation of p53 and the
AMPK pathways, and induced non-apoptotic pathways in
MSTO-211H cells. The combinatory effects in NCI-H28
and EHMES-10 cells were however primarily produced by
enhanced apoptosis. These data indicated that metformin
produced bivalent actions on the p53 pathways, inhibition
as observed in MSTO-211H cells and augmentation in
NCI-H28 and EHMES-10 cells. Recently, Cho et al.
showed that decreased NF2 expression further downregulated p53 levels through Snail in mesothelioma,
and an inhibitor for Snail restored the p53 levels [30].
Combination of an mTOR inhibitor and an agent to
augment p53 levels is therefore a suitable therapeutic
strategy for mesothelioma with the NF2 mutation and
loss of p53 functions. Previous studies also showed that
metformin up-regulated p53 levels through inhibited
mTOR pathways and augmentation of p53 suppressed
the mTOR activity [31]. The present study demonstrated
that metformin did not influence p53 levels but activated
the p53 pathways in combination with nutlin-3a. Furthermore, we showed that p53 up-regulation by nutlin-3a
inhibited mTOR pathways although these effects were
dependent on cells tested. The current study indicated a
possible cross-talk between the p53 activation and the
AMPK/mTOR pathways. Nevertheless, the cross-talk did
not produce consistent outcomes as demonstrated in
MSTO-211H cells, which could be attributable to differential genetic backgrounds among tumor cells used.
Variable expression levels of respective molecules in
the p53 and AMPK/mTOR pathways and their differential
functional roles in the cell death can also contribute to the
divergent outcomes.
Conclusions
In conclusions, we examined cytotoxicity of metformin and
nutlin-3a with a panel of mesothelioma and demonstrated
that both agents produced combinatory effects on cell
growth. A mechanism of the combination was however
different among the cells tested probably due to heterogeneity of mesothelioma. Nevertheless, the present
study suggest that a combinatory use of an inhibitor for
mTOR and a p53-activating agent targets mesothelioma
with characteristic genetic alterations and is a new therapeutic regimen. Metformin is now clinically in use and
some of the MDM2-p53 inhibitors are under clinical trials,
Shimazu et al. BMC Cancer (2017) 17:309
Page 13 of 14
which indicates feasibility of the combination in mesothelioma treatments.
employment, consultancy, patents or products in development or marketed
products to the company. All the authors agree to publish the data included
in the manuscript.
Additional files
Consent for publication
Not applicable.
Additional file 1: Table S1. Sensitivity of mesothelioma cells to agents.
(DOCX 15 kb)
Additional file 2: Figure S1. Expression of p53 and MDM2 in
mesothelioma cells treated with nutlin-3a. Cells were treated with
nutlin-3a as indicated and were probed with antibody against p53
(Ab-6, Clone DO-1) (Thermo Fisher Scientific), phosphorylated p53 (Ser
15) (#9284) (Cell Signaling), MDM2 (sc-965) (Santa Cruz Biotechnology)
and GAPDH (ab9484) (Abcam) as a loading control. (PDF 125 kb)
Additional file 3: Figure S2. Cell cycle changes caused by metformin
and/or nutlin-3a. Cells were treated with metformin and nutlin-3a as indicated,
and analyzed for the cell cycle with a flow cytometry. (PDF 138 kb)
Additional file 4: Figure S3. AMPK inhibition blocked metforminmediated suppression. MSTO-211H cells were treated with metformin
and compound C as indicated for 4 days and relative cell viability was
examined with the WST assay. Viability of cells treated with metformin
at 5 mM but without compound C (A) and that without metformin or
compound C (B) were shown as 100%. Averages and SEs are shown
(n = 3). (PDF 72 kb)
Additional file 5: Figure S4. (A) AMPK activation was irrelevant to Atg-5
and p53 expression. NCI-H28 cells treated with A769662, an AMPK activator,
did not influence Atg-5, p53 or phosphorylated p53 levels. (B) An AMPK
activator did not produce synergistic combinatory effects with nutlin-3a.
NCI-H28 cells were treated with A769662 and nutlin-3a as indicated for
4 days and relative cell viability was examined with the WST assay. Averages
and SEs are shown (n = 3). (PDF 106 kb)
Additional file 6: Table S2. Combination Index by nutlin-3a and
A769662. (DOCX 14 kb)
Abbreviations
AMPK: AMP-activated protein kinase; CI: Combination index; DMSO: Dimethyl
sulfoxide; Fa: Fractions affected; GAPDH: Glyceraldehyde-3-phosphate
dehydrogenase; IC50: Half maximal inhibitory concentration; mTOR: Mammalian
target of rapamycin; REDD1: Regulated in development and DNA damage
responses 1; siRNA: Small interfering RNA
Acknowledgments
Not applicable.
Funding
This study was supported by Grants-in-Aid for Scientific Research from
Japan Society for the Promotion of Science (KAKENHI: 26,462,000, 26,461,183,
16 K09598), the Grant-in-Aid for Research on seeds for Publicly Essential Drugs
and Medical Devices from the Ministry of Health, Labor and Welfare of Japan,
and a Grant-in-aid from the Nichias Corporation. These funding bodies have not
participated in the design of the study, collection, analysis, interpretation of data,
or writing of the manuscript.
Availability of supporting data and materials
All the data and materials are available upon the requests.
Authors’ contributions
KS, YT, TM and MS conducted all the experiments, IS, HS and TN analyzed
the data, KH, KT and MT organized the experimental designs, and KS and MT
prepared the manuscript. All authors read and approved the final manuscript.
Competing interests
The authors declare that they have no competing interests. We obtained a
grant from Nichias Corporation. It is not a pharmaceutical company but a
company making industrial products for building, automobiles and pipes
(see The grant is as a kind of their mécénat
activities, corporate social contributions, which is aimed to assist for medical
research for intractable cancer treatments. We are thereby irrelevant to any
Ethical approval and consent to participate
This article does not contain any studies dealing with human specimens but
contains studies with cell lines in vitro. JMN-1B, EHMES-1 and EHMES-10 cells
were established from Japanese patients (deceased) in the Ehime University,
Japan, and detailed properties of the cells have been published [21]. The cell
line was provided by the original establisher and an ethical approval is not
required for the use. This article does not contain any studies with animals
performed by any of the authors.
Publisher’s Note
Springer Nature remains neutral with regard to jurisdictional claims in
published maps and institutional affiliations.
Author details
1
Department of Respirology, Graduate School of Medicine, Chiba University,
1-8-1 Inohana, Chuo-ku, Chiba 260-8670, Japan. 2Division of Pathology and
Cell Therapy, Chiba Cancer Center Research Institute, 666-2 Nitona, Chuo-ku,
Chiba 260-8717, Japan. 3Department of Japanese-Oriental Medicine,
Graduate School of Medicine, Chiba University, 1-8-1 Inohana, Chuo-ku,
Chiba 260-8670, Japan. 4Division of Respirology, Chiba Cancer Center, 666-2
Nitona, Chuo-ku, Chiba, Chiba 260-8717, Japan. 5Department of Medical
Oncology, Faculty of Medicine, University of Tsukuba, Tennodai 1-1-1, Ibaragi,
Tsukuba 305-8575, Japan. 6Department of Surgery, School of Medicine, Toho
University, 6-11-1 Oomori-nishi, Oota-ku, Tokyo 143-8541, Japan.
7
Department of Pathology, Tokyo Women’s Medical University Yachiyo
Medical Center, 477-96 Ohwadashinden, Yachiyo, Chiba 276-8524, Japan.
8
Department of Molecular Biology and Oncology, Graduate School of
Medicine, Chiba University, 1-8-1 Inohana, Chuo-ku, Chiba 260-8670, Japan.
Received: 20 August 2016 Accepted: 25 April 2017
References
1. Robinson BW, Musk AW, Lake RA. Malignant mesothelioma. Lancet. 2005;
366:397–408.
2. Vogelzang NJ, Rusthoven JJ, Symanowski J, Denham C, Kaukel E, et al.
Phase III study of pemetrexed in combination with cisplatin versus
cisplatin alone in patients with malignant pleural mesothelioma. J Clin
Oncol. 2003;21:2636–44.
3. Tada Y, Suzuki T, Shimada H, Hiroshima K, Tatsumi K, Tagawa M. Moleculartargeted therapy for malignant mesothelioma. Pleura. 2015:1–11.
4. Pierotti MA, Berrino F, Gariboldi M, Melani C, Mogavero A, Negri T,
Pasanisi P, Pilotti S. Targeting metabolism for cancer treatment and
prevention: metformin, an old drug with multi-faceted effects. Oncogene.
2013;32:1475–87.
5. Kasznicki J, Sliwinska A, Drzewoski J. Metformin in cancer prevention and
therapy. Ann Transl Med. 2014;2:57.
6. Salvadori M. Antineoplastic effects of mammalian target of rapamycine
inhibitors. World J Transplant. 2012;2:74–83.
7. Houghton. Everolimus. Clin Cancer Res. 2010;16:1368–72.
8. Ellard SL, Clemons M, Gelmon KA, Norris B, Kennecke H, Chia S, Pritchard K,
Eisen A, Vandenberg T, Taylor M, Sauerbrei E, Mishaeli M, Huntsman D,
Walsh W, Olivo M, McIntosh L, Seymour L. Randomized phase II study
comparing two schedules of everolimus in patients with recurrent/
metastatic breast cancer: NCIC Clinical Trials Group IND.163. J Clin Oncol.
2009;27:4536–41.
9. Cedrés S, Montero MA, Martinez P, Martinez A, Rodríguez-Freixinós V,
Torrejon D, Gabaldon A, Salcedo M, Ramon Y, Cajal S, Felip E. Exploratory
analysis of activation of PTEN-PI3K pathway and downstream proteins in
malignant pleural mesothelioma (MPM). Lung Cancer. 2012;77:192–8.
10. Guo Y, Chirieac LR, Bueno R, Pass H, Wu W, Malinowska IA, Kwiatkowski DJ.
Tsc1-Tp53 loss induces mesothelioma in mice, and evidence for this
mechanism in human mesothelioma. Oncogene. 2014;33:3151–60.
Shimazu et al. BMC Cancer (2017) 17:309
11. Bitanihirwe BK, Meerang M, Friess M, Soltermann A, Frischknecht L, Thies S,
Felley-Bosco E, Tsao MS, Allo G, de Perrot M, Seifert B, Moch H, Stahel R,
Weder W, Opitz I. PI3K/mTOR signaling in mesothelioma patients treated
with induction chemotherapy followed by extrapleural pneumonectomy.
J Thorac Oncol. 2014;9:239–47.
12. Lee AY, Raz DJ, He B, Jablons DM. Update on the molecular biology of
malignant mesothelioma. Cancer. 2007;109:1454–61.
13. Tovar C, Rosinski J, Filipovic Z, Higgins B, Kolinsky K, Hilton H, Zhao X, Vu BT,
Qing W, Packman K, Myklebost O, Heimbrook DC, Vassilev LT. Smallmolecule MDM2 antagonists reveal aberrant p53 signaling in cancer:
implications for therapy. Proc Natl Acad Sci U S A. 2006;103:1888–93.
14. Villalonga-Planells R, Coll-Mulet L, Martínez-Soler F, Castaño E, Acebes JJ,
Giménez-Bonafé P, Gil J, Tortosa A. Activation of p53 by nutlin-3a induces
apoptosis and cellular senescence in human glioblastoma multiforme.
PLoS One. 2011;6:e18588.
15. Pishas KI, Al-Ejeh F, Zinonos I, Kumar R, Evdokiou A, Brown MP, Callen DF,
Neilsen PM. Nutlin-3a is a potential therapeutic for ewing sarcoma. Clin
Cancer Res. 2011;17:494–504.
16. Li Q, Kawamura K, Okamoto S, Yamanaka M, Yang S, Yamauchi S, Fukamachi
T, Kobayashi H, Tada Y, Takiguchi Y, Tatsumi K, Shimada H, Hiroshima K,
Tagawa M. Upregulated p53 expression activates apoptotic pathways in
wild-type p53-bearing mesothelioma and enhances cytotoxicity of cisplatin
and pemetrexed. Cancer Gene Ther. 2012;19:218–28.
17. Feng Z, Zhang H, Levine AJ, Jin S. The coordinate regulation of the p53 and
mTOR pathways in cells. Proc Natl Acad Sci U S A. 2005;102:8204–9.
18. Jones RG, Plas DR, Kubek S, Buzzai M, Mu J, Xu Y, Birnbaum MJ, Thompson
CB. AMP-activated protein kinase induces a p53-dependent metabolic
checkpoint. Mol Cell. 2005;18:283–93.
19. Budanov AV, Karin M. p53 target genes sestrin1 and sestrin2 connect
genotoxic stress and mTOR signaling. Cell. 2008;134:451–60.
20. Apontes P, Leontieva OV, Demidenko ZN, Li F, Blagosklonny MV. Exploring
long-term protection of normal human fibroblasts and epithelial cells from
chemotherapy in cell culture. Oncotarget. 2011;2:222–33.
21. Nakataki E, Yano S, Matsumori Y, Goto H, Kakiuchi S, Muguruma H, Bando Y,
Uehara H, Hamada H, Kito K, Yokoyama A, Sone S. Novel orthotopic
implantation model of human malignant pleural mesothelioma (EHMES-10
cells) highly expressing vascular endothelial growth factor and its receptor.
Cancer Sci. 2006;97:183–91.
22. Ke Y, Reddel RR, Gerwin BI, Reddel HK, Somers AN, McMenamin MG, LaVeck
MA, Stahel RA, Lechner JF, Harris CC. Establishment of a human in vitro
mesothelial cell model system for investigating mechanisms of asbestosinduced mesothelioma. Am J Pathol. 1989;134:979–91.
23. Di Marzo D, Forte IM, Indovina P, Di Gennaro E, Rizzo V, Giorgi F, Mattioli E,
Iannuzzi CA, Budillon A, Giordano A, Pentimalli F. Pharmacological targeting
of p53 through RITA is an effective antitumoral strategy for malignant
pleural mesothelioma. Cell Cycle. 2014;13:652-665
24. Ben Sahra I, Regazzetti C, Robert G, Laurent K, Le Marchand-Brustel Y,
Auberger P, Tanti JF, Giorgetti-Peraldi S, Bost F. Metformin, independent of
AMPK, induces mTOR inhibition and cell-cycle arrest through REDD1.
Cancer Res. 2011;71:4366–72.
25. Feng Y, Ke C, Tang Q, Dong H, Zheng X, Lin W, Ke J, Huang J, SC-J Y, Zhang H.
Metformin promotes autophagy and apoptosis in esophageal squamous cell
carcinoma by downregulating Stat3 signaling. Cell Death Dis. 2014;5:e1088.
26. Oliveras-Ferraros C, Cufí S, Vazquez-Martin A, Torres-Garcia VZ, Del Barco S,
Martin-Castillo B, Menendez JA. Micro(mi)RNA expression profile of breast
cancer epithelial cells treated with the anti-diabetic drug metformin:
induction of the tumor suppressor miRNA let-7a and suppression of the
TGFβ-induced oncomiR miRNA-181a. Cell Cycle. 2011;10:1144–51.
27. Borthakur G, Duvvuri S, Ruvolo V, Tripathi DN, Piya S, Burks J, Jacamo R,
Kojima K, Ruvolo P, Fueyo-Margareto J, Konopleva M, Andreeff M. MDM2
Inhibitor, Nutlin 3a, Induces p53 Dependent Autophagy in Acute Leukemia
by AMP Kinase Activation. PLoS One. 2015;10:e0139254.
28. Sekido Y. Molecular pathogenesis of malignant mesothelioma.
Carcinogenesis. 2013;34:1413–9.
29. Nishio M, Otsubo K, Maehama T, Mimori K, Suzuki A. Capturing the
mammalian Hippo: elucidating its role in cancer. Cancer Sci. 2013;104:1271–7.
30. Cho JH, Lee SJ, Oh AY, Yoon MH, Woo TG, Park BJ. NF2 blocks Snail-mediated
p53 suppression in mesothelioma. Oncotarget. 2015;6:10073–85.
31. Feng Z. p53 regulation of the IGF-1/AKT/mTOR pathways and the
endosomal compartment. Cold Spring Harb Perspect Biol. 2010;2:a001057.
Page 14 of 14
Submit your next manuscript to BioMed Central
and we will help you at every step:
• We accept pre-submission inquiries
• Our selector tool helps you to find the most relevant journal
• We provide round the clock customer support
• Convenient online submission
• Thorough peer review
• Inclusion in PubMed and all major indexing services
• Maximum visibility for your research
Submit your manuscript at
www.biomedcentral.com/submit