Factors affecting the satisfaction of outpatients on the quality of healthcare services at Lam Dong General Hospital II
Bạn đang xem bản rút gọn của tài liệu. Xem và tải ngay bản đầy đủ của tài liệu tại đây (587.98 KB, 6 trang )
JSLHU
JSLHU
JOURNAL OF SCIENCE
JOURNAL OF SCIENCE
OF LAC HONG UNIVERSITYwww.jslhu.edu.vn
Tạp chí Khoa học Lạc Hồng 2018, 6, 1-6
Tạp chí Khoa học Lạc Hồng 2020, 9, 014-019
OF LAC HONG UNIVERSITY
FACTORS AFFECTING THE SATISFACTION OF OUTPATIENTS ON
THE QUALITY OF HEALTHCARE SERVICES AT LAM DONG
GENERAL HOSPITAL II
Các yếu tố tác động đến sự hài lòng của bệnh nhân đối với chất lượng
dịch vụ khám chữa bệnh ngoại trú tại bệnh viện đa khoa II Lâm Đồng
Vũ Đức Hòa1a*, Nguyễn Văn Tân2,b and Huỳnh Văn Hóa3,c
2
1.3
Faculty of Pharmacy, Lac Hong University, Vietnam
Faculty of International Economics and Management, Lac Hong University, Vietnam
, ,
TÓM TẮT: Ngành Y tế giữ vai trò quan trọng trong sự phát triển kinh tế – xã hội, trong đó việc nâng cao chất lượng dịch
vụ y tế và đảm bảo công bằng trong chăm sóc sức khỏe hiện đang là vấn đề còn nhiều thách thức và được quan tâm đặc
biệt. Nghiên cứu nhằm xác định và đo lường các yếu tố tác động đến sự hài lòng của bệnh nhân đối với chất lượng dịch
vụ khám chữa bệnh ngoại trú tại Bệnh viện Đa khoa II Lâm Đồng, là cơ sở để cải thiện chất lượng dịch vụ y tế, đáp ứng
sự hài lòng và công bằng chăm sóc sức khỏe cho bệnh nhân vùng sâu vùng xa và người dân tộc thiểu số tại phía nam tỉnh
Lâm Đồng. Nghiên cứu được thực hiện bằng phương pháp mô tả cắt ngang trên 360 bệnh nhân gồm người Kinh và người
dân tộc thiểu số theo tỷ lệ 1:1. Kết quả nghiên cứu cho thấy có 05 nhân tố chất lượng dịch vụ tác động đến sự hài lòng
của bệnh nhân theo mức độ giảm dần bao gồm: (1) Năng lực phục vụ, (2) Sự đáp ứng, (3) Sự cảm thông, (4) Sự tin cậy
và (5) Phương tiện hữu hình. Ngoài ra, khám phá yếu tố dân tộc và một số yếu tố nhân khẩu học cũng như đặc điểm khám
chữa bệnh khác có tác động có ý nghĩa thống kê đến mức độ đánh giá sự hài lòng của những bệnh nhân được khảo sát.
TỪ KHOÁ: Chất lượng dịch vụ y tế, Sự hài lòng, Bệnh nhân ngoại trú, Dân tộc thiểu số, Bệnh viện Lâm Đồng
ABSTRACT: The health sector plays a vital role in socio-economic development as well as improving the quality of health
services; and ensuring equity in health care has been a challenging issue for a long time. The study aims to identify and
measure factors affecting the satisfaction of patients in the quality of outpatient services at Lam Dong General Hospital
II to provide basis recommendations for improving the quality of health services, meeting satisfaction and equity of health
care services for disadvantaged and ethnic minority patients in the southern part of Lam Dong province. The study was
conducted by a cross-sectional descriptive study of 360 patients, including Kinh and ethnic minorities, in a 1:1 ratio. The
results showed five service quality factors affecting patient satisfaction in descending order: (1) Assurance, (2)
Responsiveness, (3) Empathy, (4) Reliability, and (5) Tangible. Besides, some demographic and clinical characteristics
that had statistically significant impacts on the level of satisfaction of the surveyed patients were also indicated.
KEYWORDS: Quality of health-care services; Satisfaction; Outpatient; Ethnic minority; Lamdong hospital
1. INTRODUCTION
These days, patient satisfaction about the quality of
medical services is increasingly being worried, becoming
the top concern of patients as well as healthcare providers
and the government. In recent years, although the quality
of medical examination and treatment at hospitals has been
improved compared to the past, the results have not been
commensurate with the people's healthcare needs.
In the Decree 43/2006/ND-CP of the government, it
stipulates the autonomy and self-responsibility for the
performance of tasks, organizational structure, payroll, and
finance for public non-business units as well as the policy
of socialization of health. This decree has created
conditions for a series of healthcare services to be
established and developed, meeting the supply and demand
rules of the healthcare "market" as well as ensuring
competitive advantages of public hospitals to other health
facilities more critical than ever.
On the other hand, Lam Dong is a multi-ethnic province,
belonging to one of the five provinces in the Central
Highlands. At the discussion session of the Government's
report on the implementation of the national goals of
equality at the fourth session, the 14th National Assembly
(November 2017), many deputies commented that there
14
Tạp chí Khoa học Lạc Hồng
have been plenty of difficulties and challenges, especially
for people in remote, isolated and ethnic minority areas,
including medical and healthcare services.
Therefore, this study is conducted to improve the quality
of healthcare services by assuring medical fairness as well
as the satisfaction of patients using medical examination
and treatment services in public hospitals.
2. THEORETICAL AND CONCEPTUAL
FRAMEWORK
According to Zeithaml and Bitner (2000), customer
satisfaction is the evaluation of customers on a product or
service that meets their needs and expectations [9].
According to Parasuraman, Zeithaml, and Berry (1985,
1988), service quality is the distance between perceptions
and expectations of customers when using the service [8].
In the field of health, Dansky and Miles (1997) claimed
that that the satisfaction of patients with health care
services would help health facilities to detect weaknesses
and shortcomings in the process of providing services,
Received: Dec, 31st, 2019
Accepted: May, 15th, 2020
*Corresponding Author
Email:
Vũ Đức Hòa, Nguyễn Văn Tân, Huỳnh Văn Hóa
thereby controlling risks that can lead to dissatisfaction.
Customer satisfaction when using medical services greatly
depends on the results of medical examination and
treatment, and on the relationships arising in the course of
medical examination and treatment. Therefore, the
assessment of customer satisfaction, in this case, is
essentially an assessment of the quality of health services
[6].
In addition, many other previous studies also confirmed
a positive relationship between healthcare service quality
and patient satisfaction (Khanchitpol and William, 2013;
Zamil et al., 2012) [4].
Through the theoretical foundation and previous studies,
the proposed research model is the model of Cronin and
Taylor (1992) [1], in which variables and scales are
adjusted to fit in the context, characteristics of the field as
well as area and subjects of the study. Therefore, this
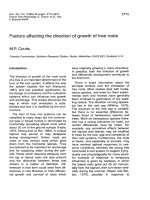
proposed research model is as follows with 06 scales:
Tangible
H1(+)
Empathy
H2 (+)
Responsiveness
Reliability
H3 (+)
H4 (+)
Practical observation
Secondary sources
Original questionnaire
Interview with 08 experts
Trial survey on 20 patients
Data analysis
Adjusted questionnaire
Quantitative survey on 360 patients
Data processing and inputting
Satisfaction
H5 (+)
Assurance
Figure 1. The proposed research model
(Source: Summary of author)
From the proposed model, the hypotheses about the
relationship between concepts in the research topic are
formed as follows:
• H1: Tangible positively affects patient satisfaction;
• H2: Empathy positively affects patient satisfaction;
• H3: Responsiveness positively affects patient satisfaction;
• H4: Reliability positively affects patient satisfaction;
• H5: Assurance positively affects patient satisfaction.
3. RESEARCH METHODS
Regarding the development and testing of patient
satisfaction scales, the study carried out a cross-sectional
description method combining qualitative and quantitative
research, sample description, and verification of scales.
In which, the original scale was built based on the
SERVPERF model questionnaire and the inheritance of
some previous studies. After that, conducting in-depth
interviews with 08 experts from diverse fields to increase
the rigor and value. Then following by a trial interview of
20 patients representing two groups of subjects to adjust
the words appropriately and easy to understand.
Quantitative research data was collected by a convenient
non-probability sampling method, interviewed based on
the questionnaires with the sample size of 180 Kinh and
180 ethnic minority patients within 05 weeks from March
to May 2018 at Outpatient Examination Area in Lam Dong
II General Hospital.
The collected data were input/digitalized using
Microsoft Excel 2010, coded and processed by SPSS
(Statistical Package for the Social Sciences) software for
Windows version 20.0; then, they were turned into
Data analysis
Data presentation
Figure 2. Research process flowchart
(Source: Authors’ summary)
Cronbach’s Alpha analysis, EFA discovery factor, and
Pearson correlation to test the scales.
In terms of measuring the impact of service quality
factors on patient satisfaction, the study built a multiplelinear regression model to identify which factors are
significant and which factors have no significance for
statistically increasing the satisfaction of the surveyed
subjects, assessing the differences in the level of the
influence of factors on patient satisfaction.
For testing differences in assessing patient satisfaction,
the study analyzes the differences of characteristics
according to descriptive statistical methods with criteria
such as gender, age, ethnicity, occupation, times
examination, service type, through Anova one-way indepth analysis (Post-Hoc One-way Anova) and
independent-samples T-test.
4. RESULTS AND DISCUSSION
4.1 Developing and testing the scale
4.1.1 Qualitative research
Complete the scale and adjust the questionnaires of
satisfaction of outpatient patients at Lam Dong General
Hospital II, including 06 components: (1) Tangible,
(2) Empathy, (3) Responsiveness, (4) Reliability,
(5) Assurance, (6) Satisfaction. From 29 observed
variables, 07 nonconforming variables were removed due
to non-standard in the initial data analysis or inconsonant
in the hospital research context as agreed by the authors
and interviewing experts. In addition, the meaning of terms
and content for 22 remain official observed variables are
also confirmed by authors and members participating in the
Tạp chí Khoa học Lạc Hồng
15
Factors affecting the satisfaction of outpatients on the quality of healthcare services at Lam Dong General Hospital II
discussion group. Thereafter, the scale continues to be used
in quantitative research for evaluation.
4.1.2 Quantitative research
Analysis of the characteristics of the surveyed sample
shows that: The proportion of women is more significant
than men (53.9% and 46.1%), the majority of the
interviewees are those aged 31 and older (64.4% of the
total number), 95% of the ethnic minority sample are Co
Ho and Ma people, most of them have education levels
below high school (78.9%) and main occupation is farmer
(78.3%). Regarding the place of residence, the percentage
of patients coming from Bao Loc City, where the hospital
is located, and from other districts is 1:3 (25% and 75%).
Most patients have health insurance (98.9%), the majority
of patients often visit the hospital more than three times
within a year (71.7%), 53.3% of patients have to wait more
than three hours to complete the latest examination
process.
4.1.3 Data processing and scale verification
Firstly, the study is conducted to assess the reliability of
the scale through Cronbach’s Alpha coefficient. The
calculation of the Alpha coefficient is presented in Table 1
shows that no observed variables were excluded from the
scale because the Alpha coefficients were in the range [0.8;
0.9], and if removing a variable from the scale does not
increase the reliability coefficient as well as in terms of
content, the observed variable can be conserved.
Table 1. Analyzing reliability of scale
by Cronbach’s Alpha coefficient
Cronbach’s
Alpha
Tangible
04
0.876
Empathy
04
0.867
Responsiveness
03
0.846
Reliability
04
0.871
Assurance
03
0.831
04
0.860
Satisfaction
Accepted value
> 0.6
(Source: Authors’ analysis)
The outcome of the reliability analysis of the scale
shows that 22 observed variables meet the standards and
are put into the performing EFA discovery factor analysis
using the Principal Components extraction method and
Varimax rotation to detect the structure and assessment of
convergence of observed variables by components.
The factor analysis is first conducted with 18 observed
variables of the independent variables, resulting in 05
convergence factors, analysis results on 04 observed
variables of the dependent variable for one convergent
factor only.
Table 2. Summary of EFA analysis results
0.853
0.778
Barlett’s
Sig.
0.000
0.000
Cumulative
%
78.918
71.814
0.5 ≤ KMO ≤ 1
< 0.05
> 50%
Variables
KMO statistic
Independent
Dependent
Accepted
value
(Source: Authors’ analysis)
16
Tạp chí Khoa học Lạc Hồng
4.2 Measure the impact of factors on patient
satisfaction
Multivariate linear regression analysis is performed by
the overall regression method of variables with SPSS 20.0
software to determine the specific weight of each
component affecting patient satisfaction, the results are:
Table 3. Assess the suitability of linear regression model
Model
1
Model
Number
of Items
Factor
The results of two analyses show that the KMO index of
the independent and dependent variables, respectively, are
0.713 and 0.753, greater than 0.5, indicating that the data
used for factor analysis are appropriate.
Barlett’s test results with the Sig. significance level =
0.000 < 0.05 (reject hypothesis H0: observed variables are
not correlated with each other in the whole), so the
hypothesis of correlation matrix between variables is a
homogeneous matrix is rejected, which means variables
are correlated with each other and satisfied factor analysis.
Pearson correlation analysis results show Sig. Values
between independent variables and the dependent variable
meeting the requirements (0.000 < 0.05). It is possible to
conclude that independent variables are correlated with the
dependent variable, so it can be included in the model to
explain the dependent variable.
Regression
Residual
Total
MODEL PARAMETERS
Adjusted
DurbinR
R2
Std. Error
R2
Watson
0.954
0.911
0.910
0.17731
1.897
ANOVA
Sum of
Mean
df
F
Sig.
Squares
Square
113.996
5
22.799
11.129
354
0.031
125.125
359
725.219
0.000
(Source: Authors’ analysis)
The above analysis results show that the adjusted R2
coefficient = 0.919 is high, proving that this linear
regression model is consistent with the sample data set at
91.9%, that is, the independent variables explained 91.9%
variation of the satisfaction variable (SAT). With the
hypothesis H0: R2 = 0, the ANOVA analysis results for
F = 409.278 with Sig. = 0.000. Therefore, the conclusion that
the linear regression model built is consistent with the overall.
Table 4. Statistics in the regression model by the Enter method
Model
(Cons
-tant)
TAN
1 EMP
RES
REL
ASSU
Std.
Unstandardized
CoeffiCoefficients
cients
Std.
B
β
Error
-0.105
0.072
0.117
0.207
0.284
0.149
0.292
0.021
0.020
0.021
0.023
0.016
t
Sig.
Collinearity
Statistics
Tolerance
VIF
-1.453 0.147
0.124 5.460 0.000 0.491 2.038
0.209 10.102 0.000 0.585 1.710
0.316 13.682 0.000 0.472 2.117
0.151 6.440 0.000 0.458 2.183
0.382 18.350 0.000 0.581 1.722
(Source: Authors’ analysis)
The above results show that the model does not violate
the multicollinearity phenomenon because the variance
inflation factor (VIF) is less than 3 [3].
Vũ Đức Hòa, Nguyễn Văn Tân, Huỳnh Văn Hóa
The analysis also shows that all five factors are
statistically significant (Sig. < 0.05), confirming the twosided test significance level, and these independent
variables all affect the satisfaction level of patients with
95% confidence.
Additionally, the standardized regression coefficients are
nonzero and have positive values (>0) which show that
overall, Tangible (TAN), Empathy (EMP), Responsiveness
(RES), Reliability (REL), Assurance (ASSU) variables have
a positive impact on Satisfaction (SAT) variable. Since then,
testing hypotheses of the research model and giving multiple
linear regression equations as follows:
SAT = -0.105 + 0.117*TAN + 0.207*EMP
+ 0.284*RES + 0.149*REL + 0.292*ASSU
Thus, in the context of other unchanged variables, every
1% increases in the Tangible (TAN) variable will increase
0.117% in the Satisfaction (SAT) variable of outpatients at
General Hospital II Lam Dong. Similarly, Empathy
(EMP), Responsiveness (RES), Reliability (REL) and
Assurance (ASSU) variable will have the SAT of 0.207%,
0.284%, 0.149% and 0.292%, respectively.
4.3 Testing differences in assessing patient satisfaction
Differences in satisfaction level by sex characteristics
and living places of patients through Independent Samples
T-Test showed that there are statistically significant
relationships between sex, ethnic group and living place
factors to the overall satisfaction of a patient with the
quality of outpatient care at Lam Dong General Hospital II
(Sig. <0.05). In particular, the average satisfaction level of:
• The female patients (3.8952) is higher than the male
counterparts (3.6810);
• The ethnic minority patients (4.1111) is higher than the
Kinh patients (3.4722);
• The patients living in other districts (4.0304) is higher
than the patients living in Bao Loc City (3.5503).
To determine the differences in the satisfaction in terms
of patients' age, education level, occupation, number of
visits, total waiting time, date and types of examination,
authors conducted ANOVA analysis. The results show that
the patients' average values of satisfaction are:
• Slight fluctuations among age groups, the average
value of the group from 31 to 50 years old (3.7095) is lower
and analytically different to patients aged 18 to 30 years
(3.9116) (Post-Hoc Sig. = 0.013);
• Decreasing by educational level, in which the average
value of satisfaction of the primary and illiterate group is
highest (4.2653), followed by the secondary group
(3.9766), the group of upper secondary education and
above is the lowest (3.4421) (Post-Hoc Sig. = 0.000);
• Strong fluctuations among occupational groups, the
average satisfaction level of the two groups farmers
(4.0866) and workers (3.8426) are the highest, of the two
groups officers (3.2900) and retirement (3.2125) are the
lowest (Welch Sig. = 0.000);
• Gradually declining according to the total time patients
wait to complete their examinations, the group of patients
who completed medical care within two hours assessed
their average satisfaction level (4.0800) higher than that of
patients waiting for two to three hours (3.7628) and
patients waiting for longer than three hours (3.7312);
• Varies dependent on the visit day, patients who visit on
Mondays have a low average satisfaction value (3.6250),
which is statistically different to those patients who visit on
Tuesdays (3.8719; Post-Hoc Sig. = 0.008), Wednesdays
(3.8672; Sig. = 0.014), Thursdays (3.8993; Sig. = 0.004);
• There are no statistically significant differences
between groups of patients with different amount of visits
as well as between patients registering with health
insurance or services.
4.4 Comparing the impact of service quality factors on
patient satisfaction by ethnic group
For ethnic characteristics, authors continued to conduct
Pearson correlation analysis separately for the majority
ethnic group (the Kinh) and the minority ethnic group to
consider the suitability of putting service quality
components into two separate regression models.
Multivariate regression analysis results are used to
compare the level of impact of service quality factors on
patient satisfaction by two ethnic groups.
Pearson correlation analysis results show Sig. Values
between independent variables and the dependent variable
are satisfactory (0.000 < 0.05) so it can be concluded that
independent variables (TAN, EMP, RES, REL, ASSU) are
correlated with dependent variable. Therefore, it is possible
to put them into the model for explaining the dependent
variable (SAT).
Authors conducted multivariate linear regressions with
05 independent variables (1) TAN, (2) EMP, (3) RES, (4)
REL, (5) ASSU, and an SAT to determine the specific
weights of each component affecting the satisfaction of the
two patient groups. The analysis is performed by the
general regression method of variables (Enter) with SPSS
20.0 software. The analysis results show that Adjusted R2
samples of the two models are high (0.851 and 0.915),
proving that this linear regression model is suitable for the
data set of Kinh and ethnic minority sample groups at
85.1% and 91.5%, respectively.
With the hypothesis H0: R2 overall = 0, ANOVA
analysis results give us Sig. = 0.000. Therefore, the
hypothesis H0 is rejected, and the linear regression model
built is consistent with the whole.
Table 5. Statistics in regression model by the Enter method
Standardized
Sig.
Coefficients
Group
Model
VIF
(p_value)
β
(Constant)
0.726
Kinh
TAN
0.109
0.003
1.566
EMP
0.109
0.006
1.805
RES
0.290
0.000
1.807
REL
0.148
0.001
2.517
ASSU
0.529
0.000
1.651
(Constant)
Ethnic
minorities
0.565
TAN
0.191
0.000
1.833
EMP
0.325
0.000
1.457
RES
0.367
0.000
2.119
REL
0.064
0.015
1.455
ASSU
0.302
0.000
1.398
(Source: Authors’ analysis)
Regression analysis results for the Sig. are less than
0.05, confirming the two-sided test significance level
between the independent variables and the dependent
variable are both qualified, so these independent variables
Tạp chí Khoa học Lạc Hồng
17
Factors affecting the satisfaction of outpatients on the quality of healthcare services at Lam Dong General Hospital II
have impacts on patient satisfaction with the confidence of
95 %.
Therefore, two multivariate regression equations with
the standardized Beta coefficient for the two ethnic groups
are formulated as follows:
SATKinh = 0.109*TAN + 0.109*EMP + 0.290*RES
+ 0.148*REL + 0.529*ASSU
SATEM = 0.191*TAN + 0.325*EMP + 0.367*RES
+ 0.064*REL + 0.302*ASSU
Therein,
SATKinh and SATEM: General satisfaction of Kinh
ethnic patients and general satisfaction of ethnic minority
patients about outpatient medical examination and
treatment service at Lam Dong II General Hospital;
TAN: Tangible; EMP: Empathy; RES:
Responsiveness; REL: Reliability; ASSU: Assurance.
From two linear regression equations above, authors
summarises the following table (95% confidence level):
Table 6. Comparing the impact of service quality factors
on patient satisfaction by two ethnic groups
Kinh
Impact
level
Strongest
Weakest
Factor
Assurance
Responsiveness
Reliability
Tangible
và Empathy
Ethnic minorities
Standardized
Coefficients
β
0.529 0.367
0.290 0.325
0.148 0.302
0.191
0.109
0.064
Factor
Reliability
Empathy
Assurance
Tangible
Responsiveness
(Source: Authors’ analysis)
Therefore, there is a statistically significant difference in
the level of satisfaction assessment of outpatient medical
care services at Lam Dong General Hospital II between
two groups of Kinh patients and ethnic minority patients.
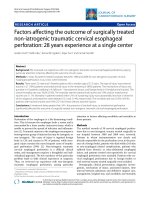
Analysis of two corresponding linear regression models
showed that all 05 service quality factors studied have
positive effects on patient satisfaction.
However, for the Kinh group, the factor “Assurance” has
an outstanding high impact (0.529) compared to the
remaining four factors, the two factors with the weakest
impact level are “Tangible” and “Sympathy” (0.109).
For ethnic minority patients, the three most potent factors
have a similarly close impact, namely “Responsiveness”
(0.367), “Empathy” (0.325) and “Assurance” (0.302); the
factor "Reliability" has the smallest impact coefficient
(0.064).
In general, the above results show that the impact of the
factor “Tangible” is less varied between the two groups.
However, the greater difference in impact levels of the
remaining 4 factors may due to the differece in expectation
trends of service quality or the service quality factors are
have not been equally responded between the two target
groups. In detail:
• The Kinh group with higher average educational and
income levels sets higher expectations for the quick and
less waiting time for medical examination (Assurance);
expertise and careful examination by physicians
(Responsiveness);
18
Tạp chí Khoa học Lạc Hồng
Kinh
Ethnic minorities
Figure 3. The impact rate of service quality factors
on patient satisfaction by ethnic group
(Source: Authors’ analysis)
• Ethnic minorities group with lower average educational
and income levels, more different in language and culture
sets higher expectations for accurate results as well as
simple and transparent medical examination procedures
(Reliability); the decent, friendly and equal treatment
(Sympathy).
5. CONCLUSION
Regarding the construction and testing of scales for
patient satisfaction with outpatient medical service quality
at Lam Dong General Hospital II:
The study tests a built-up scale consisting of 22
observed variables over 360 collected questionnaires and
shows that the scale reached a standard level of reliability
and is suitable to impose on subsequent analyzes.
Regarding the impact measurement of the quality of
healthcare services on outpatient satisfaction at Lam Dong
General Hospital II:
The results of linear regression analysis indicate 05
service quality factors affecting the satisfaction of patients
when having outpatient medical examination and treatment
at Lam Dong General Hospital II including: Assurance,
Responsiveness, Empathy, Reliability and Tangible. The
study result is also similar to the study of the authors D.
Lalitha Rani and Yeshiemebet Demissie (2017) [2], Ho
Bach Nhat (2015) [7] and the authors Le Tan Phung and
Gerard FitzGerald (2014) [5]. In particular, two factors of
Assurance and Responsiveness have the strongest impact,
following by Empathy; Reliability and Tangible factors
have less impact on patient satisfaction.
Regarding testing the difference in assessing the
satisfaction of patients' healthcare service quality
according to a number of demographic factors, medical
examination types and treatment characteristics:
T-Test and ANOVA test results show that the factors
of ethnic group, gender, age, place of residence,
educational level, occupation and waiting time for
examination are statistically significant to patient's
satisfaction with outpatient healthcare services quality at
Lam Dong General Hospital II.
6. REFERENCES
[1] Cronin Jr J. J. , Taylor S. A., "Measuring service quality: a
reexamination and extension", The journal of marketing,
1992, pp. 55-68.
[2] D. Lalitha Rani , Yeshiemebet Demissie, "Service Quality of
Public Hospitals in Amhara Region, Ethiopia: Outpatient
Perspective", International Journal of Informative &
Futuristic Research, 2017, 4, pp. 6632-6640.
[3] Hoàng Trọng, Chu Nguyễn Mộng Ngọc, Phân tích dữ liệu
nghiên cứu với SPSS, NXB Hồng Đức, 2008.
Vũ Đức Hòa, Nguyễn Văn Tân, Huỳnh Văn Hóa
[4] Khôi L. N. Đ., Thúy N. V. , Nghị Đ. H., "Mô hình mối quan
hệ giữa chất lượng dịch vụ và sự hài lòng của bệnh nhân đối
với dịch vụ y tế của các bệnh viện tuyến quận huyện tại thành
phố Cần Thơ", Tạp chí Khoa học Trường Đại học Cần Thơ,
2014, tr. 94-101.
[5] Le P. , FitzGerald G., "Applying the SERVPERF scale to
evaluate quality of care in two public hospitals at Khanh Hoa
Province, Vietnam", Asia Pacific Journal of Health
Management, 2014, 9 (2), pp. 66.
[6] KH Dansky, J Miles, “Patient satisfaction with ambulatory
healthcare services: waiting time and filling time”, Journal of
Healthcare Management, 1997, 42 (2), pp. 165-177.
[7] Nhật H. B. (2015), "Sự hài lòng của bệnh nhân nội trú đối với
chất lượng dịch vụ khám chữa bệnh của các bệnh viện tại
thành phố Long Xuyên", 2015.
[8] Parasuraman A., Zeithaml V. A. , Berry L. L., "A conceptual
model of service quality and its implications for future
research", the Journal of Marketing, 1985, pp. 41-50.
[9] Zeithaml V. A. (2000), "Service quality, profitability, and the
economic worth of customers: what we know and what we
need to learn", Journal of the academy of marketing science.
28 (1), pp. 67-85.
Tạp chí Khoa học Lạc Hồng
19