Test bank to accompany modern portfolio theory and investment analysis 9th edition
Bạn đang xem bản rút gọn của tài liệu. Xem và tải ngay bản đầy đủ của tài liệu tại đây (646.8 KB, 18 trang )
Test Bank to accompany Modern Portfolio Theory and Investment Analysis, 9th Edition
Test Bank to accompany Modern Portfolio Theory and
Investment Analysis, 9th Edition
MODERN PORTFOLIO THEORY AND INVESTMENT ANALYSIS
9TH EDITION
ELTON, GRUBER, BROWN, & GOETZMANN
The following exam questions are organized according to the text's sections. Within each
section, questions follow the order of the text's chapters and are organized as multiple
choice, true-false with discussion, problems, and essays. The correct answers and the
corresponding chapter(s) are indicated below each question.
PART 2: PORTFOLIO ANALYSIS
PART 2 – Section 1: Mean Variance Portfolio Theory
Multiple Choice
1.
The risk on a portfolio of assets:
a. is different from the risk on the market portfolio.
b. is not influenced by the risk of individual assets.
c. is different from the risk of individual assets.
d. is negatively correlated to the risk of individual assets.
Answer: C
Chapter: 4
2.
Which of the following is correct of how the returns on assets move together?
a. Positive and negative deviations between assets at similar times give a
Part 2 - 1
Test Bank
Modern Portfolio Theory and Investment Analysis, 9th Edition
negative covariance.
b. Positive and negative deviations between assets at dissimilar times give a
negative covariance.
c. Positive and negative deviations between assets give a zero covariance.
d. Positive and negative deviations between assets at dissimilar times give a
positive covariance.
Answer: B
Chapter: 4
3.
An efficient frontier is:
a. a combination of securities that have the highest expected return for each
level of risk.
b. the combination of two securities or portfolios represented as a convex
function.
c. a combination of securities that lie below the minimum variance portfolio and
the maximum return portfolio.
d. a combination of securities that have an average expected return for each
level of risk.
Answer: A
Chapter: 5
4.
Two companies Amber and Bolt are manufacturers of glass. The securities of the
companies are listed and traded in the New York Stock Exchange. An investor’s
portfolio consists of these two securities in the proportion of 5/6 and 1/6 respectively.
Amber’s security has an expected return of 20% and a standard deviation of 8%. Bolt
has an expected return of 15% and a standard deviation of 5%. The correlation
coefficient between the two securities is 0.6. Calculate the expected return and the
standard deviation of the investor’s portfolio.
a. R P 19.17%; P 7.20%
b. R P 20.19%; P 8.20%
c. R P 17%; P 7.0%
d. R P 18.19%; P 8.0%
Answer: A
Chapter: 6
Problems
1.
Consider the probability distribution below. (Note that the expected returns of A
and B have already been computed for you.)
State
p(s)
rA
rB
Recession
0.3
-0.11
0.16
Normal
0.4
0.13
0.06
Part 2 - 2
.
Modern Portfolio Theory and Investment Analysis, 9th Edition
Boom
0.3
Expected Return:
Test Bank
0.27
0.1
-0.04
0.06
a. Calculate the standard deviations of A and B.
b. Calculate the covariance and correlation between A and B.
c. Calculate the expected return of the portfolio that invests 30% in stock A
and the rest in stock B.
d. Calculate the standard deviation of the portfolio in part b.
Answer:
a. A2 = [0.3 (–.11 –. 1)2] + [0.4 (.13 – .1)2] + [0.3 (.27 – .1)2] = 0.02226
B2 = [0.3 (.16 – .06)2] + [0.4 (.06 –. 06)2] + [0.3 (–.04 – .06)2] = 0.006
b. Cov(rA,rB) = [0.3 (–.11 –. 1)(.16 – .06)] + [0.4 (.13 – .1)(.06 – .06)] + [0.3 (.27 –
.1)( –.04 – .06)] = –0.0114
Corr(rA,rB) = –0.0114 / (0.1492 .0775)= –0.9859
c. E(rp) = 0.3(0.1) + 0.7(0.06)=0.072
d. Using the standard deviation of each of the assets A and B computed in part a
and covariance between the two assets computed in part b:
P2 = [(0.3 0.1492)2 + (0.7 0.0775)2 + 2 0.3 0.7 (-0.0114)] = 0.0001554
Chapter: 4
2.
Stock A has an expected return of 8% and a standard deviation of 40%. Stock B
has an expected return of 13% and standard deviation of 60%. The correlation between
A and B is -1 (i.e., they are perfectly negatively correlated). Show that you can form a
zero risk portfolio by investing w A
B
in A and the rest in B.
A B
Answer:
Copyright © 2014 John Wiley & Sons, Inc.
Part 2 - 3
Modern Portfolio Theory and Investment Analysis, 9th Edition
Test Bank
wA
0.6
0.6 Thus,
0.6 0.4
The variance of the portfolio is given by:
This portfolio has zero variance; hence, it is riskless. This confirms what we learned in
class—when two securities are perfectly negatively correlated, it is possible to form a
zero-risk portfolio by combining them.
Chapter 5
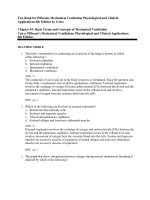
3.
The following diagram shows the investment opportunity set for portfolios
containing stocks A and B. You need to know that:
Point A on the graph represents a portfolio with 100% in stock A
Point B represents a portfolio with 100% in stock B
9.00%
A
8.00%
z
Portfolio Expected Return
7.00%
y
x
6.00%
w
5.00%
B
4.00%
3.00%
2.00%
1.00%
0.00%
0.00%
0.50%
1.00%
1.50%
2.00%
2.50%
3.00%
Portfolio Standard Deviation
Part 2 - 4
.
Modern Portfolio Theory and Investment Analysis, 9th Edition
Test Bank
a. Is the correlation between A and B greater than, equal to, or less than 1. How do
b.
c.
d.
e.
f.
you know?
Which labeled point on the graph represents the minimum variance portfolio?
Which labeled point on the graph represents a portfolio with 88% invested in stock A
and the rest in B?
If A and B are the only investments available to an investor, which of the labeled
portfolios are efficient?
Suppose a risk-free asset exists, allowing an investor to invest or borrow at the riskfree rate of 3%. If the above graph is drawn perfectly to scale, which labeled point
represents the optimal risky portfolio.
Under the assumptions in part (e), would it be wise for an investor to invest all of his
or her money in stock A? Why or why not?
Answer:
a. Less than 1. Correlation can’t be greater than 1, and if correlation equaled 1
(meaning that A and B were perfectly positively correlated), then the IOS between
A and B would be a straight line.
b. x
c. z. This should be obvious, since a portfolio with 88% in A will be much closer to A than
B on the curve. You can also confirm mathematically by noting from the graph that
E(rA) ≈ 8.5% and E(rB) ≈ 4.5%. Thus, a portfolio with 87% in A will have E(rP) ≈ 0.88(.085)
+ 0.12(.045) = 0.0802, which is approximately the expected return of portfolio z in the
graph.
d. x, y, z, and A
e. y. Note on the graph that the tangency line from the risk-free asset intercepts the
IOS at y.
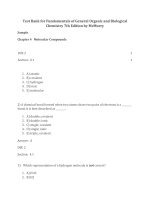
Copyright © 2014 John Wiley & Sons, Inc.
Part 2 - 5
Modern Portfolio Theory and Investment Analysis, 9th Edition
Test Bank
9.00%
A
8.00%
z
Portfolio Expected Return
7.00%
y
x
6.00%
w
5.00%
B
4.00%
3.00%
2.00%
1.00%
0.00%
0.00%
0.50%
1.00%
1.50%
2.00%
2.50%
3.00%
Portfolio Standard Deviation
f. No. When the investor has the ability to borrow or lend at the risk-free rate, only
the portfolios on the tangency line are efficient. Note in the graph above that by
borrowing at the risk-free rate and investing everything in the optimal risky
portfolio (y, in this case), the investor can create portfolios that that dominate A.
Chapter: 5 and 6
Essay
1.
Describe what is semivariance? Give reasons why semivariance is not used as a
measure of dispersion.
Answer:
Semivariance is a measure of dispersion that considers only the deviations of the returns
which are below the average desired returns. This may be useful as the only returns that
alarm an investor are the returns that are below the desired level.
For a well-diversified equity portfolio, symmetrical distribution is a reasonable assumption
and hence, variance is also an appropriate measure of downside risk.
Furthermore, since empirical evidence shows that most of the assets existing in the
market have returns that are reasonably symmetrical, semivariance is not needed
because if returns on an asset are symmetrical; the semivariance is proportional to the
variance. Thus, in most of the cases, not the semivariance, but the variance, is used as
Part 2 - 6
.
Modern Portfolio Theory and Investment Analysis, 9th Edition
Test Bank
a measure of dispersion.
Chapter: 4
2.
Under what condition will adding a security with a high standard deviation
decrease the risk of a portfolio?
Answer:
The risk of a combination of assets is different from a simple average of the risk of
individual assets. The standard deviation of a combination of two assets may be less than
the variance of either of the assets themselves.
Adding a security with a high standard deviation to a portfolio can reduce the overall risk
of portfolio if the security is negatively correlated to the bulk of securities in the portfolio. In
a condition where two securities are perfectly negatively correlated, the securities will
move together but in opposite directions. The standard deviation of such a portfolio will
be smaller than a portfolio whose securities are positively correlated. If two securities are
perfectly negatively correlated, it should always be possible to find some combination of
these two securities that has zero risk. A zero risk portfolio will always involve positive
investment in both the securities.
Chapter: 5
3.
With the help of a diagram show, how would you identify a ray with the greatest
slope as an efficient frontier where riskless lending and borrowing is present?
Answer:
We understand that the existence of riskless lending and borrowing implies that there is
a single portfolio of risky assets that is preferred to all other portfolios. In the return
standard deviation space, this portfolio plots on the ray connecting the riskless asset
and the risky portfolio that lies farthest in the counter clockwise direction. We can judge
from the below given graph that the ray RF — B is preferred by the investors to any
other portfolio or rays like RF — A . The efficient frontier is the entire length of the ray
extending through R F and B .
Copyright © 2014 John Wiley & Sons, Inc.
Part 2 - 7
Test Bank
Modern Portfolio Theory and Investment Analysis, 9th Edition
The slope of the line connecting a riskless asset and a risky portfolio is the expected
return on the portfolio minus the risk-free rate divided by the standard deviation of the
return on the portfolio. Thus, the efficient set is determined by finding a portfolio with the
greatest ratio of excess return to standard deviation that satisfies the constraint that the
sum of the proportions invested in the assets equals 1.
Chapter: 6
PART 2 – Section 2: Simplifying the Portfolio Selection Process
Multiple Choice
1.
If the returns on different assets are uncorrelated:
a. an increase in the number of assets in a portfolio may bring the standard
deviation of the portfolio close to zero.
b. there will be little gain from diversification.
c. diversification will result in risk averaging but not in risk reduction.
d. the expected return on a portfolio of such assets should be zero.
Answer: A
Chapter: 4
2.
Using the Sharpe single-index model with a random portfolio of U.S. common
stocks, as one increases the number of stocks in the portfolio, the total risk of the portfolio
will:
a. approach zero.
b. approach the portfolio's systematic risk.
c. approach the portfolio's non-systematic risk.
d. not be affected.
Answer: B
Chapter: 7
Part 2 - 8
.
Modern Portfolio Theory and Investment Analysis, 9th Edition
Test Bank
3.
What is the concept behind the indexes used in the Fama and French Model?
a. Form portfolios with standard deviations that mimic the impact of the variables.
b. Form portfolios with returns that are opposite to the impact of the variables.
c. Form portfolios with returns that mimic the impact of the variables.
d. Form portfolios with standard deviations that are opposite to the impact of the
variables.
Answer: C
Chapter: 8
4.
Which of the following is true of a cutoff rate?
a. The cutoff rate is be determined by dividing the Beta with the difference
between average return and return on the riskfree rate of the securities.
b. All securities whose return is above the cutoff rate are selected in the market
portfolio.
c. The cutoff rate is computed from the characteristics of all securities in the
optimum portfolio.
d. All securities whose risk is below the cutoff rate are selected in the optimum
portfolio.
Answer: C
Chapter: 9
True-False With Discussion
1.
Discuss whether the following statement is true or false:
One can always construct a multi-index model that explains more of the returns on a
security than a single-index model does.
Answer: True
The single-index model assumes that the stock prices move together only because of
common movement in the market. Hence, the single index-model derives returns on
securities with the help of the market movement in which the securities are being traded.
Although, according to many researchers, there are influences beyond the market that
cause stocks to move together. The multi-index model includes two different types of
schemes that have been put forth for handling additional influences. Hence, the multiindex model takes into consideration the return on securities by introducing additional
sources of covariance. By adding these additional influences, the multi-index model
explains more of the returns to the general return equation of the single-index model.
Chapter: 8
2.
Discuss whether the following statement is true or false:
A multi-index model will predict returns better than a single-index model.
Answer: False
The multi-index model lies in an intermediate position between the full historical
Copyright © 2014 John Wiley & Sons, Inc.
Part 2 - 9
Modern Portfolio Theory and Investment Analysis, 9th Edition
Test Bank
correlation matrix and the single-index model in its ability to reproduce the historical
correlation matrix. Adding more indexes complicates things but result in a more accurate
representation of the historical correlation matrix. However, this does not imply that future
correlation matrices will be forecast more accurately.
Chapter: 8
Problems
1.
Consider the following data for assets A and B:
R A 10% ; R B 19% ; A 3% ; B 5% ; A 0.6 ; B 1.4 ; AB 0.4 .
a.
Calculate the expected return, variance, and beta of a portfolio
constructed by investing 1/3 of your funds in asset A and 2/3 in asset B.
b.
If only the riskless asset and assets A and B are available, find the optimum
risky-asset portfolio if the risk-free rate is 8%.
Answer: a. Expected return on a portfolio =
Xi Ri .
1
2
R P 10 19 16 .
3
3
R P 16%
To construct the portfolio with investments A and B, the variance of the
portfolios will have to be calculated as:
N
N
i 1
i 1 j 1
N
2 P X i 2 i 2 X i X j ij
1 2
3
2
3
2
1 2
3 3
2 P 32 52 2 3 5 0.4
2 P 14.78% .
The Beta of a portfolio can be calculated by the following method:
N
P Xi i
i 1
1
2
P 0 .6 1 .4
3
3
P 1.13
b. Calculating for market variance we get,
i j m 2
ij
i j
Part 2 - 10
.
Modern Portfolio Theory and Investment Analysis, 9th Edition
Test Bank
0.6 1.4 2 m
0.4
3 5
Hence,
m2 7.14
Now,
ei 2 i 2 ( 2 m 2 )
eA 2 6.43
eB 2 11.01
Security
Mean
Return
Excess
Return
Excess
Beta
Return
Over Beta
R
i
RF i
ei
2
2i
ei 2
2
Ri RF i
i 1
ei 2
i 2
2
i 1 ei
i
ei 2
2
B
19
11
1.4
7.86
1.399
0.178
1.399
0.178
0.127
A
10
2
0.6
3.33
0.1866
0.033
1.586
0.211
0.093
2
Ci
m2
Rj RF j
ej 2
2
j 2
1 m 2
2
j 1 ej
j 1
C A = 4.520
C B = 4.398 ( C * )
(As C B is lower than the excess return over risk, we consider C B as the cutoff
rate C * )
Zi
i R i RF
C
*
ei 2 j
Z A 0.099
Z B 0.440
Therefore, the optimum portfolio will have its proportion of X A 29.17% X B 129 .17% .
Chapter: 7 and 9
2.
Consider the following data for assets A, B, and C
2
2
2
5.
10 ; eB
15 ; eC
R A 12% ; R B 8% ; R C 6% ; A 1.1; B 0.8 ; C 0.9 ; eA
Assume the variance of the market portfolio is 20 and that a riskless asset exists. Set up the
Copyright © 2014 John Wiley & Sons, Inc.
Part 2 - 11
Modern Portfolio Theory and Investment Analysis, 9th Edition
Test Bank
first-order conditions for the optimum risky-asset portfolio.
Answer:
Assuming a risk free rate of 5%, we get the following values for the optimum portfolio:
Secu
rity
Mean
Return
Excess
Return
Beta
Excess
Return
over Beta
A
B
C
12
8
6
7
3
1
1.1
0.8
0.9
6.36
3.75
1.11
R
j
RF j
ej
2
0.77
0.16
0.18
2j
ej 2
0.121
0.043
0.162
2
R R
j 1
ej
j
F
2
j
j2
2
j 1
ej
2
0.77
0.93
1.11
0.121
0.164
0.326
j
ei 2
0.11
0.053
0.18
The cutoff rate Ci of for an optimum portfolio can be found by the following equation:
2
m2
Ci
j
RF j
e j2
j 1
1 m
CA
R
2
j2
2
j 1 ej
2
20 0.93
20 1.11
20 0.77
CB
CC
1 (20 0.326 )
1 (20 0.164 )
1 (20 0.121 )
C A 4.50 (C*); C B 4.35 ; CC 2.95
The ratio of excess return over Beta is higher than the cutoff rate of 4.50 for
only security A. Hence, we conclude that only security A is included in the
first order equation of the optimal risky portfolio.
Chapter: 9
3.
Consider the following historical data for the returns on assets A and B and the
market portfolio:
Period
1
2
3
4
5
a.
b.
Asset A
10%
3%
5%
2%
1%
Asset B
6%
6%
2%
4%
2%
Market Portfolio
4%
1%
5%
2%
1%
What is the covariance between asset A and asset B?
If the beta of asset B is 0.5, what is the systematic return and non-systematic
return for asset B in each period?
Answer: a.
Period
Part 2 - 12
Asset A
Asset B
Asset A−
Average A
(1)
Asset B
−Average B
(2)
(1×2)
.
Modern Portfolio Theory and Investment Analysis, 9th Edition
1
2
3
4
5
Total
Average
10
−3
5
2
1
15
3
6
6
2
4
2
20
4
7
−6
2
−1
−2
Test Bank
2
2
−2
0
−2
14
−12
−4
0
4
2
Hence, the Covariance (A, B) = 2 ÷ 5 = 0.4
b. From the given information, we know that the average return on asset B is 4%,
average return on market is 2.6% and the Beta of asset B is 0.5. Based on this
information, we can find the value of systematic return ( i ) and unsystematic
return ( ei ).
B RB B RM
B 4 0.5 2.6
Hence, B 2.7
To find the value of the unsystematic risk for all periods, we used the following
formula:
R B B B RM e B
R
R
B
B
M
B
B R M B B RM eB RB B B RM
Period
1
2.7
0.5
4
6
2
4.7
1.3
2
2.7
0.5
1
6
0.5
3.2
2.8
3
2.7
0.5
5
2
2.5
5.2
−3.2
4
2.7
0.5
2
4
1.0
3.7
0.3
5
2.7
0.5
1
2
0.5
3.2
−1.2
Hence, the systematic return will remain 2.7% for all periods. The unsystematic
return will be 1.3% for period 1, 2.8% for period 2, −3.2% for period 3, 0.3% for period
4 and −1.2% for period 5.
Chapter: 7
4.
The annual returns of Wonder Widgets, Inc. and the S&P 500 Composite Index over
the last ten years were as follows:
Year
1
2
3
4
5
Wonder Widgets
−15%
10%
12%
20%
−20%
Copyright © 2014 John Wiley & Sons, Inc.
S&P 500
−8.5%
4.0%
14.0%
15.0%
−14.0%
Part 2 - 13
Modern Portfolio Theory and Investment Analysis, 9th Edition
Test Bank
6
7
8
9
10
−15%
25%
30%
−10%
3%
−26.0%
37.0%
24.0%
−7.0%
6.5%
Find the following for Wonder Widgets:
a.
Beta (βW, slope of regression line)
b.
Alpha (W, intercept of regression line)
c.
Unsystematic variance (σ2W − β2Wσ2m)
d.
Correlation coefficient (ρ)
Answer:
Year
Rit
RMt
1
2
3
4
5
6
7
8
9
10
Total
Mean
−15
10
12
20
−20
−15
25
30
−10
3
40
4
−8.5
4
14
15
−14
−26
37
24
−7
6.5
45
4.5
R
it
R it
−19
6
8
16
−24
−19
21
26
−14
−1
Rmt Rmt Rit Rit Rmt Rmt Rmt Rmt
2
−13
−0.5
9.5
10.5
−18.5
−30.5
32.5
19.5
−11.5
2
247
−3
76
168
444
579.5
682.5
507
161
−2
2860
imt 10 Rit R it
a. Beta: i 2
10
mt t 1
R
mt
R
mt
t 1
169
0.25
90.25
110.25
342.25
930.25
1056.25
380.25
132.25
4
3215
321.5
Rit i i Rmt 2
55.29
41.54
0.21
44.26
56.80
66.31
62.84
74.70
14.19
7.74
423.88
R
it
R it
2
361
36
64
256
576
361
441
676
196
1
2968
296.8
R mt 2860
= 0.89
2
3215
R mt
b. Alpha: i R it i R mt 4 0.89 4.5 = −0.0031
2
1 10
c. Unsystematic Variance: e i Rit i i Rmt
10 t 1
1
2 e i 423 .88 = 42.388
10
2
d. Correlation Coefficient: im
im
i m
i m
i
= 0.89
321 .5
296 .8
= 0.93
Part 2 - 14
.
Modern Portfolio Theory and Investment Analysis, 9th Edition
Test Bank
Chapter: 7
5.
You are the pension fund manager for a major university with $100 million in an
index fund that invests in the S&P 500 stocks. (The fund holds all the stocks in the index in
proportion to their market values.) Due to recent pressure from student groups, the
regents have decided to divest themselves of the stocks of firms that invest in South
Africa. You estimate that this will eliminate 100 of the 500 stocks in your portfolio. You have
been asked to evaluate the effect of the divestiture decision. You estimate that the
correlation between acceptable and eliminated stocks is 0.6. You also have the
following data:
Acceptable Stocks
400
$3 billion
1.0
25%
Number of Firms
Total Market Value
Average Beta
Standard Deviation
a.
b.
c.
Eliminated Stocks
100
$2 billion
1.25
30%
What will the effect of the divestment be on the beta of your portfolio?
(Report the beta before and after the divestment.)
How will divestment affect the standard deviation of your portfolio? (Report
the standard deviation before and after the divestment.)
Assume that the standard deviation of the overall market is 20%. What is the
effect of divestment on the proportion of your portfolio's risk that is
unsystematic? (Report the proportion before and after the divestment.)
Answer:
a.
X
i
i
3 2
1 1.25 1.1 (Before divestment)
5 5
After divestment, the Beta is given as 1.
2
b. P
N
N
N
X i i X i X j ij
2
2
i 1
i 1 j 1
2
2
3
2
3 2
P 0.25 0.3 2 0.25 0.3 0.6 = 24.19% (Before
5
5
5 5
divestment).
After divestment, the standard deviation is given as 25%
c. If the standard deviation of the overall market is 20%, and the standard
deviation of the portfolio before divestment was 24.19%.
n
i 1
2 P P 2 m 2 X i 2 2 ei
2
0.0585 1.1 0.20 X i 2 ei
i 1
n
Copyright © 2014 John Wiley & Sons, Inc.
Part 2 - 15
Modern Portfolio Theory and Investment Analysis, 9th Edition
Test Bank
n
2 2
X i ei 1.01% (unsystematic risk before elimination)
i 1
0.25 2 1 0.20 X i 2 2 ei
n
i 1
2 2
X i ei 2.25% (unsystematic risk after elimination)
i 1
n
Chapter: 7
6.
A security analyst works for a large institution that uses the single-index model as
part of its portfolio-management scheme. The security analyst believes the following
values are relevant for the four stocks she follows
2
15 ;
R A 14% ; R B 12% ; R C 8% ; R D 11% ; A 2.0 ; B 1.5 ; C 1.0 ; D 1.0 ; eA
2
2
2
9 ; eD
eB
7.5 ; eC
10 .
The institution assumes that the risk-free rate is 6%, and short selling is not allowed. The
institution accepts the Sharpe single-index model and uses the procedure described by
Elton, Gruber and Padberg (EGP) to determine the optimum risky-asset portfolio for the
institution to hold. The procedure is to compute
Zi
i
ranking criterion for asset i C *
2
ei
where the ranking criterion is as described by EGP and where C* depends on all risky
assets the institution holds. The institution's management has determined that C* = 3.
a.
b.
c.
Answer:
Which stocks that the analyst follows will be held in the institution's optimum
portfolio?
If the sum of the Zi's for all the institution's stocks in the optimum portfolio is
equal to 4, what fraction of the institution's optimum portfolio will each of
the stocks that the analyst follows represent?
Why should ei2 (diversifiable risk) enter into the optimal solution?
Security
Mean Return
A
B
C
D
14
12
8
11
Excess
Return
Beta
8
6
2
5
2
1.5
1
1
( Ri RF )
Excess
Return over
Beta
4
4
2
5
i
ei 2
0.1333
0.2000
0.1111
0.1000
a. if C * 3 , the stocks A, B, and D can be held in the optimum portfolio, as their
Part 2 - 16
.
Modern Portfolio Theory and Investment Analysis, 9th Edition
Test Bank
excess return over Beta is higher than the cutoff rate.
b. If the sum of Zi 's for all the institution’s stocks in the optimum portfolio equals 4,
the fraction of the institution’s optimum portfolio will be represent as ZA/4, ZB/4, and
ZD/4.
Hence, in this case, the fraction of the institution’s optimum portfolio can be found
by using the following equation:
i
ei 2
Ri RF
C
i
Z A 0.1333 4 3 0.13
Zi
Z B 0.20 4 3 0.20
Z D 0.10 5 3 0.20
Therefore, the fraction of the portfolio is ZA =0.13/4, ZB = 0.20/4, and ZD = 0.20/4.
Therefore, Stock A has a proportion of 3%, Stock B has a 5% proportion and Stock D
has a proportion of 5%.
c. ei2 is denoted as the variance of a stock’s movement that is not associated
with the movement of market index. The residual variance plays an important role
in determining how much to invest in each security.
Chapter: 9
Essays
1.
What is a stock's own variance and what is the covariance between two stocks if
one accepts the Sharpe single-index model? Explain why each is what it is.
Answer:
In a single-index model for expected return, a security’s variance has two parts, unique
risk and market-related risk. The covariance depends only on the market risk. That is why
the single-index model implies that the only reason securities move together is a common
response to market movements.
The model’s basic equation is Ri i i Rm ei . Where, i denotes the expected value
of the component of return insensitive to the return on the market, ei represents the
random element of the component, and is the constant Beta used to measure the
expected change in return on the security in comparison to the return on markets. The
2
variance of return on any security is i2 E Ri Ri . From this we understand that the
variance of ei E ei 2 ei . The covariance between any two securities is described
2
as i j E Ri Ri
R
j
R j . After substituting the returns and average returns of the
securities with the single-index model, we get the stock’s variance and the covariance
between two stocks. We can hence find that the variance of a security’s return is
Copyright © 2014 John Wiley & Sons, Inc.
Part 2 - 17
Test Bank
Modern Portfolio Theory and Investment Analysis, 9th Edition
2 i 2i 2 m + 2 ei and the covariance of two securities is ij i j 2 m .
Chapter: 7
More download link:
modern portfolio theory and investment analysis test bank free
download sample
modern portfolio theory and investment analysis solution manual
modern portfolio theory and investment analysis pdf
modern portfolio theory and investment analysis 8th edition pdf
download
modern portfolio theory and investment analysis elton pdf
modern portfolio theory and investment analysis, 9th edition pdf
modern portfolio theory and investment analysis 9th edition pdf
download
modern portfolio theory and investment analysis 6th edition pdf
modern portfolio theory and investment analysis 9th edition
solutions
modern portfolio theory and investment analysis solution manual
Part 2 - 18
.