Supercharge your trading investment account using wyckoff volume spread analysis
Bạn đang xem bản rút gọn của tài liệu. Xem và tải ngay bản đầy đủ của tài liệu tại đây (3.6 MB, 166 trang )
Supercharge Your Trading &
Investment Account Using Wyckoff /
Volume Spread Analysis
Danny Younes
Copyright © 2017 Danny Younes
All rights reserved.
ISBN-10: 1542517133
ISBN-13: 978-1542517133
CONTENTS
Foreword
Why I Wrote This Book
1
4
6
Introduction
1 How the Markets Really Work
14
2 How, When & Why Markets Go Up and Down
18
3 What are Options
25
4 The Key to Using Options to Generate a Monthly Income
40
5 Minimize Risk = Buy Insurance
50
6 Basics of Technical Analysis
70
7 How Wyckoff / Volume Spread Analysis Can Assist You in Your 84
Trading Decisions
8 Covered Call / VSA Stock Selection Criteria
109
9 How to Find Trading Candidates Using the TradeGuider End of
Day Software
130
10 Trading Plan
11 The Future of Volume Spread Analysis
140
158
DEDICATION
To my amazing wife, Georgette and my three children Nicholas, Jacob
and Joshua. Thank you for giving me the strength to keep on keeping on.
You guys are my rock.
FOREWORD
Foreword by Gavin Holmes, Author, “Trading in the Shadow of the Smart
Money”
I had the good fortune to connect with the Author of “Supercharge Your
Trading & Investment Account Using Wyckoff / Volume Spread Analysis”
Danny Younes, several years ago, as an aspiring student of the works of the
great traders and investors, Richard D Wyckoff and the late Tom Williams
who passed away just before this book was published.
Danny became a customer of TradeGuider Systems, the company that owns
the Wyckoff / Volume Spread Analysis trading and investing methodology
that Danny shows you in this book.
Danny attended many courses and webinars and was personally coached by
Tom Williams and myself, so I am extremely proud of his achievement with
this work which I know Tom would have been extremely proud of as well.
As an author myself, I know how difficult actually writing a book is, but I
can say without a doubt that Danny has produced in this work one of the
finest books on the Wyckoff / Volume Spread Analysis trading method
currently available.
In “Supercharge Your Trading & Investment Account Using Wyckoff /
Volume Spread Analysis” Danny goes well beyond the basic principles of the
Wyckoff / Volume Spread Analysis method, by introducing trading strategies
using options that can be used once a stock has been located as a possible buy
or sell based on accumulation and distribution.
As with anything in life, you need to be motivated to achieve your goals, and
Danny reminds us of this in each chapter with very poignant quotes from Les
Brown, Eric Thomas, Tony Robbins and Steve Jobs.
Trading and Investing in the financial markets has never been easier to access
thanks to the internet, and more and more retail traders are getting involved
from all over the world. In the book, Danny explains in detail the traps that
get the uninformed “herd” traders into bad positions and shows through
detailed charts and news clippings how the mainstream media is used to
wrong foot this group into making very poor trading and investment
decisions.
Danny’s experience trading options is extensive and he explains in great
detail strategies that you can use right now to grow your account and mitigate
your risk by insuring your positions, something many traders and investors
will be totally unaware off.
The book is easy to read and the charts clearly show the key principles that
all traders and investors should understand before they risk real capital in the
markets. Danny generously shares with us his personal trading plan at the end
of the book and this really brings the book together perfectly so the reader
can take immediate action on the knowledge they have received.
Like me, Danny’s mission is to enlighten and help the uninformed traders and
investors who get fleeced by Smart Money if they do not have the correct
knowledge.
In “Supercharge Your Trading & Investment Account Using Wyckoff /
Volume Spread Analysis” Danny has achieved that objective in a clear, easy
to understand book that evens the odds for the retail trader and investor and
lifts the fog on how the financial markets REALLY work.
I hope you enjoy the book as much as I did and I have already taken two
strategies from the book for use in the Wyckoff / Williams Investment
Portfolio Hedge Fund that I am running.
Gavin Holmes 27/12/2016
WHY I WROTE THIS BOOK
There are various reasons why I wrote this book but there is one main reason
and that is to assist the retail trader. From my experience the retail trader always
loses out and it’s my mission to educate as many people as I can. There are two
road blocks that face the retail trader:
1. The financial markets are manipulated. I will explain in my book why the markets
are manipulated but more importantly how you can identify when the markets are
being manipulated and how to trade in harmony with the professional traders, often
referred to as the “Smart Money”.
2. The other reason is that many educators that teach retail traders how to trade the
financial markets use indicators that are lagging and most investors are getting into
poorly conceived trades based on these indicators. Indicators such as MACD, RSI
or Stochastics are based on mathematical formulas and when they notify you of an
entry the markets more often than not, will do the very opposite. These educators
mean well with the education they supply to their customers, however, there are
some customers who do make in trading. It is now recognised there is a large
number of traders and investors that do not make it in the markets, consistently
blowing up one’s account. It comes down to being disciplined and having the belief
in the strategy that you are trading and most traders and investors do not have that
belief and enter trades that are poorly conceived.
When I started, I was getting into poorly conceived trades, when pricing action
broke out of consolidation I would get in on a trade. I would see an increase in
volume, the MACD indicator will tell me ‘it’s a buy’ only to find pricing action
going the other way. I needed to find a solution to this issue that I was having and I
came across TradeGuider. TradeGuider opened my eyes to how the financial
markets really work and I am grateful that we have crossed paths. One thing I have
in common with the CEO of TradeGuider, Gavin Holmes is that we want to spread
the word around the world about how the markets really work and to educate as
many retail traders as we can.
I also wanted to pay tribute to the late Tom Williams, the inventor of Volume Spread
Analysis, who through his work has certainly assisted many traders around the
world with their trading. His dream of computerizing the Wyckoff method of trading
has certainly come to fruition over the last fifteen years and it’s through his work I
can bring you this book. Thank you, Tom, for sharing your wisdom, you will be
missed, may you rest in peace.
I hope you gain a lot of value from this book and that it assists you in your trading. If
you have any questions or you want to know more about the trading method that I
discuss in this book, please email me,
At the start of every chapter I have provided you with motivational quotes from the
likes of Les Brown, Eric Thomas, Tony Robbins and Steve Jobs. Their words
propelled me to write this book and I hope their words will also inspire you to fulfill
your dreams.
INTRODUCTION
“The truth that will set you free, it’s the truth you don’t want to hear. You’ve
got to change, you’ve got to take responsibility for your stuff. You’ve got to
clean your act up. You’ve better get your life together; you’ve got genius in
you. Challenge yourself, push yourself, make yourself come up with
something. Use your imagination. So what, you fell flat on your face, so what.
Learn from the experience and start again, don’t count yourself out. Forget
about the mistakes yesterday, forget about all your failures yesterday, forget
about all you had, that’s not important. Only thing that we have is right now.
What you will find is that you will know more than you realize that you know.
That you're more creative and more resourceful that you realize that you are.
See the universe responds to the man or woman that refuses to be denied.
That business that you want, that dream that you have of controlling your
destiny, that is yours, that power to create that is yours, that’s available to
you, but you have got to be willing to stand there and face disappointment,
not have support, be lonely, doubt yourself sometimes, be rejected again and
again and again, become bankrupt if necessary. If it’s difficult so what, if it’s
inconvenient, so what, don’t sentence yourself to a lifetime of being
miserable, a lifetime of being broke, a lifetime of being unhealthy, a lifetime
of being in a relationship that is no longer fulfilling to you. You are a human
being, don’t volunteer your life that way. Your life has too much value to the
universe, you’ve got something to contribute, you’ve got something to give,
but the challenge is to hold on, and if you hold on tenaciously, I say the
universe is on your side.” – Les Brown
When it comes to investing in the stock market, the most popular strategy is
the Buy, Hope, and Pray. Investors buy an instrument and hope it moves in
your direction to make money. There is no certainty in this strategy and when
it comes to investing, I want to put the probabilities in my favour and get as
close to certainty as I can. Buying and holding stocks is so 1980s, because it's
a time bomb waiting to go off. I want you to think about the following, if you
buy a parcel of shares:
Do you make money if the stock price goes up?
Do you make money if the stock price goes down?
Do you make money if the stock price goes sideways?
There is only one scenario where the investor will make money and that is if
the stock price goes up. So why do investors invest this way? They have only
one-third of an opportunity in making money. The one thing it comes down
to is that most investors are not educated. You don't know what you don't
know.
There is another interesting fact that I want to share with you. Most investors
invest in the stock market where they have 100% risk, meaning there is
a possibility that they may lose 100% of their money. There is that chance
that a stock that you’re investing in, can fall very sharply or in some cases, I
have seen companies that have been delisted from an exchange. Take for
example at the height of the financial crises we had Lehman Brothers file for
bankruptcy, and other bankruptcies prior to the GFC such as WorldCom and
General Motors just to name a few.
Let's face it, most retail investors invest in the stock market with their hard
earned after tax dollars which they cannot afford to lose. Still, they invest in
the stock market with 100% risk and this doesn't faze them. It doesn't faze
them as they don't look at trading from a risk management point of view.
They only think about it from a profit taking point of view and completely
ignore the downside.
Did you know that you can save so much heartache and money if you
purchased an insurance policy on your shares? Let me share with you a reallife example which I think will hit home for you.
Prior to the Global Financial Crisis (GFC), BHP Billiton Limited (BHP) on
the Australian Stock Exchange (ASX) reached the highs of AUD$45.30. Let's
say you entered this stock at AUD$45.30 because it broke a resistance level.
The stock is on a magnificent run and you fear missing out on this fabulous
up move and everything seems to be positive for the stock. You see articles
about the company stating "Shares in BHP Billiton have jumped on fresh
speculation, a Chinese investor is eyeing up to a 9% stake in the company.
China is the biggest consumer of iron ore and the move would help China
secure supplies of key raw materials, such as iron ore and oil, needed to fuel
its booming economy". The news is positive on BHP, and you invest in the
stock thinking you are on a sure winner.
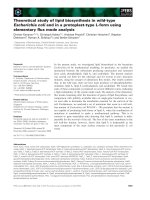
Figure 1: BBC news article, Chinese whispers fuel BHP shares
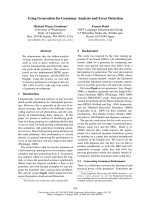
In a matter of six months, BHP plummeted from AUD$45.30 to a low of
AUD$18.12. How would you feel if you had entered BHP at AUD$45.30,
only to see it 6 months later at AUD$18.12? One word would describe how
you'll feel, devastated. The news around the stock at the highs was positive,
surely you were on a winner. So why didn't the stock perform, it's a safe
investment, it's a blue-chip stock?
I will show you later in this book how the financial markets are manipulated
by the professional traders (Smart Money) and that all is not what it seems in
the markets.
The stock of BHP is now trading at AUD$18.12, and all you can think of is
not losing all your hard-earned money. The pain in staying in a trade which is
losing you money is unbearable, so you exit out of the trade with a loss.
What if this was a long-term investment such as in your retirement account?
The investment fund that you invest in has purchased BHP at these highs and
investment funds usually invest in safe blue chip stocks. It's August 2016 as I
write this book, BHP is only trading at around AUD$21.00. It hasn't gone
back up above AUD$45.30 in the last eight years.
Figure 2: Stock chart of BHP
It has been eight years and the stock has not produced a positive result. Let’s
say you held onto the investment for the long-term. Holding onto a stock that
is not producing a result is not an ideal investment. You’re no longer looking
at making a profit, you just want your initial investment back, as you'll be
satisfied with achieving a break-even result.
If I told you that there was an investment opportunity where you had only
one-third of an opportunity in making money, would you consider this
investment opportunity? Most investors will not consider it, but a lot of
traders and investors invest by Buying, Hoping, and Praying. Let’s face it
they are not stacking the odds in their favour.
What I'm about to reveal to you is a trading strategy that has been around
since the 1970s and many people do not know that it exists. It's a strategy that
several governments around the world allow you to invest your retirement
account because it's a safe strategy and it's much safer than Buying, Hoping,
and Praying and you'll come to realize this as you read through this book.
You will kick yourself for not knowing about it earlier. If you knew about
this strategy, your trading & investment account would look very different
today.
How would you feel if I told you there was a strategy where you can generate
an income from your share portfolio regardless of whether the stock goes up,
down or sideways, you will still make money? You’re probably thinking that
this can't be true, but it is true, it's been around for over 40 years and it's a
strategy that works for many traders and investors who have embraced it. The
strategy is called the “Covered Call" and it’s a strategy where you can
supercharge your trading and investment account. Excited? I bet you are and
I am excited to be sharing this with you.
It's all well and good for me to show you a strategy that you can implement,
but what most traders and investors want to know is ‘How do I find these
trading opportunities?’ Throughout this book, I will share with you a
methodology known as Wyckoff/Volume Spread Analysis (VSA). VSA will
assist you in finding imbalances of supply and demand in the financial
markets and this knowledge would have prevented you from investing into
BHP back in 2008.
Most traders are aware of the two widely known approaches used to analyze
a market; fundamental analysis and technical analysis. Many different
methods can be used in each approach, but the fundamental analysis is
concerned with the question of why something in the market will happen, and
technical analysis attempts to answer the question of when something will
happen. Volume Spread Analysis, however, is a third approach to analyzing
a market. It combines the best of both fundamental and technical analysis into
a singular approach that answers both questions of 'why' and 'when'
simultaneously.
1
HOW MARKETS REALLY WORK
“You can’t connect the dots looking forward, you can only connect looking
backward. So you have to trust somehow, that the dots will connect somehow
in your future. You have to trust in something, your gut, destiny, life, karma
or whatever. Because believing that the dots will connect down the road, will
give you the confidence to follow your heart, even when it leads you off the
well-worn path. And that will make all the difference. Your time is limited, so
don’t waste it living somebody else’s life.
Don’t be trapped by dogma, which is living with the results of other people’s
thinking. Don’t let the noise of other people's opinion drown out your own
inner voice. You’ve got to find what you love and that is true for your work as
it is for your lovers. Your work is going to fill a large part of your life, and
the only way you are going to be truly satisfied is to do what you believe is
great work, and the only way to do great work, is to love what you do. If you
haven’t found it yet, keep looking and don’t settle. Have the courage to follow
your heart and intuition, they somehow already know what you truly want to
become.” – Steve Jobs
Welcome to the largest business in the world. Every day billions of dollars
exchange hands in the world stock markets, financial futures and currency
markets. Trading these markets is by far the biggest business on the planet.
The average person has no idea what drives the financial markets. Even more
surprising is that the average trader doesn't know what drives the markets
either. So, despite financial trading being the largest business in the world, it's
also the least understood business in the world.
Sudden moves are a mystery, arriving when they are least expected,
appearing to have little logic attached to them. Frequently the market does the
exact opposite of a trader’s intuitive judgment. Even those people who make
a living from trading, particularly the brokers and the pundits, who you
would expect to have a detailed knowledge of the cause and effect in their
chosen field, very often know little about how the markets work.
Essentially the financial markets show a lot of similarities within the other
types of markets. If you look, for instance at a street market, it consists of
four things; location, items for sale, buyers, and sellers. The location is
known as a place to buy and sell items. The prices advertised by the seller is
what the seller thinks they can get based on the competition in the location
and the demand for the products by the passing buyers. In a buyers’ market,
the prices fall and in a sellers’ market, where the demand is high, they rise.
The financial markets are not much different. Instead of antiques, clothes, and
food, what's been sold here are stocks, commodities, currencies and
derivatives. Buyers purchase stocks and commodities through the trading
exchanges such as the New York Stock Exchange (NYSE) or the Australian
Stock Exchange (ASX). The sellers also sell through the exchanges with both
sides using brokerage firms to transact the business.
Stock markets grew out of small meetings of people who wanted to buy and
sell their stocks. These people realized that it would be much easier to make
trades if they were all in the same place at the same time. Today, people from
all over the world use the stock markets to buy and sell stocks in thousands of
different companies.
New issues of stock must be registered with the relevant exchange, such as
the U.S. Securities and Exchange Commission or the London Stock
Exchange. A prospectus giving details about the companies’ operation and
the stock to be issued is distributed to interested parties. Investment bankers
buy large quantities of the stock from the company and re-sell the stock on
the exchange.
Sitting between the markets and buyers and sellers are the brokerage firms.
These firms act as an intermediary between the market and buyer or seller. A
potential buyer places an order with a broker for the stock he/she wishes to
purchase. The transaction takes place when someone wants to sell and
someone wants to purchase at the same price.
When you purchase a stock, you receive a stock certificate. The certificate
may be issued on paper or issued electronically. It may be transferred from
one owner to another or it can be held by the broker on behalf of the investor.
What Affects the Markets?
There are several factors that affect the markets. They are individual,
institutional, mutual funds and investors all affect market prices. If a large
number of people want to buy a certain stock, the price of the stock initially
is going to rally. Just as if there were many people bidding on an item at an
auction. Both the condition of the individual business and the strength of the
industry that it's in, will affect the price of its stock. Profits earned, the
volume of sales and even the time of the year will also affect how much an
investor wants to own a stock.
Governments make all kinds of decisions that affect how much an individual
stock may be worth and what sort of instruments people want to be investing
in. The governments interest rates, tax rates, trade policies and budget deficits
all impact prices.
General trends that signal changes in the economy are watched closely by the
investors to predict what is going to happen next. Indicators include the gross
national product, the inflation rate, the budget deficit and the unemployment
rate. These indicators point to changes in the way ordinary people spend their
money and how the economy is likely to perform.
Events from around the world and changes in currency values, trade barriers,
wars, natural disasters, epidemics and changes in government all affect how
people think about the value of different investments and about how they
should invest in the future.
Today, investments can be bought and sold around the clock. When the
Tokyo markets have just closed, for example, the London market takes over,
and when London closes the New York exchanges take over. When big
moves in price occur in one market, the other markets can be affected too.
A bull market and a bear market are terms used to describe market trends. A
bull market is a period when prices are generally rising. If investors feel that
they will be in a bull market, they will feel confident in investing, adding to
the growth of the market.
A bear market is a period when stock prices are generally falling. If investors
think that the markets are generally falling, they will sell stock at lower
prices. Each of these markets is fueled by investors’ perceptions of where the
economy and markets are going. These trends can quickly change.
The first secret in learning trading successfully is to forget about the intrinsic
value of stock or any other instrument. What you need to be concerned with
is its perceived value, its value to the market and not the value that it
represents as its interest in the company. This is a contradiction that
undoubtedly mystifies the directors of strong companies with a low stock
value. From now on it's the perceived value which is reflected in the price of
the stock.
2
HOW, WHEN AND WHY MARKETS GO UP
AND DOWN
“Fear kills dreams, fear kills hope, fear puts people in the hospital, fear can
age you, can hold you back from doing something that you know within
yourself that you are capable of doing, but it will paralyze you.” – Les
Brown
All markets move up and down, none stay static, why? They move as the
result of market forces, essentially all markets are moved by supply and
demand. If more people want to buy, demand will overcome supply and
prices will move up. Conversely if more people want to sell than buy, supply
will overcome demand and prices will fall.
So, who trades the markets?
The markets are traded by a number of trading entities. Most people will be
aware of three entities. The first group being retail traders, people like you or
me who trade the markets either as a full-time job, or part time for a second
income or as a hobby. If we are trading full time, then we will place trades in
the live markets. If we trade as a hobby, we might take position trades on a
daily basis.
The second group is the pension funds who trade longer term positions,
holding stocks for week or months. The final group controls about 85% of the
money in the markets and they are what we call the “Smart Money”. They are
made up of hedge funds, private trading syndicates, and investment banks.
These entities have the power to move the markets. These professional
players sell at the top of the market and buy at the bottom. In between, they
have to move the markets by making them rise and fall. To do this, they use
the emotions of greed and fear to herd the majority of traders into the wrong
side of the market.
They have developed many ways of wrong-footing the retail investor and
trader and one of their biggest weapons is the unwitting media. Here are just
a few examples. Let's start with the British Petroleum oil spill disaster in
2010. On the 25th June 2010, the stock price of BP fell to just under $27.00.
The news was grim. The pundits and reporters were talking in terms of huge
losses and a possible breakup of the company and everyone who had stock
was looking to sell from the expectation that prices were plummeting. Sell
they did, straight into the hands of the smart money, professionals who
bought cheap. Within six months the price of the stock doubled. Buy cheap,
sell back when the market rises, that's how the game’s played.
On May 6th, 2010, something very strange happened in the financial markets.
This day is now referred to as the flash crash because no credible explanation
has ever been provided by the regulatory authorities as to exactly what
caused the crash, or who was responsible. In fact, many investors began to
suspect that all was not what it seemed to be. CNBC's 'Closing Bell" anchor
Maria Bartiromo was reporting on the day the 'Flash Crash' happened. Below
is the transcript of fellow reporter Matt Nesto explaining to Bartiromo some
unusual anomalies in several stocks, even though the mainstream media
claimed that it was caused by a lone trader from a major banking institution
hitting the wrong button. 'B' for billion was entered instead of a 'M' for
million while trading the CMS eMini S&P Futures. The conversation went as
follows:
NESTO: "A person familiar with the Citi investigation said one focus of the
trading probes were the futures contracts tied to the S&P 500 stock index
known as the eMini S&P 500 futures, and in particular, that two-minute
window in which 16 billion of the futures were sold... Again, those sources
are telling us that Citigroup's total eMini volume for the entire day was only
9 billion, suggesting that the origin of the trades was elsewhere."
Nesto named eight stocks that were hit with the supposed computer error/bad
trade that went all the way down to zero or one cent, including Exelon
(NYSE:EXC), Accenture (NYSE:ACN), CenterPoint Energy (NYSE:CNP),
Eagle Material (NYSE:EXP), Genpact Ltd (NYSE:G), ITC Holdings
(NYSE:ITC), Brown & Brown (NYSE:BRO), Casey's General
(NASDAQ:CASY) and Boston Beer (NYSE:SAM)
NESTO: "Now according to someone else close to Citigroup's own probe of
the situation, the eMinis trade on the CME. Now, Maria, I want to add
something else, just in terms of these erroneous trades that Duncan
Niederauer; the NYSE CEO was talking about. I mean, we've talked a lot
about Accenture, ACN. This is a Dublin-based company. It's not in any of the
indexes. If you look in the S&P 500, for example, I show at least two stocks
that traded to zero or one cent - Exelon and CenterPoint. If you look in the
Russel 1000, I show Eagle Materials, Genpact, ITC and Brown & Brown,
also trading to zero or a penny, and also Casey's General Stores, as well as
Boston Beer trading today, intraday, to zero or a penny. So they have at least
eight names that they're going to have to track down on top of the Accenture
trade, where we have the stock price intraday showing us at least, we'll
assume, a bogus trade of zero."
When Matt Nesto called these trades 'bogus', host and CNBC veteran Maria
Bartiromo looked shocked and a little angry and replied:
BARTIROMO: "That is ridiculous, I mean this really sounds like market
manipulation to me. This is outrageous."
According to Nesto, these are frequent occurrences, at least at the NASDAQ
exchange, and if you make a trade and lose money, there's no recourse.
NESTO: "It happens a lot. It really does. I mean, we could probably ask the
NASDAQ, they may not want to say how often it happens, but it happens
frequently. And they go back and they correct. And the thing that stinks is if
you, in good faith, put in a trade and made money and then lost it, you lose it.
And there's no recourse and there's no way to appeal."
What we witnessed on May 6th, 2010 was a giant shakeout of the market.
The Smart Money were expecting higher prices and wanted to catch the retail
traders by marking the price down heavily, before moving the price up. They
were bullish, the stocks were going to rise and they wanted to buy at the best
possible price. Wouldn't you want to do the same? Buy at the lowest price,
knowing you can sell it for much more than you bought it for. That's the
trading game, buy low sell high.
Be a predator, a clever predator that understands exactly how the prey thinks
and act. It's like herding sheep, steering them, rounding them up and locking
them in a pen.
In 2009, gas and petrol prices skyrocketed around the world and oil was
supposed to be in scarce supply. Some of the world’s top oil analysts were
predicting a price of $200 per barrel. You can appreciate for yourself, just
how influenced someone can become when you see and hear information that
all points in one direction. In this case, oil was to go to $200 per barrel, and
many traders and investors and indeed even the airlines got caught up in
the maelstrom of higher prices. A headline in the New York Times stated;
"An Oracle of oil predicts $200 a barrel of crude" on May 21st, 2009. Exactly
three weeks later the price of crude oil plummeted.
In April 2011, silver was very much in the news as the commodity to invest
in. The price had steadily risen towards $50 and all the news was about the
relentless rise of silver. This commodity had a very bullish medium term
outlook and once again, retail traders bought in abundance, anxious not to
miss out. Later in 2011, silver crashed once the smart money had finished
distributing at the highest price, so maximizing their profit.
CNN Money reported; "J.P. Morgan scores big in latest quarter" is the
headline 14th October 2009. The words strongest performance, towered
above Wall St expectations are used directly below the headline. All the news
is now bullish; the stock is going up and up because it's in an uptrend. To the
retail trader and the investing community, this appeared to be a great
opportunity to buy, because everything lined up and if you didn't go to the
market by now, you missed the move. So, you buy, buy, buy. What
happened? The stock plummeted spectacularly and the uninformed retail
trader said bye bye to their capital.
These are just very few examples; the reality is that all markets are moved to
a greater or lesser extent the same way and it's why a small and enlightened
minority of traders are successful in the markets. So we have seen how
markets rise and fall, and why they fall. So how do you know when markets
will change direction.
Traditionally, there have been two ways to try and predict price movement,
by technical analysis and fundamental analysis. Let's begin with technical
analysis. Wikipedia defines technical analysis as "a security analysis
discipline for forecasting the future direction of prices through the study of
past market data." Another definition, this time from City Index is "Analysis
of a financial market by charting its performance using historical patterns,
and focusing on trends."
There are many technical analysis tools and methodologies out there, some
like Bollinger Bands, MACD, and Stochastics, use mathematical formulas to
identify trends. Others like Fibonacci and Elliot Wave use historical patterns.
In summary, technical analysis tools look at historical price movement and
based on the price action, you can determine to some level where the price
will go. By looking at charts, you can identify trends and patterns which will
help you find good trading opportunities.
Fundamental analysis is a way of looking at the market through economic,
social and political forces that affect supply and demand. In other words, you
look at what economy is doing well and whose economy is strong. The idea
behind this type of analysis is that if the country’s economy is doing well,
their currency will also be doing well. This is because the better the country’s
economy the more trust other countries have in that currency.
Both these analysis models can provide valuable help for traders and
investors. The question arises, well if they're good, why do over 90% of
people lose money in the markets? Well, the actual day to day movement of
the market is shrouded in deep, dense fog, which is why the technical and
fundamental analysis approach cannot be sufficiently successful on their
own. That fog is deliberately generated by the market makers and the trading
syndicates to force you, the retail trader, onto the wrong side of the trade.
Technical analysis tools try to predict price movement, by analyzing in
various ways what the market is going to do, based on what it did
historically. It's a bit like trying to predict what the weather is going to do
tomorrow based on what it did in a similar period historically.
That would be a more successful approach if the market behaved
consistently, unfortunately, it appears to be unpredictable. The reason for this
is that the smart money, the trading professionals constantly monitor both
sides of the market, and know exactly when to move the market as it wrongfoots the retail traders. The “Smart Money” do it in a very subtle and clever
way, which are invisible, hidden in the fog. This means just as your technical
analysis indicators tell you to enter the market, the market turns and you are
locked in at higher prices and you've lost.
So, technical analysis on its own cannot alert you to the real movements in
the markets, because the market does not work in a vacuum. Going back to
that real street market, if you are not an enlightened expert, knowing exactly
what to look for, how likely are you to find a bargain when the people that
you are buying it from are full-time experienced traders? The same is true in
all the financial markets.
Fundamental analysis relies on research, whether it's researching an economy
or its currency, commerce or individual company performance. That research
requires reading articles, reports and listening to the news. Taking too much
notice of incoming news stories and reports in the media is one of the main
reasons why traders and investors make very poor trading and investing
decisions at the wrong time. Here is an example, the chairman of the Federal
Reserve appears on television, and makes what appears to be a bearish
statement. The markets fall alarmingly in response to this news.
The news reporter appears grim-faced on television, reporting why the
market has fallen today - "The market has fallen dramatically today, on
negative statements made by the chairman of the Federal Reserve." To add to
the impact and drama of the announcement, any other negative information is
collected to support the story.
Why is the news release leading you astray and harming your trading?
Because this is how the news should have been reported; "The market has
fallen alarmingly today. Bearish statements made by the chairman of the
Federal Reserve, caused the professionals to mark the market down, in a
maneuver to discount the negative news. This had an effect on weak holders
and uninformed traders, causing them to panic sell their holdings to
professional traders, who have been waiting for this opportunity to buy at
lower prices."
It was highly likely professional traders, the “Smart Money”, were fully
aware of the forthcoming press release well in advance of the announcement,
and they were ready to absorb the huge amount of stock. They stand to profit
handsomely in the days ahead as a result of the successful and expertly timed
operation. Fundamental analysis can't accurately point to price movement
because the media is all too often manipulated and used by the smart money
to wrong foot the retail trader.
Remember it's perceived value and not actual value. There is another