International financial and management accounting lesson 04
Bạn đang xem bản rút gọn của tài liệu. Xem và tải ngay bản đầy đủ của tài liệu tại đây (1.23 MB, 10 trang )
UNIT II
LESSON
4
FINANCIAL STATEMENT ANALYSIS
CONTENTS
4.0
4.1
4.2
4.3
4.4
4.5
4.6
4.7
4.8
4.9
Aims and Objectives
Introduction
Definition and Classification of Financial Statement Analysis
Comparative Financial Statements
Trend Percentage Analysis
Let us Sum up
Lesson End Activity
Keywords
Questions for Discussion
Suggested Readings
4.0 AIMS AND OBJECTIVES
In this lesson we shall discuss about financial statement analysis. After going through
this lesson you will be able to:
Understand definition and classification of financial statement analysis
Analyse comparative financial statements and trend percentage analysis
4.1 INTRODUCTION
The financial statements are affording many facts though they are absolute and concrete
in terms; but not in a position to interpret and analyse the stature of the enterprise. To
analyse and interpret, the financial statement analysis is being applied across the financial
statements viz Trading, Profit & Loss Account and Balance sheet.
Under the financial statement analysis, the information available are grouped together in
order to cull out the meaningful relationship which is already available among them; for
interpretation and analysis.
4.2 DEFINITION AND CLASSIFICATION OF
FINANCIAL STATEMENT ANALYSIS
According to Kennedy and Muller
“ The analysis and interpretation of financial statements are an attempt to determine the
significance and meaning of financial statement data so that the forecast may be made
of the prospects for future earnings, ability to pay interest and debt maturities and
profitability and sound dividend policy”.
74
The entire financial statement analysis can be classified into various categories
International Financial and
Management Accounting
Comparative financial statements
Common size financial statements
Trend percentages
Fund flow statements
Cash flow statements
⇒
Ratio analysis
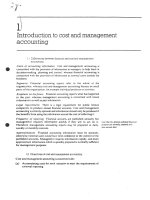
Comparative financial statements
Comparative study of Profit & Loss Accounts and Balance sheets
Comparison in between financial statements
of two or more years
Comparison in between the financial statements of various
firms or industrial average
Intra firm comparison
Inter firm comparison
Figure 4.1: Comparative Financial Statements
4.3 COMPARATIVE FINANCIAL STATEMENTS
Objectives of comparative financial statements
Changes taken place in the financial performance are taken into consideration for
further analysis.
To reveal qualitative information about the firm in terms of solvency, liquidity
profitability and so on are extracted from the analysis of financial statements.
With reference to yester financial data of the enterprise, the firm is facilitated to
undergo for the preparation of forecasting and planning.
The major part of financial statement analysis is mainly focused on the comparative
analysis.
The comparative analysis classified into four different analyses viz.:
Comparative Balance sheet
Comparative Profit and Loss account
Common Size statement
Trend percentage
First we will discuss the comparative Balance sheet.
The first and foremost important step is to have the following information and should
take preparatory steps:
i.
While preparing the comparative statement of balance sheet, the particulars for
the financial factors are required
ii.
iii.
iv.
v.
The second most important for the preparation of the comparative balance sheet is
yester financial data extracted from the balance sheet or balance sheets.
The next most important requirement to have an effective comparison with the
yester financial data is current year information extracted from the balance sheet
or balance sheet of the firms.
After having been procured the financial data pertaining to various time periods
are ready for comparison; to determine or identify the level of increase or decrease
taken place in the financial position of the firms.
To determine the level of increase or decrease in financial position, the percentage
analysis to carried out in between them.
Illustration 1
From the following information, Prepare comparative Balance sheet of X Ltd.
31st Mar,2004
50,00,000
60,00,000
10,00,000
10,00,000
30,00,000
30,00,000
10,00,000
Particulars
Equit share capital
Fixed Assets
Reserves and surpluses
Investments
Long-term loans
Current assets
Current liabilities
31st Mar,2005
50,00,000
72,00,000
12,00,000
10,00,000
30,00,000
21,00,000
11,00,000
Solution:
The first step we have to segregate the available information into two different categories
viz Assets and Liabilities.
Particulars
2004
(Rs)
2005
(Rs)
Absolute
Change (Rs)
Fixed Assets
60,00,000
72,00,000
12,00,000
Investments
10,00,000
10,00,000
N.C
Current assets
30,00,000
21,00,000
(9,00,000)
1,00,00,000
1,03,00,000
3,00,000
Total Assets
Equity share capital
50,00,000
50,00,000
N.C
Reserves & surpluses
10,00,000
12,00,000
2,00,000
Long-term loans
30,00,000
30,00,000
N.C
Current liabilities
%
Increase
%
Decrease
20
-
-
30
3
-
-
-
20
-
-
-
10,00,000
11,00,000
1,00,000
10
-
1,00,00,000
1,03,00,000
3,00,000
3
-
N. C = No change in the position during the two years.
From the above table, the following are basic inferences
The fixed assets volume got increased 20% from the year 2004 to 2005, amounted
Rs. 12, 00, 000.
Rs 9, 00, 000 worth of current assets decrease from the year 2004 to 2005 recorded
30%.
The total volume of assets recorded 3% increase from the year 2004 to 2005.
It is obviously understood that 20% increase takes place on the reserves and
surpluses.
It clearly evidenced that the current liabilities of the firm increased 10% from the
year 2004 to 2005.
The firm has not recorded any changes in the investments, equity share capital and
long-term loans.
75
Financial Statement Analysis
76
International Financial and
Management Accounting
The next one in the comparative financial statement analysis is that Income statement
analysis.
Comparative (Income) financial statement analysis: This analysis is being carried out in
between the income statements of the various accounting durations of the firm, with
other firms in the industry and with the industrial average.
This will facilitate the firm to know about the stature of itself regarding the financial
performance. It facilitates to understand about the changes pertaining to various financial
data which closely relevantly connected with the financial performance
Change in the gross sales
Change in the net sales
Change in gross profit and net profit
Change in operating profit
Change in operating expenses
Change in the volume of non-operating income
Change in the non operating expenses
The ultimate purpose of the comparative (Income) financial statement analysis is as
follows:
i.
To study the income earning and expenditure spending pattern of the firm for two
or more years.
ii.
To identify the changing pattern of the income and expenditure of the firms. The
preparatory steps for the preparation of the comparative financial statement
(Income) analysis.
The first and foremost important step is to have the following information and should
take preparatory steps:
i.
While preparing the comparative statement of Profit & Loss Account, the particulars
for the financial factors are required.
ii.
The second most important for the preparation of the comparative Profit & Loss
account is yester financial data extracted from the Profit & Loss A/c or Profit &
Loss Accounts.
iii.
The next most important requirement to have an effective comparison with the
yester financial data is current year information extracted from the balance sheet
of the firm or of the other firms.
iv.
After having been procured the financial data pertaining to various time periods
are ready for comparison; to determine or identify the level of increase or decrease
taken place in the operating financial performance of the firms.
v.
To determine the level of increase or decrease in financial performance, the
percentage analysis to be carried out in between them.
Illustration 2
Prepare the comparative income statement from the following:
Particulars
Sales
Cost of goods sold
Operating expenses
Net profit
2004
(Rs)
2,00,000
1,00,000
1,00,000
10,000
90,000
2005
(Rs)
2,50,000
1,30,000
1,20,000
10,000
1,10,000
Solution:
77
Financial Statement Analysis
Comparative Income Statement
Particulars
Sales
(-)Cost of goods sold
(-)Operating expenses
Net profit
2004
2005
(Rs)
2,00,000
1,00,000
1,00,000
10,000
90,000
(Rs)
2,50,000
1,30,000
1,20,000
10,000
1,10,000
Absolute
Change
(Rs)
50,000
30,000
20,000
N.C
20,000
%
Increase
%
Decrease
25
30
20
22.22
-
From the above table, the following inferences can be had:
The firm has registered 25% increase in sales from the year 2004 to 2005.
Cost of goods sold raised 30% from the year 2004 to 2005.
There is no change in the level of operating expenses.
The firm has got 22. 22% increase in the level of net profits from the year 2004 to
2005.
Illustration 3
From the following information, prepare a comparative income statement:
Particulars
2001 Rs
2002 Rs
10,00,000
8,00,000
Cost of goods sold
6,00,000
4,00,000
Administration Expenses
2,00,000
1,40,000
40,000
20,000
1,20,000
1,40,000
Sales
Other Income
Income tax
Solution:
Comparative Income Statement
Particulars
Sales
(–)Cost of goods sold
(–) Administration Expenses
Operating Income
(+)other income
Total Net Income Before tax
Income tax
Net Income after the tax
2001
2002
(Rs)
10,00,000
6,00,000
4,00,000
2,00,000
2,00,000
40,000
2,40,000
1,20,000
1,20,000
(Rs)
8,00,000
4,00,000
4,00,000
1,40,000
2,60,000
20,000
2,80,000
1,40,000
1,40,000
Absolute
Change
(Rs)
(2,00,000)
(2,00,000)
(60,000)
60,000
(20,000)
40,000
20,000
20,000
%
Increase
30
16.66
16.66
%
Decrease
20
33.33
30
50
16.66
-
For this problem, the inferences could be enlisted according to the comparative statement
analysis on Profit & Loss Accounts of two different year viz 2001 and 2002.
The next important tool of financial statement analysis is a common size statement analysis
which known as predominant tool in intra firm analysis in studying the share of each
component.
The components are translated into percentage for analysis and interpretations. For
profit and loss account, Net sales is considered as a base for the computation of a share
of each financial factor available.
78
International Financial and
Management Accounting
For Balance sheet, total volume of assets and liabilities are taken into consideration for
the computation of a share of each financial factor available under the heading of assets
and liabilities.
Illustration 4
Prepare the common size statement analysis for the firm ABC ltd.
Liabilities
Share capital
Reserves and
surpluses
Bank overdraft
Quick liabilities
1990
(Rs)
2,00,000
1,00,000
1991
(Rs)
3,00,000
2,00,000
60,000
40,000
4,00,000
2,00,000
1,00,000
8,00,000
Assets
Fixed assets
Stock
1990
(Rs)
2,25,000
1,29,000
1991
(Rs)
4,00,000
2,00,000
Quick assets
46,000
2,00,000
4,00,000
8.,00,000
Solution:
Common size statement analysis of the Balance sheet of the firm ABC Ltd.
Particulars
Assets
Fixed assets
Stock
Quick assets
Total
Liabilities
Share capital
Reserves and surpluses
Bank overdraft
Quick liabilities
Amount
1990 Rs
2,25,000
1,29,000
46,000
4,00,000
1991 Rs
4,00,000
2,00,000
2,00,000
8,00,000
2,00,000
1,00,000
60,000
40,000
4,00,000
3,00,000
2,00,000
2,00,000
1,00,000
8,00,000
% of Balance sheet total
1990
56.25
32.25
11.5
100
50
25
15
10
100
1991
50
25
25
100
37.5
25
25
12.5
100
The above illustration highlights the share of every component in the balance sheet out
of the total volume of assets and liabilities.
This will certainly facilitate the firm to easily understand not only the share of every
component but also facilitates to have a meaningful and relevant comparison with various
time horizons.
Illustration 5
From the following table, prepare the common size statement analysis:
Sales
Miscellaneous Income
Materials consumed
Wages
Factory expenses
Office expenses
Interest
Depreciation
Profit
2000
(Rs.)
20,00,000
20,000
20,20,000
11,00,000
3,00,000
2,00,000
90,000
1,00,000
1,40,000
90,000
20,20,000
2001
(Rs.)
24,00,000
16,000
24.16,000
12,96,000
4,08,000
2,16,000
1,00,000
1,20,000
1,50,000
1,26,000
24,16,000
Solution:
79
Financial Statement Analysis
Common size statements Profit & Loss Account
Particulars
Sales
Miscellaneous Income
Materials consumed
Wages
Factory expenses
Office expenses
Interest
Depreciation
Profit
2000 (Rs.)
% Percentage
20,00,000
20,000
20,20,000
11,00,000
3,00,000
2,00,000
90,000
1,00,000
1,40,000
90,000
20,20,000
100
.9
100.9
54.46
14.85
9.90
4.47
4.95
6.94
4.47
100.9
2001 (Rs.)
24,00,000
16,000
24.16,000
12,96,000
4,08,000
2,16,000
1,00,000
1,20,000
1,50,000
1,26,000
24,16,000
Percentage
%
100
.67
100.67
53.64
16.82
8.92
4.95
4.92
6.21
5.21
100.67
Check Your Progress
(1)
(2)
(3)
(4)
Financial statement analysis is used for
(a)
Inter firm comparison only
(b)
Intra firm comparison only
(c)
Industrial average comparison
(d)
All of the above
Intra firm analysis is
(a)
Within a year
(b)
Between the years
(c)
Comparison with the projected
(d)
(a), (b) & (c)
Comparative financial statement analysis is into
(a)
Comparison of Income& Position statements
(b)
Common size statements
(c)
Trend percentage analysis
(d)
(a), (b) & (c)
Main objectives of the Financial statements analysis are
(a)
To study the changes in the financial performance
(b)
To study the liquidity, solvency of the firm
(c)
To undergo financial planning based upon the yester financial
performance
(d)
(a), (b) & (c)
4.4 TREND PERCENTAGE ANALYSIS
The next important tools of analysis is trend percentage which plays significant role in
analyzing the financial stature of the enterprise through base years’ performance ratio
computation. This not only reveals the trend movement of the financial performance of
the enterprise but also highlights the strengths and weaknesses of the enterprise
80
The following ratio is being used to compute the trend percentage
International Financial and
Management Accounting
=
Current year
× 100
Base year
This trend ratio is being computed for every component for many number of years
which not only facilitates comparison but also guides the firm to understand the trend
path of the firm.
4.5 LET US SUM UP
Under the financial statement analysis, the information available are grouped together in
order to cull out the meaningful relationship which is already available among them; for
interpretation and analysis. To reveal qualitative information about the firm in terms of
solvency, liquidity profitability and so on are extracted from the analysis of financial
statements. Comparative (Income) financial statement analysis is being carried out in
between the income statements of the various accounting durations of the firm, with
other firms in the industry and with the industrial average. After having been procured
the financial data pertaining to various time periods are ready for comparison ; to determine
or identify the level of increase or decrease taken place in the operating financial
performance of the firms.
4.6 LESSON END ACTIVITY
In financial statement analysis, what is the basic objective of observing trends in data
and ratios? Suggest some other standards of comparison.
4.7 KEYWORDS
Financial Statements: These refer to a set of reports and schedules which an accountant
prepares at the end of a period of time for a business enterprise.
Financial Statement Analysis: The study of relationship among the various financial
factors in business as disclosed by a single set of statements and a study of the trend of
these factors as shown in a series of statements.
Comparative Statements: These statements provide time perspective to the various
elements of financial position contained therein.
Common-size Statement: Those statements in which figures reported are converted
into percentages to some common base.
Trends Ratios: Index numbers of the movements of the various financial items in the
financial statements for a number of periods.
4.8 QUESTIONS FOR DISCUSSION
1.
Write elaborative note on the financial statement analysis.
2.
Elucidate the common size statement analysis.
3.
List out the objectives of the financial statement analysis.
4.
Explain the steps involved in the process of comparative statement of balance
sheet.
5.
Write brief note on the trend analysis.
Check Your Progress: Model Answers
1. d,
2. b,
3. a,
4. d
4.9 SUGGESTED READINGS
R. L. Gupta and Radhaswamy, “Advanced Accountancy”.
V. K. Goyal, “Financial Accounting”, Excel Books, New Delhi.
Khan and Jain, “Management Accounting”.
S. N. Maheswari, “Management Accounting”.
S. Bhat, “Financial Management”, Excel Books, New Delhi.
Prasanna Chandra, “Financial Management – Theory and Practice”, Tata McGraw Hill,
New Delhi (1994).
I. M. Pandey, “Financial Management”, Vikas Publishing, New Delhi.
Nitin Balwani, “Accounting & Finance for Managers”, Excel Books, New Delhi.
81
Financial Statement Analysis