Adipose tissue fibrosis in human cancer cachexia: The role of TGFβ pathway
Bạn đang xem bản rút gọn của tài liệu. Xem và tải ngay bản đầy đủ của tài liệu tại đây (7.15 MB, 12 trang )
Alves et al. BMC Cancer (2017) 17:190
DOI 10.1186/s12885-017-3178-8
RESEARCH ARTICLE
Open Access
Adipose tissue fibrosis in human cancer
cachexia: the role of TGFβ pathway
Michele Joana Alves1* , Raquel Galvão Figuerêdo1, Flavia Figueiredo Azevedo6, Diego Alexandre Cavallaro1,5,
Nelson Inácio Pinto Neto 5, Joanna Darck Carola Lima1, Emidio Matos-Neto1, Katrin Radloff1,
Daniela Mendes Riccardi1, Rodolfo Gonzalez Camargo1, Paulo Sérgio Martins De Alcântara3, José Pinhata Otoch2,3,
Miguel Luiz Batista Junior4 and Marília Seelaender1,2
Abstract
Background: Cancer cachexia is a multifactorial syndrome that dramatically decreases survival. Loss of white
adipose tissue (WAT) is one of the key characteristics of cachexia. WAT wasting is paralleled by microarchitectural
remodeling in cachectic cancer patients. Fibrosis results from uncontrolled ECM synthesis, a process in which,
transforming growth factor-beta (TGFβ) plays a pivotal role. So far, the mechanisms involved in adipose tissue (AT)
re-arrangement, and the role of TGFβ in inducing AT remodeling in weight-losing cancer patients are poorly
understood. This study examined the modulation of ECM components mediated by TGFβ pathway in fibrotic AT
obtained from cachectic gastrointestinal cancer patients.
Methods: After signing the informed consent form, patients were enrolled into the following groups: cancer
cachexia (CC, n = 21), weight-stable cancer (WSC, n = 17), and control (n = 21). The total amount of collagen and
elastic fibers in the subcutaneous AT was assessed by histological analysis and by immunohistochemistry. TGFβ
isoforms expression was analyzed by Multiplex assay and by immunohistochemistry. Alpha-smooth muscle actin
(αSMA), fibroblast-specific protein (FSP1), Smad3 and 4 were quantified by qPCR and/or by immunohistochemistry.
Interleukin (IL) 2, IL5, IL8, IL13 and IL17 content, cytokines known to be associated with fibrosis, was measured by
Multiplex assay.
Results: There was an accumulation of collagen and elastic fibers in the AT of CC, as compared with WSC and
controls. Collagens type I, III, VI, and fibronectin expression was enhanced in the tissue of CC, compared with both
WSC and control. The pronounced expression of αSMA in the surrounding of adipocytes, and the increased mRNA
content for FSP1 (20-fold) indicate the presence of activated myofibroblasts; particularly in CC. TGFβ1 and TGFβ3
levels were up-regulated by cachexia in AT, as well in the isolated adipocytes. Smad3 and Smad4 labeling was
found to be more evident in the fibrotic areas of CC adipose tissue.
Conclusions: Cancer cachexia promotes the development of AT fibrosis, in association with altered TGFβ signaling,
compromising AT organization and function.
Keywords: Cancer cachexia, Fibrosis, Adipose tissue, Extracellular matrix, TGFβ
* Correspondence:
1
Cancer Metabolism Research Group, Institute of Biomedical Sciences,
University of Sao Paulo, Sao Paulo, Brazil
Full list of author information is available at the end of the article
© The Author(s). 2017 Open Access This article is distributed under the terms of the Creative Commons Attribution 4.0
International License ( which permits unrestricted use, distribution, and
reproduction in any medium, provided you give appropriate credit to the original author(s) and the source, provide a link to
the Creative Commons license, and indicate if changes were made. The Creative Commons Public Domain Dedication waiver
( applies to the data made available in this article, unless otherwise stated.
Alves et al. BMC Cancer (2017) 17:190
Background
Cancer cachexia is an irreversible syndrome in which involuntary weight loss occurs, due to skeletal muscle mass
and adipose tissue wasting. This condition is associated
with poor prognosis, and decreased survival [1, 2].
Cachexia is seldom diagnosed or treated, despite affecting
around 80% of all cancer patients [3], and being the direct
cause of 22–40% of cancer deaths [4, 5]. The typical metabolic dysregulation acts in concert with the increase of
inflammatory mediators [6, 7], as the syndrome develops
in the manner of a chronic inflammatory state.
Profound wasting of WAT is frequently observed during
cachexia, and recent evidence suggests that it precedes
protein breakdown in the skeletal muscle or any decrease
in food intake [8, 9]. The WAT has been recognized as a
highly dynamic organ [10–12]. Therefore, changes in
WAT may be proposed as early markers of the syndrome,
thus presenting a potentially valuable tool for precocious
diagnosis. Previous studies [9, 13–16] have shown that the
AT is deeply affected by local inflammation during cancer
cachexia. Several pro-inflammatory factors, such as TNFα,
IL-1β and IL-6 are up-regulated by in the adipose tissue
during cachexia, and we have shown before [14–16], that
the subcutaneous depot presents a relevant contribution
to systemic inflammation as these factors reach the
circulation.
Each particular anatomical depot of adipose tissue
exhibits specific arrangement and functions, along with
diverse morphology and varying density of adipocytes, of
pre-adipocytes, of fibroblasts, of endothelial cells and of
resident macrophages [10, 17]. The extracellular matrix
(ECM) is a complex network essential for tissue architecture and cell functioning [10, 18]. ECM acts as one of
the most important reservoirs of growth factors, metalloproteinases, collagens and fibronectin. Indeed, changes
in ECM rapidly trigger signaling pathways controlling
different cell functions, including development, migration, proliferation, apoptosis, and gene expression [19].
Among the different extracellular matrix components,
collagen VI is highly expressed in the adipose tissue, and
is considered as the key form secreted by adipocytes.
The lack of collagen VI in col6 KO ob/ob mice results in
the uninhibited expansion of individual adipocytes [20, 21].
Studies with mice bearing the cachexia-inducing tumor
MAC-16 show that adipocyte dimensions are reduced, the
cell membranes disrupted, and that the tissue suffers
fibrosis [9].
Fibrosis results from persistent inflammation, in which
activated mechanisms for repair response lead to excessive accumulation of extracellular matrix components
[22, 23]. TGFβ is one of the key cytokines taking part in
wound-healing and tissue fibrosis [24]. Binding of TGFβ
to membrane receptors causes the assembly of a receptor complex that, in turn, phosphorylates SMAD
Page 2 of 12
proteins [25–27]. Through the action of SMADs on target genes, the induction of differentiation of fibroblasts
into myofibroblasts takes place [28]. Myofibroblasts are
contractile cells expressing alpha-smooth muscle actin
(α-SMA), involved in the production of ECM proteins,
such as collagen and fibronectin [29, 30].
Myofibroblast activation, proliferation and survival are
also mediated by other pro-inflammatory cytokines:
TNF, IL13, IL1 and TGFβ [31–34]. The microenvironment in fibrosis triggered by the TGFβ pathway often
leads myofibroblasts to sustain uncontrolled deposition
of extracellular matrix components, since these cells become resistant to the mechanisms of apoptosis [23].
Recently, we demonstrated that cachectic patients with
gastrointestinal cancer show morphological rearrangement in the subcutaneous AT, resulting in adipocyte size
reduction, AT atrophy, formation of fibrotic areas and
immune cell infiltration [35]. In the current study, we
hypothesized that the morphological changes in cancer
cachexia concomitant with augmented expression of
ECM elements occurs through enhanced signaling of the
TGFβ pathway.
Methods
Patient recruitment
All subjects were selected between 2012 and 2015 at the
ambulatory unit of the Surgical Medical Clinic at the
University Hospital, after being scheduled for exploratory laparotomy or abdominal surgery (n = 212). The
adopted exclusion criteria were: liver or kidney failure,
AIDS, chronic inflammatory processes not related to
cachexia, chemotherapy treatment (at the time), and
chronic anti-inflammatory therapy. All the procedures
were performed according to the Declaration of
Helsinki, and were approved by the Ethics Committee of
Research Involving Human Subjects of the Institute of
Biomedical Sciences/University of Sao Paulo (1082/CEP)
and by the Human Ethics Committee of the University
Hospital/University of Sao Paulo (CEP 752/07). The fully
informed written consent signature was obtained from
every patient after a detailed explanation of the study.
Following engagement in the study, patients were
divided into three groups. The control group (C) included weight stable patients subjected to surgical hernia
removal. Patients diagnosed previously with gastrointestinal cancer were divided in two groups: Weight-stable
Cancer Group (WSC) and Cachectic Cancer Group
(CC). The WSC group was comprised of patients with
greater than 5% body weight loss in the previous 6 months.
CC group included the patients with gastrointestinal
cancer and cachexia, characterized according to the following criteria: weight loss greater than 5% in fewer than
12 months, fatigue, anorexia; and abnormal biochemical
parameters (increased inflammatory markers: C-Reactive
Alves et al. BMC Cancer (2017) 17:190
Page 3 of 12
Protein, anemia, and by low serum albumin) [1]. The
questionnaire EORTC QLQ-C30 was applied to assess
quality-of-life of all patients and the obtained data indicated a reduced overall quality-of-life in the cachectic
group. A total of 153 patients were excluded from the
study. Forty patients refused to participate. Further
exclusion criteria were inconsistent data in questionnaires
(n = 19) and BMI greater than 29.9 kg/m2 (n = 03). Patients
of the control group showing inflammation (CRP > 5 mg/L)
(n = 27) and anemia (n = 01) were also excluded. Some patients were excluded due to unconfirmed diagnosis after
the final pathological analysis, as well as due to insufficient
adipose tissue sample allowing analysis, or which could not
be matched with a corresponding blood sample (n = 63). A
total of 59 patients were recruited into the study. Table 1
shows the characteristics of the study groups.
Plasma and serum measurements
Approximately 20 ml of blood were collected during admission at the hospital, and aliquots of both plasma and
serum was stored at -80 °C for later measurements. All
analyses were performed in the automatic LABMAX
240® equipment from Labtest, using commercial standards for Albumin (LABTEST), C-Reactive Protein
(LABTEST), and hemoglobin (LABTEST).
Protein expression of cytokines (TGFβ1, TGFβ2, TGβ3,
TNFα, IL6, IL2, IL5, IL8, IL13, IL17) employing Luminex®
technology
Approximately 100–200 mg of the subcutaneous AT from
each sample were homogenized in 300 μL of ice-cold extraction protein buffer (10 mM Tris base, 0.01 mM EDTA,
0.1 mM Sodium Chloride and 1% Triton X-100) to which
a protease inhibitor cocktail was added (1 tablet/50 ml extraction buffer) (Roche Diagnostics). Protein extraction
from isolated adipocytes was performed in the same way
as described above, and the adipocytes were isolated
following the adapted protocol from Rodbell [36]. The
homogenate was then centrifuged at 18,000 g for 40 min at
4 °C and the fatty layer, discarded. The supernatant was
stored in aliquots at -80 °C. Multi-species TGFβ 3 plex
Adipose tissue samples
Subcutaneous adipose tissue was collected during the
surgery procedure. Fat pad slices were rapidly frozen in
dry ice and maintained in 4% paraformaldehyde solution
(w/v) for the histological analysis described below. For
protein and gene expression, analyses of the samples
were maintained at -80 °C, prior to processing.
Table 1 General and clinical characteristics of studied groups
P value
CONTROL
WSC
CC
N
21
17
21
Male/Female (n)
16/5
9/8
13/8
Height (m)
1.65 ± 0.09
1.62 ± 0.09
1.63 ± 0.1
0.6735
Age (years)
54.10 ± 14.89
62.13 ± 11.78
63.00 ± 11.0
0.0642
Previous body mass (Kg)
71.43 ± 13.32
73.50 ± 13.28
73.78 ± 13.86
0.8431
Current body mass (Kg)
71.43 ± 13.32
69.28 ± 12.19
63.62 ± 12.90
0.1577
Clinical Parameters
Δ Body mass (Kg)
0.00 [0.00; 0.00]
0.00 [−7.2; 0.0]
−8.0 [−12.50;−7.0]
P < 0.0001*
BMI (Kg/m2)
25.82 ± 3.27
25.79 ± 4.62
23.68 ± 3.49
0.1558
C-Reactive Protein (mg/dL)
0.11 [0.0; 0.23]
0.1950 [0.0; 0.4]
1.170 [0.72; 1.3]
<0.0001***#
Albumin (g/dL)
4.75 [4.2; 5.1]
4.37 [4.05; 4.64]
3.84 [2.79; 4.58]
0.0037**
Hemoglobin (g/dL)
15.25 [13.9; 15.8]
13.10 [11.30;14.08]
11.80 [9.15; 13.20]
<0.0001***#
IL6 (pg/ml)a
0.00 [0.00; 0.84]
0.62 [0.00;1.77]
4.10 [1.25;9.74]
0.0008***#
5.42 [4.16; 6.15]
6.01 [3.92; 7.52]
8.82 [6.08; 13.87]
0.028**
IL2 (pg/ml)
ND
ND
ND
IL5 (pg/ml)a
0.00 [0.00;0.73]
0.00 [0.00;0.58]
0.85 [0.00;1.36]
p < 0.0282#
0.52 [0.35;2.16]
4.79 [2.02;6.47]
28.91 [17.36;68.86]
p < 0.0001*#
0.03 [0.03;0.05]
0.04 [0.03;0.04]
0.07 [0.02;0.105]
0.2947
0.79 [0.71;1.28]
1.09 [0.79;1.41]
1.56 [0.87;2.31]
0.1305
a
Biochemical Parameters
a
TNFα (pg/ml)
a
IL8 (pg/ml)a
a
IL13 (pg/ml)
b
a
IL17 (pg/ml)
ANOVA one way; Data are presented as mean and S.E.M. aKruskal Wallis Test; Data presented as median, 1st and 3st quartile. To cytokines content: Control (n = 17), WSC
(n = 13), CC (n = 12); bControl (n = 10), WSC (n = 9), CC (n = 10). *p < 0.05 **p < 0.003 ***p < 0.0001 CC vs Control; #p < 0.05 CC vs WSC. TNFα tumour necrosis factor α; IL6
interleukin 6; IL2 interleukin 2; IL5 interleukin 5; IL8 interleukin 8; IL13 interleukin 13; IL17 interleukin 17
Alves et al. BMC Cancer (2017) 17:190
magnetic bead panel Milliplex® MAP (TGFBMAG-64 K-03,
Merck Millipore) was adopted to detect TGFβ1, TGFβ2,
and TGFβ3. Before the assay, all samples were centrifuged
to remove debris. For the TGFβ assay, all samples were
acidified with 1 N HCL, after centrifugation. The Human
Cytokine Magnetic Bead Panel Milliplex® MAP (HCYTMAG-60 K-PX29, Merck Millipore) assay was employed to
with plasma samples to detect the following cytokines:
TNFα, TNFβ, IL1β, IL2, IL5, IL13, IL15, and IL17. All
working standards were submitted to serial dilutions, after
the reconstitution of stock solutions. MagPlex® beads were
mixed with samples, and incubated by 2 h on a plate shaker
at room temperature. After the incubation with detection
antibody for 1 h, the streptavidin-phycoerythrin was
employed to detect the fluorescent reporter intensity from
each microsphere that was linked to the sample. The
Luminex 200™ instrument with an xMAP® technology
system and xPONENT® acquisition software were
employed to capture component detection. MILLIPLEX®
Analyst 5.1 software was adopted integrating data acquisition and analysis.
Gene expression
Total RNA was extracted with Trizol® reagent (Invitrogen,
Carlsbad, CA) following the manufacturer’s recommendations. The concentration of total RNA was assessed with
the Biotek® SynergyH1 spectrophotometer. The cDNA
was obtained in a thermocycler (Applied Biosystems
Veriti® Thermal Cycler/US.) by reverse transcription (RT)
using 1 μg of total RNA from each sample per reaction,
with random primers for High-Capacity cDNA Reverse
Transcription Kits (Invitrogen no. 4375575), in a final
volume of 20 μl. Reverse transcription was performed in a
single cycle, which included: i) 10 min at 25 °C; ii)
120 min at 37 °C; iii) 5 s at 85 °C; and, iv) cooling at 4 °C.
The obtained cDNA samples were stored at -20 °C until
the experiment. PCR was performed using FAST SYBR
Green PCR Master Mix (Applied Biosystems, Foster City,
CA) in QuantStudio™ 12 K Flex real-time PCR (Applied
Biosystems) with primers designed based on GenBank’s
database. The mRNA expression of the following genes
was determined: RPL27 (NM 000988.3), Foward: CCG
AAA TGG GCA AGT TCA T, Reverse: CCA TCA TCA
ATG TTC TTC ACG A; SMAD3 (NM_005902.3)
Forward: CTA CAG CCA TTC CAT CCC CG, Reverse:
AGG TTT GGA GAA CCT GCG TC; SMAD4
(NM_005359.5), Foward: CAC AAG TCA GCC TGC
CAG TAT, Reverse: AAT CCA TTC TGC TGC TGT CC;
S100A4 (NM_002961.2), Forward: TCT TGG TTT GAT
CCT GAC TGCT, Reverse: GTC CTT TCC CCC AAG
AAG CTG. Target gene expression was normalized to the
reference gene RPL27. The data were analyzed with the
2-ΔΔCT method [2] and expressed as ratio of gene expression normalized to the control sample.
Page 4 of 12
Histological analysis
Subcutaneous adipose tissue samples (50–100 mg) were
obtained after carefully excision with a scalpel blade and
fixed in 4% paraformaldehyde (w/v) in pH 4.7 Phosphate
buffer, followed by dehydration in absolute ethanol,
diaphanization in xylene and embedding in paraffin
(Paraplast X-TRA, SIGMA-ALDRICH). The 5 μm sections were mounted onto slides (Starfrost® Knittel Glass).
Deparaffinized and hydrated sections were stained with
hematoxylin and counterstained with eosin (n = 05 for
all study groups) and photographed under light microscopy (Olympus).
Immunohistochemistry
Deparaffinized sections (5 μm) of subcutaneous adipose
tissue were kept at the incubator 37 °C overnight, before
the immunohistochemistry protocol was performed. Subsequently, the slides were hydrated with 0.05 M PBS, at
room temperature. Antigen retrieval was carried out in
10 mM of Citrate buffer (pH 6.0) or Tris-EDTA buffer
(pH 9.0) at 95 °C for 20 min. The activity of endogenous
peroxidase was blocked in methanol with 0.3% H2O2,
under light protection. All reactions were performed
employing Histostain-Plus, IHC kit, HRP broad spectrum®
(Life Technologies), following the manufacturer’s instructions. After adding the blocking substrate included the kit,
sections were incubated overnight (4 °C) with primary
antibodies: Anti-Collagen I rabbit monoclonal antibody
[EPR7785] (1:100, Abcam), Anti-Collagen type III rabbit
polyclonal antibody (1:100, Rockland Immunochemicals
Inc), Anti-Collagen type VI rabbit polyclonal antibody
(1:40, Millipore), Anti-Human Fibronectin mouse monoclonal antibody (1:50, Millipore), αSMA (1:100, Abcam),
TGFβ1 (V) rabbit polyclonal antibody (1:50, Santa Cruz
Biotechnology) and Smad4 (B-8) mouse monoclonal antibody (1:100, Santa Cruz Biotechnology) in a humidified
chamber. Negative controls were obtained omitting the
primary antibody. Peroxidase activity was revealed with
ImmPACT™ DAB substrate (Vector Laboratories, Burlingame, CA USA) and tissue sections were counterstained
with Mayer’s hematoxylin (n = 05 for all study groups).
In each sample, the immunolabeled tissue was observed under a light microscope (Olympus). Representative images were acquired using Image ProPlus v.5.2
software (Media Cybernetics, Bethesda, MD, USA).
Immunofluorescence
After the previously described antigen retrieval procedure and quenched endogenous peroxidase activity,
sections of subcutaneous adipose tissue were washed
with 0.05 M PBS. The blockage of nonspecific sites was
performed with normal goat serum, 10% (Reference:
50197Z Life Technologies, Thermo Scientific, USA)
added to 1% albumin in 0.1 M PBS containing 0.2%
Alves et al. BMC Cancer (2017) 17:190
Triton X- 100 for 1 h, at room temperature. The
antibody Smad3 (86 F7) Rabbit mAb (1:50, Reference:
# 3122, Cell Signaling) was incubated in a humidified
chamber, overnight. After removal of the antibody, the
sections were washed with 0.1 M PBS/0.2% Triton X-100
for 5 min. The secondary antibody goat anti-rabbit Alexa
546 (Thermo Scientific, USA) was added for 1 h,
protected from light. The slides were mounted using
ProLong® Montant Gold Antifade with DAPI (Molecular
Probes, Life Technologies, USA).
Statistical analysis
Data were expressed as the median [1st, quartile; 3rd,
quartile]. The difference between the groups was assessed
by Kruskal-Wallis followed by Dunn post-test, as data
presented a non-parametric distribution. Data for group
classification and characterization were expressed as
mean ± standard error. In this case, one-way analysis of
variance with Tukey post-test was adopted. Differences
were considered as statistically significant for P < 0.05.
The statistical data analysis was carried out with the statistical package software GraphPad PRISM (GraphPad Prism
version 5.00 for Windows, GraphPad Software, San Diego
California USA, www.graphpad.com”). All statistical
procedures were performed with the assistance of the
Statistics Sector of the Institute of Biomedical Sciences,
USP, under the supervision of Ms. Rosana Prisco.
Results
General and clinical characteristics of study groups
The clinical characteristics of patients distributed in the
study groups are shown in Table 1. For all groups, similar
height and age were found. Current and previous weights
for 6–12 months (before inclusion of patients in the
study), as reported by patients, did not present significant
differences among the groups. As expected, the cancer
cachexia group (CC) exhibited a pronounced weight loss
with 14% body mass reduction (−8.0 [−12.50;−7.0]), while
the weight-stable cancer group (WSC) showed body mass
variation less than 4.2%, and no changes were observed
for the control group (C). Similar results for BMI index
were found for all groups.
In order to assess the biochemical values of the parameters employed to determine the patients clinical condition,
we examined the serum levels of C-Reactive Protein, albumin, hemoglobin and the plasma levels of interleukin 6
(IL-6) and TNF alpha (TNFα). The C-Reactive Protein
values were increased in CC (4.95-fold and 3.05-fold as
compared with C and WSC groups, respectively).
Hemoglobin and albumin were significantly reduced in
CC, in comparison to the control. Despite the consensus
recommendation of albumin levels being around 3.2 g/dL,
for cachexia diagnosis, CC showed a variation from 2.79
to 4.58 g/dL. In addition, the plasma levels of IL6 (pg/ml)
Page 5 of 12
were elevated in cachexia (4.10 pg/ml), whereas, detection in the control (0.00 [0.00; 0.84] pg/ml) and WSC
(0.62 [0.00; 1.77] pg/ml) were low. TNFα levels were
also enhanced in cachexia (p < 0.02), but only compared
with the control group. The results show higher systemic inflammation in cachectic patients represented
by higher plasma levels of CRP, IL6 and TNFα.
Other plasma pro-inflammatory cytokines were
assessed, as shown in Table 1: interleukin (IL) 2(IL2), IL5,
IL8, IL3, IL17. All of which have been linked to the development of fibrosis in several experimental models and diseases [29, 31, 37–39]. There was no detection of IL2
values in the plasma of any of the groups. For IL13 and
IL17, the levels were not statistically different among the
groups. The enhanced expression of IL5 has been associated with elevated levels of IL13 or IL17 [37–40]. Despite
these cytokines not presenting any difference induced by
cachexia or cancer, when compared with the control
group, the levels of IL5 were found to be increased in CC
(p < 0.02). CC showed higher values of IL8, (55-fold),
(28.91 pg/ml), compared with the control (0.52 pg/ml),
and with WSC (4.79 pg/ml). Thus, the differences of
inflammatory and pro-inflammatory cytokines were more
pronounced in the cachectic patients and can be interpreted as indicative of local inflammation.
Extracellular matrix proteins are overexpressed in the
subcutaneous adipose tissue of cancer cachexia
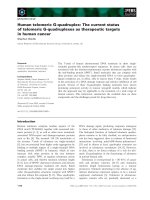
Consistent with our previous findings [35], morphological analysis under light microscopy carried out in
haematoxylin and eosin stained sections showed deep
modifications in the subcutaneous adipose tissue, exclusively in CC, with differences in the shape of adipocytes
and augmented interstitial space (Fig. 1a). The presence
of areas with collagen deposits was also more intense in
CC compared with control and WSC (Fig. 1b). Along
with collagen deposition, we observed an accumulation
of mature elastic fibers only in CC (Fig. 1c).
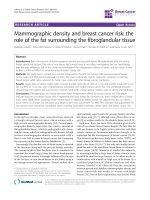
To characterize the presence of fibrosis in the subcutaneous AT, we investigated by immunohistochemistry,
the presence of different types of collagen: type I
(COL1), type III (COL3) and type VI (COL6), and of
fibronectin (FN). As shown in Fig. 2a, b, c and d respectively, we found similar labeling for COL1, COL3, COL6
and FN for WSC and for the control group. COL6 expression was more evident surrounding adipocytes in all
groups than that of COL1 and COL3. The differences
were even more pronounced when staining for COL1,
COL3, COL6 and FN in the AT of the CC group. In fact,
we detected the presence of fibrotic areas in CC, with an
accumulation of all the studied collagens along with increased fibronectin expression. In the sections labeled
for FN, we observed deposition of fibronectin exclusively
in the fibrotic areas.
Alves et al. BMC Cancer (2017) 17:190
Page 6 of 12
Fig. 1 Adipose tissue remodeling is triggered during cancer cachexia. a Haematoxilin and eosin sections of subcutaneous adipose tissue. b Collagen
detection by Picro Sirius Red staining. c Localization of elastic fibers performed with Verhoeff’s Van Gieson staining. Photomicrographs of the representative
images from each group: Control (n = 5), Weight-stable cancer (WSC; n = 5), Cancer cachexia (CC; n = 5). Ad- Illustrates preserved adipocytes. Arrows
indicate intense labeling. F- Indicates areas with excessive ECM deposition (fibrotic areas)
Fig. 2 Cachexia induces overexpression of collagen type I, III, VI and fibronectin in the adipose tissue. a-d Sections of human subcutaneous
adipose tissue were immunostained with (a) COL1A1, (b) COL3A1, (c) COL6A1, and (d) Fibronectin (FN1). Control (n = 5), Weight-stable cancer
(WSC; n = 5), Cancer cachexia (CC; n = 5). Note the positive labeling for all groups, with stronger intensity in CC. Immunostaining for COL6A1 in
Control, WSC and CC samples was found around the adipocytes, whereas, in CC, positive staining in several fibrotic areas were observed (F).
Ad- Illustrates preserved adipocytes. Blue staining (Mayer’s Haematoxylin) represents a non-reactive nucleous
Alves et al. BMC Cancer (2017) 17:190
The overexpression of ECM proteins shown by our
results illustrates not only AT remodeling, but the
emergence of fibrosis in the AT, due to cancer
cachexia.
Myofibroblasts contributing to fibrosis of adipose tissue
in cancer cachexia
In order to assess the contribution of fibroblasts with an
activated phenotype, myofibroblasts, to the excessive deposition of ECM components in cancer cachexia, we
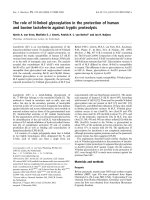
measured α-smooth muscle actin (αSMA) expression.
Our results demonstrate (Fig. 3a), as expected, higher
expression of αSMA, restricted to vessels walls in sections of WSC when compared to the control group and
CC. Interestingly, the presence of myofibroblasts was
often found in AT of cachectic patients, specially surrounding adipocytes. The gene expression of the
fibroblast-specific protein (FSP1) (also called S100A4)
was similarly evaluated. As shown in Fig. 3d, there was a
20-fold increase of FSP1 mRNA levels in CC, compared
to controls (p < 0.05). Thus, this confirms the presence
of activated myofibroblasts with enhanced ECM proteins
synthesis due to cachexia.
Page 7 of 12
TGFβ pathway up-regulated by cachexia
The TGFβ signaling pathway can directly induce myofibroblasts to produce ECM components. To assess the role of
TGFβ in ECM remodeling in adipose tissue during cachexia, we detected TGFβ and SMADs proteins expression
by different approaches. Immunohistochemistry analysis
under light microscopy revealed that there was marked
TGFβ1 expression in representative sections from CC
group in relation to C and WSC (Fig. 3a). We observed
TGFβ1 labeling surrounding each adipocyte, and between
the fibrotic areas in the AT from cachectic patients.
Smads are proteins which act as downstream signals
of the TGFβ pathway. Smad4 interacts with Smad2 and
Smad3, forming a complex which rapidly translocates
into the nucleus and binds to DNA [26, 41–43]. Firstly,
we detected immunolabeling of Smad4 (Fig. 3c) in the
AT which was solely present in CC, especially within the
fibrotic areas. We analyzed the mRNA levels of Smad3
and Smad4 in the AT (Fig. 3e-f ). No differences for gene
expression of Smad3 were found, whereas there were increased mRNA levels for Smad4 in WSC and CC
groups, both in comparison to the control (p < 0.003).
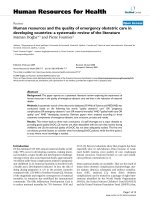
The immunofluorescence of Smad3 (Fig. 4g) also
Fig. 3 TGFβ and Myofibroblast presence contributes to adipose tissue fibrosis in cancer cachexia. a Immunohistochemistry for myofibroblasts with
αSMA antibody. Note that almost immunoreactivity in WSC is in vessel walls, whereas CC shows positive cells among adipocytes and in (F) fibrotic
areas. b-c TGFβ immunohistochemical analysis in subcutaneous AT illustrates its possible role in inducing cachexia-associated fibrosis, whereas (c)
Smad4 shows activation of this pathway. Counterstaining (blue) with Mayer’s Haematoxylin was performed. The groups were identified as Control
(n = 5), Weight-stable cancer (WSC; n = 5), Cancer cachexia (CC; n = 5). Fibrotic areas are indicated (F). Arrows indicate positive labeling. d-f qPCR
analysis of fibroblast marker (d) FSP1 (S100A4) (control, n = 13; WSC n = 6; CC n = 12), (e) Smad3 (control, n = 9; WSC n = 6; CC n = 7), and (f) Smad4
(control, n = 11; WSC n = 7; CC n = 12). Data presented as median and 1st and 3st quartile. *p < 0.05 CC vs control; # WSC vs control
Alves et al. BMC Cancer (2017) 17:190
Page 8 of 12
Fig. 4 TGFβ pathway is activated in the fibrotic subcutaneous AT in cancer cachexia. a-c Multiplex assay analysis of activated (a) TGFβ1, (b) TGFβ2, and
(c) TGFβ3 in whole subcutaneous AT. Control (n = 14), Weight-stable cancer (WSC) (n = 12), Cancer cachexia (CC) (n = 14). d-f Adipocytes also contribute
for the enhanced observed TGFβ levels, as shown by Multiplex analysis of (a) TGFβ1, (b) TGFβ2, and (c) TGFβ3 from isolated adipocytes of subcutaneous
AT. Control (n = 5), Weight-stable cancer (WSC) (n = 5), Cancer cachexia (CC) (n = 5). Data presented as median and 1st and 3st quartile. *p < 0.05, CC vs
control; ***p < 0.003 CC vs control. g Immunofluorescence staining in subcutaneous AT for Smad3 (red) and DAPI (blue) for nuclei, which showed higher
density for Smad3 labeling in cancer cachexia. Control (n = 5), Weight-stable cancer (WSC; n = 5), Cancer cachexia (CC; n = 5)
demonstrated a more evident expression in CC compared with WSC and the control.
To further explore these results, we quantified the content of the activated isoforms TGFβ1, TGFβ2 and TGFβ3
by Multiplex assay. We failed to find a statistical difference
for TGFβ1 levels among the groups (p = 0.6055), as shown
in Fig. 4a. There were no alterations for isoform β2 in the
subcutaneous AT (Fig. 4b). Our results show an increased
concentration of TGFβ3 in CC, compared with the controls
(p = 0.03). In adipocytes isolated from the subcutaneous
adipose tissue, (results presented in Fig. 4d-f) an enhanced
protein expression of TGFβ1 and TGFβ3 in cachectic patients in relation to the control group (p < 0.05) was found.
There was a rise of 4-fold and 3.4-fold for TGFβ1 and
TGFβ3 concentrations, respectively, in the adipocytes of
CC. These results demonstrate that there is a contribution
of adipocytes to fibrosis in AT.
Taken together, our findings indicate that there is an
augmented activation of the TGFβ pathway in the AT of
cachectic patients, revealing an active role of this pathway for disrupted biology tissue and consequent fibrosis.
Discussion
Cachexia is a wasting disease which affects approximately
nine million people worldwide [44]. Cancer cachexia is
characterized by progressive body weight reduction due to
the loss of skeletal muscle and adipose tissue often associated with systemic inflammation. Current knowledge has
shown that adipose tissue depletion in cancer cachexia
results from body composition alterations concerning
impaired lipid storage capacity and increased lipolysis ratio
[13]. We previously showed that the AT suffers morphological modifications which reflects in the reduction of adipocyte size and ECM remodeling in cancer cachexia [35].
Our present findings demonstrate that ECM remodeling of AT in cachexia results not only in augmented collagen fiber content, but also, in excessive elastic fibers
and fibronectin deposition. The presence of fibrosis was
associated with an increased number of myofibroblasts
and an activated TGFβ/SMAD pathway in the subcutaneous AT of gastrointestinal cancer cachectic patients.
In animal models for cancer cachexia (MAC16 tumor
bearing-mice) shrunken adipocytes and increased
collagen-fibril content in WAT were reported [9]. AT is
embedded in a thick ECM surrounding each adipocyte.
Nakajima et al. [45] described the presence of type I–VI
collagens, laminin and fibronectin in differentiated bovine pre-adipocytes (BIP). Our data show that collagen
deposition is accompanied by excessive synthesis of
mature elastic fibers, compromising the microenvironment
Alves et al. BMC Cancer (2017) 17:190
of adipose tissue due to cachexia. We also explored each
collagen isoform modified by cachexia. There was strong
labeling for collagen type I (COL1) and III (COL3) in the
AT from cachectic patients, without differences for
control and weight-stable cancer patients, indicating the
contribution of both types of collagens for disruption of
adipose tissue. Studies with obese subjects reported the
presence of fibrous bands in the AT, accessed by Sirius
Red staining, whereas in lean individuals, the content of
collagen was not changed. In addition, increased amounts
of collagen VI (COL6) were found in obese rather than in
lean subjects [19].
The expression of COL6 seems to be more specific for
adipose tissue since it exhibited a higher expression
among different depots of fat, in comparison with liver,
muscle, heart, and pancreas, in normal conditions,
whereas, the absence of COL6 resulted in an uninhibited
expansion of adipocytes [20]. High levels of COL6 in the
AT are directly associated with inflammation and fibrosis
in obese individuals and in animal models. In obese subjects, immunohistochemistry analysis revealed a stronger
label for COL6 and increased mRNA levels of subunit
alpha 1 (COL6A1), and both were highly correlated with
CTGF and TGFβ levels [46]. The subunit alpha 3 of collagen VI (COL6A3) was also found increased in diabetic
obese animals, as well as in obese subjects, with a positive
correlation between increased visceral adipose tissue mass
and inflammation, independent of BMI; whereas the expression in the subcutaneous AT remained unchanged
[20, 47]. The complete assembly of all three chain subunits; α1 (COL1A1), α2 (COL6A2) and α3 (COL6A3) is
necessary for stable formation and functionality of COL6
[48]. In this study, we demonstrate the positive presence
of COL6A1 in the subcutaneous AT of non-cachectic patients. However, there was a higher expression of COL6A1
in the samples of cachectic patients, accompanied by the
presence of intensely labeled bundles in CC.
We report that all of the studied collagen types
(COL1A1, COL3A1, and COL6A1) in the AT, to be
modulated by cancer cachexia. Fibronectin (FN) has
been reported to be found in colocalization with collagen fibers from secretory fibroblasts, while FN absence
impairs collagen assembly [49]. The observed changes in
collagen deposition dysregulated by cachexia are, in fact,
accompanied by augmented FN in the AT of CC. The
fibrotic areas were also positively labeled for FN in CC.
In studies with obese patients, a strong staining for FN
was found in fibrotic regions, the presence of which was
increased in the serial sections of AT [50]. Our data
demonstrate which ECM proteins induce alterations in
the morphology of fat tissue promoting the emergence
of fibrosis, in association with cancer cachexia.
Cancer cachexia is orchestrated, in part, by a network
of inflammatory factors that are activated for signaling
Page 9 of 12
pathways from each tissue joining tumor-derived factors
that are the result of malignant inflammation [6].
Consistent with international consensus for cachexia
diagnosis, our results demonstrate systemic inflammation in cancer cachectic vs. non-cachectic patients, with
increased circulating CRP, IL6, TNFα, IL8, and IL5
levels. A previous study reported that high plasma concentrations of IL8 in patients with advanced lung cancer
(stage IV), were correlated with cachexia [51]. On the
other hand, increased circulating levels of IL8 are also
reported as markers in patients with pulmonary fibrosis
[52]. The expression of IL13 and IL17 cytokines has an
important role in tissue remodeling and fibrosis. IL13
acts directly to induce collagen production in fibroblasts,
thus stimulating proinflammatory mediators, macrophages and dendritic cells [37, 53]. IL17 produced by
Th17 cells contributes to the innate and adaptive immune responses, as well to the perpetuation of inflammation with neutrophilia, which in turn, induces tissue
damage and fibrosis [38]. In addition, IL17 expression is
correlated in the pathogenesis of pulmonary fibrosis,
myocardial fibrosis and hepatic fibrosis [38]. Despite
this, our study did not presented high levels of IL13 or
IL17, whereas, the IL5 expression was significantly enhanced in the plasma from cachectic patients. In the
liver fibrosis, the increased levels of IL5 lead to progress
of tissue damage by regulating IL13 production and
macrophage activation [39]. During states of chronic inflammation, the presence of infiltrating macrophages
can augment the myofibroblast activation, tissue damage
and fibrosis [23, 53, 54].
Myofibroblasts are contractile cells overexpressing αSMA and specialize in synthesizing ECM proteins in
wound healing responses [23, 29]. α-SMA expression
has a critical role in cell motility and contractility during
tissue repair, but is also associated to the induction of a
fibrotic state [34]. A 3 T3 cell lineage of fibroblasts
transfected with α-SMA resulted in cell contractility,
which is doubled in lung fibroblasts expressing high
levels of α-SMA via TGFβ1 pathway [30]. Mechanical
stress caused by excessive contractility leads to an
aberrant wound-healing response and fibrosis [33]. In
epithelial-mesenchymal cell transition (EMT), which
occurs in pulmonary fibrosis, is seen the concomitant
increased amounts of mRNA levels of α-SMA, FSP1 and
vimentin [55]. According with this, our study showed
enhanced immunolabeling of α-SMA in the subcutaneous AT of cancer cachectic group, as well as increased
mRNA expression of FSP1. Taken together, these results
reveal that changes in collagen and fibronectin expression are associated with increased amounts of activated
fibroblasts in cachexia.
TGFβ, a multifunctional cytokine, presents antiinflammatory and pro-fibrotic activity. This dual role
Alves et al. BMC Cancer (2017) 17:190
leads to different responses in multiples biological pathways depending of context for their action [23, 56].
TGFβ expression is robustly correlated with the development of fibrosis in the liver, lung, kidney, skin and in
cardiac tissues under pathological conditions [23]. In
WAT, increased expression of TGFβ has also been reported in obese mice (ob/ob) [57, 58] and in human subjects [59, 60]. In the AT from obese patients and/or
rodents, fibrotic areas are frequent [9, 61]. Interestingly,
TGFβ1 was increased in subcutaneous AT from cancer
cachectic patients, and it was up-regulated in the whole
tissue samples, as well as in the isolated adipocytes. The
TGFβ3 isoform was elevated solely in the adipocytes,
demonstrating the contribution of these cells to the
fibrotic state of the AT. The three isoforms: TGFβ1,
TGFβ2, and TGFβ3, most expressed in mammals, induce different biological effects. The TGFβ1 isoform
seems to play a more important role in wound response
and fibrosis [28].
The Smads are a family of transcriptional activators
triggered in response to TGFβ. Heterocomplexes formed
by R-Smad (Smad2/Smad3) with Smad4 are required to
bind DNA regulating gene expression [24]. In knockout
models for Smad3, accelerated wound-healing response
with low inflammation is demonstrated [24]. TGFβ signaling pathway inhibition has been shown to reduce the
development of fibrosis in experimental models [23]. On
the other hand, in obesity, expansion of adipocytes is
associated with tissue remodeling and fibrosis. The
expression of Smad3 is also enhanced in ob/ob mice in
fat depots and Smad3 inhibition in vitro results in deficient adipocyte differentiation [57].
Our main interest was to investigate the relationship
among adipose tissue fibrosis in cachectic cancer patients and activation of the TGFβ canonical pathway.
TGFβ is a cytokine able to activate a wide array of
additional cellular functions through non-canonical
pathways, such as Rho-like GTPase signaling [62]. In
cultured adipocytes, an enhanced Rho-Rho-kinase signaling results in activation of NF-κB and TNFα [63]. In vivo,
the inflammatory changes induced by Rho-Rho-kinase signaling, contribute to deregulated adipocytokine expression
and recruitment of inflammatory cells to the adipose tissue,
which in turn, exacerbates the inflammatory scenario described in obesity [64]. The activation of Rho-kinase by
Rho, in addition to Smads signaling triggered by TGFβ in
the adipose tissue of cachectic patients could lead to the
aggravation of inflammation and, consequently, to fibrosis,
but, a detailed study investigating the multiple mechanisms
activated by Rho-Rho-kinase during cachexia is necessary.
The subcutaneous AT of cachectic patients show activation of the TGFβ pathway via Smads. We report
herein, an increased expression of TGFβ occurs in parallel with Smad3 and 4, thus, demonstrating there was a
Page 10 of 12
cytoplasmatic translocation of the Smad complex to the
nucleus. Considering this, we suggest that TGFβ/Smad
signaling contributes to remodeling, and consequently to
fibrosis of AT in cancer cachexia. We speculate that the
fibrotic response of AT during cachexia may be triggered
by systemic inflammation, concomitant with the activation myofibroblasts contributing to ECM deposition and
tissue contractility, through TGFβ/Smad signaling.
Conclusions
Our study shows the presence of fibrosis in the subcutaneous adipose tissue due to cachexia. In this process, the
TGFβ canonic pathway seems to play an important role.
The re-arrangement of adipose tissue in cachexia
includes elastic fibers, collagens -especially type I, III,
VI- and fibronectin. Additionally, the presence of myofibroblasts surrounding adipocytes along with the increased
pro-inflammatory cytokine content, indicate severe tissue
damage. Extracellular matrix components are crucial for
adipose tissue biology. In fact, uncontrolled deposition of
collagens, and of other ECM proteins, can prevent the expansion of adipocytes thus leading to the failure of treatments aiming at recovering adipose tissue wasting in
cachectic patients.
Abbreviations
AT: Adipose tissue; CC: Cancer cachexia; ECM: Extracellular matrix;
FN: Fibronectin; FSP1: Fibroblast-specific protein; IL: Interleukin;
TGFβ: Transforming growth factor beta; WAT: White adipose tissue;
WSC: Weight-stable cancer; αSMA: Alpha-smooth muscle actin
Acknowledgments
We thank all members of Cancer Metabolism group for discussions, in
particular, Emilia Ribeiro for excellent technical assistance. The clinical and
surgical work was performed at the University Hospital and we are grateful
for all technical and staff support.
Funding
This work was supported mainly by São Paulo Research Foundation
(FAPESP; 2012/50079-0) and CAPES. The contents of this work are solely the
responsibility of the authors and do not necessarily represent the official
views of FAPESP.
Availability of data and materials
Data are available on request to the authors.
Authors’ contributions
MJA with MS conceptualized the study. MJA drafted the initial manuscript.
Immunohistochemistry experiments and morphological analysis were
performed together with FAF, RGF and DAC. Multiplex cytokines assay
experiments were performed by: MJA, EMN, DMR and KR, whereas MJA,
NIPN, RGF and JDCL carried out TGFβ Multiplex Assay. RGC, PSMA, JPO, MBJ
contributed to the patient recruitment, interviews, as well, all authors
contributed to the tissue and blood collection, and data analysis. All authors
read and approved the final manuscript.
Competing interests
The authors declare that they have no competing interests.
Consent for publication
Not applicable.
Alves et al. BMC Cancer (2017) 17:190
Ethics approval and consent to participate
All proceedings were performed in agreement with the Declaration of
Helsinki and approved by the Ethics Committee on Research Involving
Human Subjects of the Institute of Biomedical Sciences/University of Sao
Paulo (1082/CEP) and by the Human Ethics Committee of the University
Hospital/University of Sao Paulo (CEP 752/07). The acceptance for study
participation and, data publication was obtained by written consent after the
detailed explanation.
Publisher’s Note
Springer Nature remains neutral with regard to jurisdictional claims in
published maps and institutional affiliations.
Author details
1
Cancer Metabolism Research Group, Institute of Biomedical Sciences,
University of Sao Paulo, Sao Paulo, Brazil. 2Department of Surgery, Faculty of
Medicine, University of Sao Paulo, Sao Paulo, Brazil. 3Department of Clinical
Surgery, Hospital University, University of Sao Paulo, Sao Paulo, Brazil.
4
Biotechnology Group, Laboratory of Adipose Tissue Biology, University of
Mogi das Cruzes, Mogi das Cruzes, Brazil. 5Department of Nutrition, Federal
University of Sao Paulo, Sao Paulo, Brazil. 6Faculty of Nursing, University of
Campinas, Campinas, Brazil.
Received: 1 November 2016 Accepted: 8 March 2017
References
1. Evans WJ, Morley JE, Argilés J, Bales C, Baracos V, Guttridge D, Jatoi A,
Kalantar-Zadeh K, Lochs H, Mantovani G, et al. Cachexia: a new definition.
Clin Nutr. 2008;27(6):793–9.
2. Letilovic T, Vrhovac R. Influence of additional criteria from a definition
of cachexia on its prevalence–good or bad thing? Eur J Clin Nutr.
2013;67(8):797–801.
3. Fearon K, Strasser F, Anker SD, Bosaeus I, Bruera E, Fainsinger RL, Jatoi A,
Loprinzi C, MacDonald N, Mantovani G, et al. Definition and classification
of cancer cachexia: an international consensus. Lancet Oncol.
2011;12(5):489–95.
4. Tisdale MJ. Cancer cachexia. Curr Opin Gastroenterol. 2010;26(2):146–51.
5. Argilés JM, Stemmler B, López-Soriano FJ, Busquets S. Nonmuscle tissues
contribution to cancer cachexia. Mediators Inflamm. 2015;2015:182872.
6. Tsoli M, Robertson G. Cancer cachexia: malignant inflammation, tumorkines,
and metabolic mayhem. Trends Endocrinol Metab. 2013;24(4):174–83.
7. Muscaritoli M, Molfino A, Gioia G, Laviano A, Rossi Fanelli F. The “parallel
pathway”: a novel nutritional and metabolic approach to cancer patients.
Intern Emerg Med. 2011;6(2):105–12.
8. Argilés JM, Busquets S, Stemmler B, López-Soriano FJ. Cancer cachexia:
understanding the molecular basis. Nat Rev Cancer. 2014;14(11):754–62.
9. Bing C, Russell S, Becket E, Pope M, Tisdale MJ, Trayhurn P, Jenkins JR.
Adipose atrophy in cancer cachexia: morphologic and molecular analysis of
adipose tissue in tumour-bearing mice. Br J Cancer. 2006;95(8):1028–37.
10. Ouchi N, Parker JL, Lugus JJ, Walsh K. Adipokines in inflammation and
metabolic disease. Nat Rev Immunol. 2011;11(2):85–97.
11. Trayhurn P. Adipocyte biology. Obes Rev. 2007;8 Suppl 1:41–4.
12. Jensen J, Trayhurn P, Handberg A, Eckel J. Adipose tissue. Editorial.
Arch Physiol Biochem. 2011;117(2):45–6.
13. Ebadi M, Mazurak VC. Potential biomarkers of fat loss as a feature of cancer
cachexia. Mediators Inflamm. 2015;2015:820934.
14. Batista ML, Peres SB, McDonald ME, Alcantara PS, Olivan M, Otoch JP,
Farmer SR, Seelaender M. Adipose tissue inflammation and cancer cachexia:
possible role of nuclear transcription factors. Cytokine. 2012;57(1):9–16.
15. Batista ML, Olivan M, Alcantara PS, Sandoval R, Peres SB, Neves RX,
Silverio R, Maximiano LF, Otoch JP, Seelaender M. Adipose tissue-derived
factors as potential biomarkers in cachectic cancer patients. Cytokine.
2013;61(2):532–9.
16. Camargo RG, Riccardi DM, Ribeiro HQ, Carnevali LC, de Matos-Neto EM,
Enjiu L, Neves RX, Lima JD, Figuerêdo RG, de Alcântara PS, et al. NF-κBp65
and expression of its pro-inflammatory target genes are upregulated in the
subcutaneous adipose tissue of cachectic cancer patients. Nutrients.
2015;7(6):4465–79.
17. Pond CM. Adipose tissue and the immune system. Prostaglandins Leukot
Essent Fatty Acids. 2005;73(1):17–30.
Page 11 of 12
18. Mariman EC, Wang P. Adipocyte extracellular matrix composition, dynamics
and role in obesity. Cell Mol Life Sci. 2010;67(8):1277–92.
19. Divoux A, Clément K. Architecture and the extracellular matrix: the
still unappreciated components of the adipose tissue. Obes Rev.
2011;12(5):e494–503.
20. Khan T, Muise ES, Iyengar P, Wang ZV, Chandalia M, Abate N, Zhang BB,
Bonaldo P, Chua S, Scherer PE. Metabolic dysregulation and adipose tissue
fibrosis: role of collagen VI. Mol Cell Biol. 2009;29(6):1575–91.
21. Ali AT, Hochfeld WE, Myburgh R, Pepper MS. Adipocyte and adipogenesis.
Eur J Cell Biol. 2013;92(6-7):229–36.
22. Wynn TA. Common and unique mechanisms regulate fibrosis in various
fibroproliferative diseases. J Clin Invest. 2007;117(3):524–9.
23. Wynn TA, Ramalingam TR. Mechanisms of fibrosis: therapeutic translation
for fibrotic disease. Nat Med. 2012;18(7):1028–40.
24. Leask A, Abraham DJ. TGF-beta signaling and the fibrotic response. FASEB J.
2004;18(7):816–27.
25. Massagué J. How cells read TGF-beta signals. Nat Rev Mol Cell Biol.
2000;1(3):169–78.
26. Massagué J, Wotton D. Transcriptional control by the TGF-beta/Smad
signaling system. EMBO J. 2000;19(8):1745–54.
27. Macias MJ, Martin-Malpartida P, Massagué J. Structural determinants of
Smad function in TGF-β signaling. Trends Biochem Sci. 2015;40(6):296–308.
28. Flanders KC. Smad3 as a mediator of the fibrotic response. Int J Exp Pathol.
2004;85(2):47–64.
29. Wynn TA. Cellular and molecular mechanisms of fibrosis. J Pathol.
2008;214(2):199–210.
30. Hinz B. The extracellular matrix and transforming growth factor-β1: Tale of a
strained relationship. Matrix Biol. 2015;47:54–65.
31. Ueha S, Shand FH, Matsushima K. Cellular and molecular mechanisms of
chronic inflammation-associated organ fibrosis. Front Immunol. 2012;3:71.
32. Harris WT, Kelly DR, Zhou Y, Wang D, MacEwen M, Macewen M, Hagood JS,
Clancy JP, Ambalavanan N, Sorscher EJ. Myofibroblast differentiation and
enhanced TGF-B signaling in cystic fibrosis lung disease. PLoS One.
2013;8(8):e70196.
33. Brenner DA, Kisseleva T, Scholten D, Paik YH, Iwaisako K, Inokuchi S,
Schnabl B, Seki E, De Minicis S, Oesterreicher C, et al. Origin of myofibroblasts
in liver fibrosis. Fibrogenesis Tissue Repair. 2012;5 Suppl 1:S17.
34. Rockey DC, Weymouth N, Shi Z. Smooth muscle α actin (Acta2) and
myofibroblast function during hepatic wound healing. PLoS One.
2013;8(10):e77166.
35. Batista ML, Henriques FS, Neves RX, Olivan MR, Matos-Neto EM, Alcântara PS,
Maximiano LF, Otoch JP, Alves MJ, Seelaender M. Cachexia-associated adipose
tissue morphological rearrangement in gastrointestinal cancer patients.
J Cachexia Sarcopenia Muscle. 2016;7(1):37–47.
36. RODBELL M. Metabolism of isolated fat cells. I. Effects of hormones on
glucose metabolism and lipolysis. J Biol Chem. 1964;239:375–80.
37. Wynn TA. IL-13 effector functions. Annu Rev Immunol. 2003;21:425–56.
38. Isailovic N, Daigo K, Mantovani A, Selmi C. Interleukin-17 and innate
immunity in infections and chronic inflammation. J Autoimmun.
2015;60:1–11.
39. Reiman RM, Thompson RW, Feng CG, Hari D, Knight R, Cheever AW,
Rosenberg HF, Wynn TA. Interleukin-5 (IL-5) augments the progression of
liver fibrosis by regulating IL-13 activity. Infect Immun. 2006;74(3):1471–9.
40. Sutherland TE, Logan N, Rückerl D, Humbles AA, Allan SM,
Papayannopoulos V, Stockinger B, Maizels RM, Allen JE. Chitinase-like
proteins promote IL-17-mediated neutrophilia in a tradeoff between
nematode killing and host damage. Nat Immunol. 2014;15(12):1116–25.
41. Massagué J, Chen YG. Controlling TGF-beta signaling. Genes Dev.
2000;14(6):627–44.
42. Shi Y, Massagué J. Mechanisms of TGF-beta signaling from cell membrane
to the nucleus. Cell. 2003;113(6):685–700.
43. Massagué J. TGFβ signalling in context. Nat Rev Mol Cell Biol.
2012;13(10):616–30.
44. Lok C. Cachexia: The last illness. Nature. 2015;528(7581):182–3.
45. Nakajima I, Yamaguchi T, Ozutsumi K, Aso H. Adipose tissue extracellular
matrix: newly organized by adipocytes during differentiation. Differentiation.
1998;63(4):193–200.
46. Spencer M, Yao-Borengasser A, Unal R, Rasouli N, Gurley CM, Zhu B,
Peterson CA, Kern PA. Adipose tissue macrophages in insulin-resistant
subjects are associated with collagen VI and fibrosis and demonstrate
alternative activation. Am J Physiol Endocrinol Metab. 2010;299(6):E1016–1027.
Alves et al. BMC Cancer (2017) 17:190
47. Pasarica M, Gowronska-Kozak B, Burk D, Remedios I, Hymel D, Gimble J,
Ravussin E, Bray GA, Smith SR. Adipose tissue collagen VI in obesity.
J Clin Endocrinol Metab. 2009;94(12):5155–62.
48. Chu ML, Conway D, Pan TC, Baldwin C, Mann K, Deutzmann R, Timpl R.
Amino acid sequence of the triple-helical domain of human collagen type
VI. J Biol Chem. 1988;263(35):18601–6.
49. Singh P, Carraher C, Schwarzbauer JE. Assembly of fibronectin extracellular
matrix. Annu Rev Cell Dev Biol. 2010;26:397–419.
50. Taleb S, Cancello R, Clément K, Lacasa D. Cathepsin s promotes human
preadipocyte differentiation: possible involvement of fibronectin
degradation. Endocrinology. 2006;147(10):4950–9.
51. Gioulbasanis I, Patrikidou A, Kitikidou K, Papadimitriou K, Vlachostergios PJ,
Tsatsanis C, Margioris AN, Papandreou CN, Mavroudis D, Georgoulias V.
Baseline plasma levels of interleukin-8 in stage IV non-small-cell lung cancer
patients: relationship with nutritional status and prognosis. Nutr Cancer.
2012;64(1):41–7.
52. Ziora D, Jastrzębski D, Adamek M, Czuba Z, Kozielski JJ, Grzanka A,
Kasperska-Zajac A. Circulating concentration of markers of angiogenic
activity in patients with sarcoidosis and idiopathic pulmonary fibrosis.
BMC Pulm Med. 2015;15:113.
53. Borthwick LA, Barron L, Hart KM, Vannella KM, Thompson RW, Oland S,
Cheever A, Sciurba J, Ramalingam TR, Fisher AJ, et al. Macrophages are
critical to the maintenance of IL-13-dependent lung inflammation and
fibrosis. Mucosal Immunol. 2016;9(1):38–55.
54. Wynn TA, Vannella KM. Macrophages in tissue repair, regeneration, and
fibrosis. Immunity. 2016;44(3):450–62.
55. van der Velden JL, Guala AS, Leggett SE, Sluimer J, Badura EC,
Janssen-Heininger YM. Induction of a mesenchymal expression program in lung
epithelial cells by wingless protein (Wnt)/β-catenin requires the presence of
c-Jun N-terminal kinase-1 (JNK1). Am J Respir Cell Mol Biol. 2012;47(3):306–14.
56. David CJ, Huang YH, Chen M, Su J, Zou Y, Bardeesy N, Iacobuzio-Donahue
CA, Massagué J. TGF-β Tumor Suppression through a Lethal EMT. Cell.
2016;164(5):1015–30.
57. Tsurutani Y, Fujimoto M, Takemoto M, Irisuna H, Koshizaka M, Onishi S,
Ishikawa T, Mezawa M, He P, Honjo S, et al. The roles of transforming
growth factor-β and Smad3 signaling in adipocyte differentiation and
obesity. Biochem Biophys Res Commun. 2011;407(1):68–73.
58. Samad F, Uysal KT, Wiesbrock SM, Pandey M, Hotamisligil GS, Loskutoff DJ.
Tumor necrosis factor alpha is a key component in the obesity-linked
elevation of plasminogen activator inhibitor 1. Proc Natl Acad Sci U S A.
1999;96(12):6902–7.
59. Alessi MC, Bastelica D, Morange P, Berthet B, Leduc I, Verdier M, Geel O,
Juhan-Vague I. Plasminogen activator inhibitor 1, transforming growth
factor-beta1, and BMI are closely associated in human adipose tissue during
morbid obesity. Diabetes. 2000;49(8):1374–80.
60. Fain JN, Tichansky DS, Madan AK. Transforming growth factor beta1
release by human adipose tissue is enhanced in obesity. Metabolism.
2005;54(11):1546–51.
61. Dahlman I, Mejhert N, Linder K, Agustsson T, Mutch DM, Kulyte A, Isaksson B,
Permert J, Petrovic N, Nedergaard J, et al. Adipose tissue pathways involved in
weight loss of cancer cachexia. Br J Cancer. 2010;102(10):1541–8.
62. Zhang YE. Non-smad signaling pathways of the TGF-β family. Cold spring
harb perspect Biol. 2017;9(2):a022129. doi:10.1101/cshperspect.a022129.
63. Nakayama Y, Komuro R, Yamamoto A, Miyata Y, Tanaka M, Matsuda M,
Fukuhara A, Shimomura I. RhoA induces expression of inflammatory
cytokine in adipocytes. Biochem Biophys Res Commun. 2009;379(2):288–92.
64. Hara Y, Wakino S, Tanabe Y, Saito M, Tokuyama H, Washida N, Tatematsu S,
Yoshioka K, Homma K, Hasegawa K, et al. Rho and Rho-kinase activity in
adipocytes contributes to a vicious cycle in obesity that may involve
mechanical stretch. Sci Signal. 2011;4(157):ra3.
Page 12 of 12
Submit your next manuscript to BioMed Central
and we will help you at every step:
• We accept pre-submission inquiries
• Our selector tool helps you to find the most relevant journal
• We provide round the clock customer support
• Convenient online submission
• Thorough peer review
• Inclusion in PubMed and all major indexing services
• Maximum visibility for your research
Submit your manuscript at
www.biomedcentral.com/submit