Log odds of positive lymph nodes is prognostically equivalent to lymph node ratio in non-metastatic colon cancer
Bạn đang xem bản rút gọn của tài liệu. Xem và tải ngay bản đầy đủ của tài liệu tại đây (1.06 MB, 10 trang )
Baqar et al. BMC Cancer
(2020) 20:762
/>
RESEARCH ARTICLE
Open Access
Log odds of positive lymph nodes is
prognostically equivalent to lymph node
ratio in non-metastatic colon cancer
Ali Riaz Baqar1, Simon Wilkins1,2* , Wei Wang2,3, Karen Oliva1 and Paul McMurrick1
Abstract
Background: Globally, colorectal cancer (CRC) is the third and second leading cancer in men and women respectively
with 600,000 deaths per year. Traditionally, clinicians have relied solely on nodal disease involvement, and measurements
such as lymph node ratio (LNR; the ratio of metastatic/positive lymph nodes to total number of lymph nodes examined),
when determining patient prognosis in CRC. The log odds of positive lymph nodes (LODDS) is a logistic transformation
formula that uses pathologic lymph node data to stratify survival differences among patients within a single stage of
disease. This formula allows clinicians to identify whether patients with clinically aggressive tumours fall into higher-risk
groups regardless of nodal positivity and can potentially guide adjuvant treatment modalities. The aim of this study was
to investigate whether LODDS in colon cancer provides better prognostication compared to LNR.
Methods: A retrospective study of patients on the prospectively maintained Cabrini Monash University Department of
Surgery colorectal neoplasia database, incorporating data from hospitals in Melbourne Australia, identified patients
entered between January 2010 and March 2016. Association of LODDS and LNR with clinical variables were analysed.
Disease-free (DFS) and overall (OS) survival were investigated with Cox regression and Kaplan–Meier survival analyses.
Results: There were 862 treatment episodes identified in the database (402 male, 47%). The median patient age was 73
(range 22–100 years). There were 799 colonic cancers and 63 rectosigmoid cancers. The lymph node yield (LNY) was
suboptimal (< 12) in 168 patients (19.5%) (p = 0.05). The 5-year OS for the different LNR groups were 86, 91 and 61% (p <
0.001) for LNR0 (655 episodes), LNR1 (128 episodes) and LNR2 (78 episodes), respectively. For LODDS, they were 85, 91 and
61% (p < 0.001) in LODDS0 (569 episodes), LODDS1 (217 episodes) and LODDS2 (75 episodes) groups (p < 0.001). Overall
survival rates were comparable between the LNR and LODDS group and for LNY < 12 and stage III patients when each
were sub-grouped by LODDS and LNR.
Conclusion: This study has shown for that the prognostic impact of LODDS is comparable to LNR for colon cancer
patients. Accordingly, LNR is recommended for prognostication given its ease of calculation.
Keywords: Colon cancer, Lymph nodes, Patient outcomes
* Correspondence:
1
Department of Surgery, Cabrini Hospital, Cabrini Monash University, Malvern,
VIC 3144, Australia
2
Department of Epidemiology and Preventive Medicine, Monash University,
Melbourne, VIC 3004, Australia
Full list of author information is available at the end of the article
© The Author(s). 2020 Open Access This article is licensed under a Creative Commons Attribution 4.0 International License,
which permits use, sharing, adaptation, distribution and reproduction in any medium or format, as long as you give
appropriate credit to the original author(s) and the source, provide a link to the Creative Commons licence, and indicate if
changes were made. The images or other third party material in this article are included in the article's Creative Commons
licence, unless indicated otherwise in a credit line to the material. If material is not included in the article's Creative Commons
licence and your intended use is not permitted by statutory regulation or exceeds the permitted use, you will need to obtain
permission directly from the copyright holder. To view a copy of this licence, visit />The Creative Commons Public Domain Dedication waiver ( applies to the
data made available in this article, unless otherwise stated in a credit line to the data.
Baqar et al. BMC Cancer
(2020) 20:762
Background
Globally, colorectal cancer (CRC) is the third and second
leading cancer in men and women respectively with 600,
000 deaths per year [1]. Nodal status in surgical oncology can be used to assist in prognostication [2], guide
decision making regarding adjuvant chemotherapy [3]
and the number of examined lymph nodes examined or
the lymph node yield (LNY) can be used as a marker for
the quality of an oncological resection [4]. In CRC surgery, harvesting a minimum of 12 lymph nodes has been
set as an acceptable benchmark. If the LNY is below 12,
this has been suggested to be correlated with understaging of the disease [5].
Lymph node ratio (LNR) (defined as the ratio of metastatic lymph nodes to the total number of lymph nodes
examined) has been investigated as an adjunct parameter
to conventional nodal staging. The LNR aids in prognosis and for identifying high-risk patients [6]. However, in
node-negative colon cancer, which accounts for approximately 75% of patients who have surgery for colon cancer, LNR is zero and is the same as the pN0
classification and therefore does not provide any additional prognostic information [7].
Traditionally, clinicians have relied solely on nodal disease involvement (including the total number of positive
lymph nodes) when determining patient prognosis in
CRC [8]. Biologically aggressive tumours however, can
initially be placed in the same stage as less clinically aggressive tumours, irrespective of nodal disease. The log
odds of positive lymph nodes (LODDS) is a logistic
transformation formula that uses pathologic lymph node
data to stratify survival differences among patients
within a single stage of disease. This formula allows clinicians to identify whether patients with clinically aggressive tumours fall into higher-risk groups regardless
of nodal positivity and can potentially guide adjuvant
treatment modalities.
Recently LODDS has been proposed as a novel prognostic index in colonic and non-colonic cancers [9–11].
In all of these studies, the classification of lymph node
status by LODDS proved to be a powerful prognostic
indicator with a strong ability to identify patients with a
homogeneous prognosis, regardless of lymph node status and count. The aim of this study was to investigate
the prognostic impact of LODDS and compare the survival of patients classified in LNR and LODDS groups
who underwent a colonic cancer resection.
Methods
The prospectively maintained Cabrini Monash University colorectal neoplasia database [12] which contains
a representative case mix of patients from both the
public and private health sector, was examined for
consecutive patients treated for colon adenocarcinoma
Page 2 of 10
under the care of 11 colorectal surgeons at Cabrini
and Alfred hospitals (Melbourne, Victoria, Australia)
between January 2010 and March 2016. Data extracted from the database included patient demographics, tumour characteristics, lymph node yield,
medical co-morbidities, and oncological end points
(local and distal recurrence, overall survival). Patients
were divided into groups according to their LNR and
LODDS. Survival analysis was performed and compared for the subgroups within LODDS and LNR. Patients who presented with synchronous colonic
tumours, metastatic disease, and ASA 5 (American
Society of Anesthesiologists) were excluded.
The LNR was defined as the number of positive lymph
nodes divided by the total number of lymph nodes harvested. Patients were divided into three LNR groups
based on previous literature [9]: LNR0 (< 0.05), LNR1
(0.05–0.20) and LNR2 (> 0.20). At least 12 harvested
lymph nodes were accepted as an adequate number and
tumour staging was performed according to the seventh
edition of the AJCC TNM manual [13]. Pathological
examination of lymph nodes in resected specimens relied on manual dissection by the pathologists. A low
LNY was defined as fewer than 12 lymph nodes in the
resected specimen.
LODDS is defined as the log of the ratio between the
number of positive lymph nodes and the number of negative lymph nodes. LODDS is calculated using an empirical
logistic transform formula: log (positive nodes + 0.5)/(total
nodal count - positive nodes + 0.5). Patients were divided
into three groups based on published LODDS studies specific to colorectal neoplasia [9]: LODDS0 (<− 1.36),
LODDS1 (− 1.36 to − 0.53) and LODDS2 (> − 0.53).
Surveillance after surgery involved clinical examination,
computed tomography (CT) scan of the chest, abdomen
and pelvis, colonoscopic visualisation of the residual colon
and carcinoembryonic antigen (CEA) levels, all performed
at varying intervals post-surgery. Radiology and/or histological studies were used to diagnose local recurrence or
distant metastasis. The follow-up was conducted until July
2016. The primary outcomes for the study were overall
survival and disease-free survival.
Statistical analysis
Data analysis was performed using the R 3.5.1 (Windows) statistical package [14]. The effects of clinical
variables, LODDS and LNY on disease-free survival
(DFS) and overall survival (OS) were investigated
using survival analysis techniques such as KaplanMeier and log-rank tests. Independent prognostic factors were identified in both univariate and multivariate analyses (Cox regression). The significance level
was set at 5%, and terms were included in the models
Baqar et al. BMC Cancer
(2020) 20:762
when the p value was below this level. P < 0.05 was
considered statistically significant.
Power calculation was carried out based using the R
statistical package [14]. The covariates of interest used
in the estimation were LNR and LODDS groups together with additional predictors. With the number of
episodes of 862, a significance level of 0.05, and a number of different sets of parameters for overall survival
and disease-free survival for LNR and LODDS models,
the estimated powers were 91.69% for LNR model and
93.39% for LODDS model for the overall survival, while
the powers of disease-free survival were 92.29% for the
LNR model and 93.04% for the LODDS model. Therefore, there was sufficient power for the study.
Results
Between January 2010 and March 2016, a total of 862 treatment episodes were identified from 856 patients on the
colorectal neoplasia database. Patient demographics identified 402 men (47%) and the median age of the cohort was
73 (range 22–100) years. The highest percentage of cancer
localization occurred in the sigmoid colon (25.2%) and the
ascending colon (20.0%). The LNY was ≥12 in 694 episodes
(80.5%). The median duration of follow-up was 27.1 (range
0.1–71) months. Patient characteristics and clinicopathological features are summarised in Table 1.
Five-year OS rates for women and men were 86 and 82%
respectively (p = 0.4; Table 1). 5-year OS was reduced with
increasing age, increasing T stage, N stage, ASA, and with
lymphovascular invasion (LVI) (Table 1). Five-year OS rates
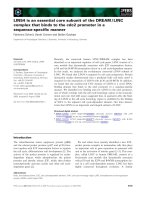
for the different LNR groups were 85.8% for LNR0, 90.7%
for LNR1, and 61.3% for LNR2 (p < 0.0001; Fig. 1). The 5year OS stratified by nodal stages were 85.2% for pN0,
85.3% for pN1 and 71.2% pN2 (p = 0.01); by LODDS classification were 84.5% for LODDS0, 91.0% for LODDS1 and
61.1% for LODDS2 (p < 0.001; Fig. 1a and b). Five-year OS
was not significantly different (p = 0.5) between patients
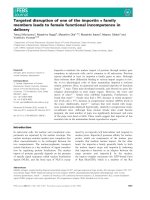
with LNY < 12 and LNY ≥12 (85.4% vs. 83.4%) however, in
the subgroup analysis of patients with LNY < 12, both LNR
(p < 0.0001) and LODDS (p < 0.002) retained prognostic
value for 5-year OS (Fig. 2a and b).
The univariate Cox regression analysis identified ten
variables associated with survival that were statistically
significant (Table 2): age ≥ 80 (p < 0.001), sigmoid colon
tumours (p < 0.001), T3 stage (p = 0.012), T4 stage (p <
0.001), N2 stage (p = 0.002), ASA 3 (p = 0.003), ASA 4
(p < 0.001), lymphovascular invasion (LVI) (p = 0.017),
LNR ≥0.2 (p < 0.001) and LODDS2 (p < 0.001). In multivariate analysis, age ≥ 80, hepatic flexure tumour site,
sigmoid colon tumour site, T4 stage, and LNY ≥ 12 were
identified as independent prognostic factors of OS when
data was sub-grouped into LNR and LODDS categories
(Table 3).
Page 3 of 10
OS rates over 5 years decreased with advancing ASA;
96% OS survival for ASA I and 46% for ASA 4 (p < 0.001).
619 patients (72.3%) were lymph node negative (pN0) and
thus all the patients were inherently in the LNR0 group.
Overall survival rates of node-negative patients were not
significantly different between the different LODDS0 and
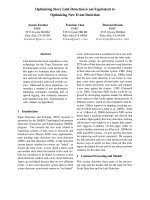
LODDS1 groups. When OS was analysed for the 243 patients with stage III colon cancer it was observed that both
LNR (p = 0.047) and LODDS (p = 0.019) were associated
with decreased survival (Fig. 3a and b). During the study
period 56 patients died (5.6%), 55 experienced a recurrence of their cancer (6.4%), and the mean follow-up time
was 26.5 months (SD 16.2 months).
In univariate analyses of disease free survival (DFS),
positive circumferential margins (p = 0.006), and the
presence of lymphovascular invasion (p = 0.016) were
significant, however no predictors were significant on
multivariate analyses. Log rank tests of DFS survival
curves showed no significance for patients staged by
LNR groups (p = 0.13), LODDS groups (p = 0.77), <
12LNY (LNR groups; p = 0.12), < 12LNY (LODDS
groups; p = 0.9), stage III colon cancer (LNR groups; p =
0.79), stage III colon cancer (LODDS groups; p = 0.73).
Discussion
The current study compares the prognostic impact between LODDS and LNR in the surgical management of
colon cancer. In the present study of patients with nonmetastatic colonic and rectosigmoid cancers, overall
survival rates were comparable between LNR and
LODDS groups. Patient factors (age > 80 and ASA 3/4)
and tumour factors (tumour location, tumour stage,
nodal stage, LVI, LNR and LODDS) were related to 5year OS in univariate analysis. Our finding of LNR
being related to 5-year OS is similar to a Danish cohort
study of 8901 patients, where LNR was superior to Nstage in differentiating overall survival in stage III colon
cancer [15]. Data on LODDS in colorectal cancer
remains limited and accordingly LNR is more frequently used.
A systematic review from Ceelan et al., showed that
LNR is a more accurate prognostic method for colorectal cancer patients and gives a superior prediction of survival to the TNM system [16, 17]. Although the LNR
classification has been proven to be superior to the pN
classification, there are limitations in using this for prognostic assessment. LNR has no prognostic value in
node-negative cancer patients because of having the
same definition of a LNR0 classification as pN0 classification. If there are inadequate lymph nodes harvested,
then LNR is not prognostically accurate [18, 19].
LODDS is a novel indicator that improves the accuracy of lymph node evaluation for prognostic assessment
irrespective of nodal positivity status and has been
Baqar et al. BMC Cancer
(2020) 20:762
Page 4 of 10
Table 1 Patient and tumour characteristics and 5-year overall survival
Variable
N (%)
N (1st episode)
n = 856
Sex
Age at first surgery
Male
T stage
N stage
ASA
Pathological grade
LVI
CRM
LNY
LNR groups
LODDS
82 (73.5, 91.5)
Female
454 (53.0)
86 (80.2, 92.2)
< 60
146 (17.1)
91.5 (82.9, 100)
60–79
424 (49.5)
91.3 (87.1, 95.7)
≥ 80
286 (33.4)
65.4 (51.1, 83.7)
p-value
0.4
< 0.001
n = 862
N (All episodes)
Tumour site
402 (47.0)
5-year OS (95% CI)
Caecum
143 (16.6)
77.4 (67.4, 89)
Ascending colon
172 (20.0)
69 (51.4, 92.6)
Hepatic flexure
61 (7.1)
92.4 (82.8, 100)
Transverse colon
130 (15.1)
83 (72.9, 94.6)
Splenic flexure
43 (5.0)
n/a
Descending colon
33 (3.8)
n/a
Sigmoid colon
217 (25.2)
98.9 (97.3, 100)
Rectosigmoid
63 (7.3)
82.8 (68.6, 100)
0–2
327 (37.9)
93.3 (88.9, 97.9)
3
451 (52.3)
80.4 (71.5, 90.4)
4
84 (9.7)
n/a
0
619 (71.8)
85.2 (79, 91.9)
1
165 (19.1)
85.3 (74.2, 98.1)
2
78 (9.0)
71.2 (57.4, 88.4)
1
151 (17.5)
95.9 (90.0, 100)
2
348 (40.4)
91.0 (86.6, 95.7)
3
315 (36.5)
73.7 (60.2, 90.3)
4
47 (5.5)
46.1 (28.9, 73.6)
Undifferentiated
5 (0.6)
n/a
Poor differentiation
164 (19.0)
74.7 (64.5, 86.6)
Moderate differentiation
579 (67.2)
85.3 (78.1, 93)
Well differentiated
47 (5.5)
91.7 (77.3, 100)
No
591 (68.6)
84.9 (78.5, 91.8)
Yes
244 (28.3)
81.7 (74.6, 89.4)
Negative > 1 mm
465 (53.9)
79.6 (69.3, 91.4)
Positive ≤1 mm
8 (0.9)
n/a
Not reported
375 (43.5)
86.6 (81.8, 91.6)
<12
168 (19.5)
85.4 (78.6, 92.9)
≥12
694 (80.5)
83.4 (76.7, 90.6)
< 0.05
655 (76.0)
85.8 (79.8, 92.3)
0.05 to < 0.2
128 (14.8)
90.7 (82.8, 99.4)
≥0.2
78 (9.0)
61.3 (45.3, 82.9)
<−1.36
569 (66.0)
84.5 (77.6, 92.1)
−1.36 to −0.53
217 (25.2)
91.0 (85.7, 96.6)
> − 0.53
75 (8.7)
61.1 (44.9, 83.2)
< 0.001
< 0.001
0.01
< 0.001
0.009
0.02
0.4
0.5
< 0.001
< 0.001
ASA American Society of Anesthesiologists, CI Confidence interval, CRM Circumferential margin, LNR Lymph node ratio, LNY Lymph node yield, LODDS Log odds of
positive lymph nodes, LVI Lymphovascular invasion, OS Overall survival.
Baqar et al. BMC Cancer
(2020) 20:762
Page 5 of 10
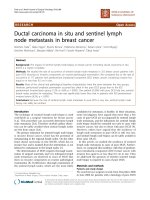
Fig. 1 Kaplan-Meier survival curves of the patients staged by LNR and LODDS. a. Overall survival by LNR groups. b Overall survival by
LODDS groups
identified in many malignancies as a superior prognostic marker compared to LNR [10, 11]. In an analysis of 2547 curative gastric cancer patients treated
with radical resection, LODDS was identified as a better prognostic indicator for overall survival than the
LNR [20]. Similar findings have been mirrored for
breast cancer patients [21]. In colonic cancers,
LODDS was found to be an independent prognostic
factor which has prognostic superiority compared to
LNR or pN disease [22].
It has been proposed that the lymph node count can
be used as a measure of the quality of surgery [23],
however adequate lymph node harvesting cannot be
achieved in approximately half of patients [24]. In the
present study, 19.5% of all colon cancer resections were
below the current benchmark of a minimum harvest of
12 lymph nodes; this is comparable to contemporary
data from specialist centres [8, 25], but more favourable
than that from other population-based studies [26, 27].
This variation in nodal harvesting can be due to patient
Baqar et al. BMC Cancer
(2020) 20:762
Page 6 of 10
Fig. 2 Kaplan-Meier survival curves for patients with fewer than 12 examined lymph nodes stratified by LNR and LODDS (n = 168). a Overall
survival for patients with LNY < 12 by LNR groups. b Overall survival for patients with LN < 12 by LODDS
factors (older age), operative factors (left sided/rectal
operations) or the quality of the histopathological
examination [28]. Studies have shown that colorectal
surgeons have a higher LNY compared to those operations performed by non-specialists [29, 30]. The LNY
was adequate in 80% of cases and the eleven surgeons
contributing patients to our database are specialist
colorectal surgeons.
Arslan et al, found that LODDS was better than LNR
at providing more oncologically relevant information as
it is less influenced by the LNY. Furthermore, LNR was
not sufficient to stage patients when LNY was < 12 [9].
The prognostic values of both LODDS and LNR in this
study were independent of the number of harvested
nodes. In sub-group analysis of the patients with < 12
LNY in the present study, both LODDS and LNR were
significant predictors of 5-year OS. When comparing 5year OS between LNY < 12 to LNY ≥12, no statistical
differences were found when adjusted for either LNR or
LODDS.
Baqar et al. BMC Cancer
(2020) 20:762
Page 7 of 10
Table 2 Univariate analysis for overall survival
Variable
Univariate analysis
HR (95% CI)
p-value
1st episode (n = 856)
Sex
Age (yrs)
Male
Reference group
Female
0.788 (0.466, 1.332)
0.37
< 60
Reference group
60–79
1.462 (0.492, 4.345)
0.494
80+
6.129 (2.177, 17.257)
< 0.001
All episodes (n = 862)
Tumour site
T stage
N stage
ASA
Pathological grade
LVI
CRM
≥ 12 LNY
LNR groups
LODDS
Caecum
Reference group
Ascending colon
0.961 (0.484, 1.908)
0.910
Hepatic flexure
0.372 (0.085, 1.627)
0.189
Transverse colon
0.757 (0.340, 1.686)
0.495
Splenic flexure
0.450 (0.103, 1.968)
0.289
Descending colon
0.596 (0.136, 2.607)
0.492
Sigmoid colon
0.080 (0.018, 0.350)
< 0.001
Rectosigmoid
0.534 (0.194, 1.469)
0.224
0–2
Reference group
3
2.501 (1.221, 5.123)
0.012
4
10.032 (4.529, 22.221)
< 0.001
0
Reference group
1
0.878 (0.408, 1.891)
0.740
2
2.852 (1.483, 5.487)
0.002
1
Reference group
2
3.843 (0.884, 16.715)
0.073
3
8.702 (2.059, 36.767)
0.003
4
30.668 (6.918, 135.948)
< 0.001
Undifferentiated
< 0.001 (< 0.001, < 0.001)
0.996
Poor differentiation
2.43 (1.415, 4.168)
0.001
Moderate differentiation
Reference group
Well differentiated
0.515 (0.070, 3.776)
No
Reference group
Yes
1.916 (1.124, 3.264)
Negative > 1 mm
Reference group
Positive ≤1 mm
2.838 (0.382, 21.084)
0.31
Not reported
0.764 (0.441, 1.322)
0.34
No
Reference group
0.514
0.017
Yes
0.803 (0.449, 1.435)
< 0.05
Reference group
0.46
0.05 to < 0.2
0.732 (0.287, 1.867)
0.51
≥ 0.2
3.775 (2.063, 6.908)
< 0.001
<−1.36
Reference group
−1.36 to −0.53
0.852 (0.428, 1.695)
0.65
> 0.53
3.715 (1.974, 6.991)
< 0.001
ASA American Society of Anesthesiologists, CI Confidence interval, CRM Circumferential margin, LNR Lymph node ratio, LNY Lymph node yield, LODDS Log odds of
positive lymph nodes, LVI Lymphovascular invasion.
Baqar et al. BMC Cancer
(2020) 20:762
Page 8 of 10
Table 3 Multivariate analysis for overall survival
Variable
Multivariate analysis
p - value
HR (95% CI)
HR (95% CI)
p - value
1st episode (n = 856)
Sex
Age (yrs)
Male
–
–
Female
–
–
< 60
–
–
60–79
–
–
80+
All episodes (n = 862)
Tumour site
–
–
–
–
Pathological grade
LVI
CRM
≥12 LNY
0.212 (0.046, 0.980)
0.047
0.200 (0.043, 0.922)
0.039
Transverse colon
–
–
Splenic flexure
–
–
Descending colon
–
–
0.092 (0.020, 0.421)
0.002
0.079 (0.017, 0.368)
0.001
Rectosigmoid
–
–
0–2
–
–
3
–
–
4
ASA
LODDS
Ascending colon
Sigmoid colon
N stage
< 0.001
Caecum
Hepatic flexure
T stage
6.208 (2.204, 17.484)
LNR
8.92 (3.520, 22.605)
< 0.001
8.57 (3.394, 21.655)
< 0.001
0
-*
-*
1
-*
-*
2
*
-
-*
1
-*
-*
2
*
-
-*
3
-*
-*
4
*
-
-*
Undifferentiated
–
–
Poor differentiation
–
–
Moderate differentiation
–
–
Well differentiated
–
–
No
–
–
Yes
–
–
Negative > 1 mm
–
–
Positive ≤1 mm
–
–
Not reported
–
–
No
–
–
Yes
0.423 (0.220, 0.813)
0.010
0.382 (0.199, 0.734)
0.004
ASA American Society of Anesthesiologists, CI Confidence interval, CRM Circumferential margin, LNR Lymph node ratio, LNY Lymph node yield, LODDS Log odds of
positive lymph nodes, LVI Lymphovascular invasion.
*
omitted due to collinearity
Conclusion
The study is the first study to examine LODDS in the
Australian region (with Australia having one of the highest rates of colorectal cancer in the world) and is one of
the largest published single centre series examining
LODDS. This study has shown that the prognostic impact of LODDS is comparable to LNR for overall colon
cancers and when stratified for stage III patients and patients with a LNY < 12. Since the prognostic information
provided between the two is equivalent, LNR may be
Baqar et al. BMC Cancer
(2020) 20:762
Page 9 of 10
Fig. 3 Kaplan–Meier survival curves of the patients with Stage III colon cancer stratified by LNR and LODDS. a Overall survival for stage III colon
cancer by LNR groups. b Overall survival for stage III colon cancer by LODDS groups
more clinically practical due to the simple calculation required. Further research is needed to assess whether the
addition of the LODDS to the N category defined by the
TNM would affect the selection of colon cancer patients
who may most benefit from adjuvant treatments.
Abbreviations
AJCC: American Joint Committee on Cancer; ASA: American Society of
Anesthesiologists;; CEA: Carcinoembryonic antigen; CI: Confidence interval;
CRC: Colorectal cancer; CRM: Circumferential resection margin; CT: Computed
tomography; DFS: Disease-free survival; LNR: Lymph node ratio; LNY: Lymph
node yield; LODDS: Log odds of positive lymph nodes; LVI: Lymphovascular
invasion; OS: Overall survival; TNM: Tumour nodes metastasis.
Acknowledgements
The authors thank colorectal surgeons S. Bell, M. Chin, P. Carne, K. C. Farmer,
A. Polglase, P. Ranchod, P. Simpson, S. Skinner, R. Wale and S. Warrier for
contributing their patients to this study. The authors thank Dr. Margaret
Staples for additional statistical support during this project. They also thank
Let’s Beat Bowel Cancer www.letsbeatbowelcancer.com. a benevolent
fundraising and public awareness organization, for financial support during
this project.
Authors’ contributions
ARB, SW, and PM designed the study, carried out prospective data collection,
carried out retrospective data collection, analysed the data, and prepared the
manuscript. KO carried out prospective data collection, carried out
retrospective data collection, analysed the data, and prepared the
Baqar et al. BMC Cancer
(2020) 20:762
manuscript. WW designed the study, analysed the data, and prepared the
manuscript. All authors have read and approved the final manuscript.
Funding
This study was funded in part by “Let’s Beat Bowel Cancer” a benevolent
fund raising and public awareness foundation. The funders had no role in
study design, data collection and analysis, decision to publish, or preparation
of the manuscript.
Availability of data and materials
The datasets generated during and/or analysed during the current study are
not publicly available as study participants were assured raw data would
remain confidential and not be shared.
Ethics approval and consent to participate
Human Research ethics committee approval was obtained prior to
commencement of the study (#02–10–04-06). Informed written consent was
obtained from all patients entered on the Cabrini Monash colorectal
neoplasia database.
Consent for publication
Not applicable.
Competing interests
The authors declare that they have no competing interests.
Author details
Department of Surgery, Cabrini Hospital, Cabrini Monash University, Malvern,
VIC 3144, Australia. 2Department of Epidemiology and Preventive Medicine,
Monash University, Melbourne, VIC 3004, Australia. 3Cabrini Institute, Cabrini
Hospital, Malvern, VIC 3144, Australia.
1
Received: 21 May 2020 Accepted: 4 August 2020
References
1. Siegel RL, Miller KD, Jemal A. Cancer statistics, 2015. CA Cancer J Clin. 2015;
65:5–29.
2. Lee HY, Choi HJ, Park KJ, et al. Prognostic significance of metastatic lymph
node ratio in node-positive colon carcinoma. Ann Surg Oncol. 2007;14:
1712–7.
3. Carrato A. Adjuvant treatment of colorectal Cancer. Gastrointestinal Cancer
Res. 2008;2:S42–S6.
4. McDonald JR, Renehan AG, O’Dwyer ST, Haboubi NY. Lymph node harvest
in colon and rectal cancer: current considerations. World J Gastrointestinal
Surg. 2012;4:9–19.
5. Wong SL. Lymph node counts and survival rates after resection for colon
and rectal cancer. Gastrointest Cancer Res. 2009;3:S33–5.
6. Galizia G, Orditura M, Ferraraccio F, et al. The lymph node ratio is a powerful
prognostic factor of node-positive colon cancers undergoing potentially
curative surgery. World J Surg. 2009;33:2704–13.
7. Ricciardi R, Madoff RD, Rothenberger DA, Baxter NN. Population-based
analyses of lymph node metastases in colorectal cancer. Clin Gastroenterol
Hepatol. 2006;4:1522–7.
8. Lee CHA, Wilkins S, Oliva K, Staples MP, McMurrick PJ. Role of lymph node
yield and lymph node ratio in predicting outcomes in non-metastatic
colorectal cancer. BJS Open. 2019;3:95–105.
9. Arslan NC, Sokmen S, Canda AE, Terzi C, Sarioglu S. The prognostic impact
of the log odds of positive lymph nodes in colon cancer. Color Dis. 2014;16:
O386–92.
10. Calero A, Escrig-Sos J, Mingol F, et al. Usefulness of the log odds of positive
lymph nodes to predict and discriminate prognosis in gastric carcinomas. J
Gastrointest Surg. 2015;19:813–20.
11. Chen L-J, Chung K-P, Chang Y-J, Chang Y-J. Ratio and log odds of positive
lymph nodes in breast cancer patients with mastectomy. Surg Oncol. 2015;
24:239–47.
12. McMurrick PJ, Oliva K, Carne P, et al. The first 1000 patients on an internetbased colorectal neoplasia database across private and public medicine in
Australia: development of a binational model for the colorectal surgical
Society of Australia and new Zealand. Dis Colon Rectum. 2014;57:167–73.
Page 10 of 10
13. American Joint Committee on Cancer. AJCC Cancer staging manual (7th
edn). New York: Springer; 2010.
14. R Core Team. R: A language and environment for statistical computing.
Vienna, Austria: R Foundation for Statistical Computing URL 2018.
15. Lykke J, Roikjaer O, Jess P. The relation between lymph node status and
survival in stage I-III colon cancer: results from a prospective nationwide
cohort study. Color Dis. 2013;15:559–65.
16. Wang J, Hassett JM, Dayton MT, Kulaylat MN. Lymph node ratio: role in the
staging of node-positive colon cancer. Ann Surg Oncol. 2008;15:1600–8.
17. Ceelen W, Van Nieuwenhove Y, Pattyn P. Prognostic value of the lymph
node ratio in stage III colorectal cancer: a systematic review. Ann Surg
Oncol. 2010;17:2847–55.
18. Rosenberg R, Engel J, Bruns C, et al. The prognostic value of lymph node
ratio in a population-based collective of colorectal cancer patients. Ann
Surg. 2010;251:1070–8.
19. Zhang M-R, Xie T-H, Chi J-L, et al. Prognostic role of the lymph node ratio
in node positive colorectal cancer: a meta-analysis. Oncotarget. 2016;7:
72898–907.
20. Sun Z, Xu Y, Li DM, et al. Log odds of positive lymph nodes. Cancer. 2010;
116:2571–80.
21. Vinh-Hung V, Verschraegen C, Promish DI, et al. Ratios of involved nodes in
early breast cancer. Breast Cancer Res. 2004;6:R680.
22. Wang J, Hassett JM, Dayton MT, Kulaylat MN. The prognostic superiority of
log odds of positive lymph nodes in stage III Colon Cancer. J Gastrointest
Surg. 2008;12:1790–6.
23. Parsons HM, Tuttle TM, Kuntz KM, Begun JW, McGovern PM, Virnig BA.
Association between lymph node evaluation for colon cancer and node
positivity over the past 20 years. Jama. 2011;306:1089–97.
24. Veen T, Nedrebo BS, Stormark K, Soreide JA, Korner H, Soreide K. Qualitative
and quantitative issues of lymph nodes as prognostic factor in colon
cancer. Dig Surg. 2013;30:1–11.
25. Dent OF, Newland RC, Chan C, Bokey L, Chapuis PH. Trends in pathology
and long-term outcomes after resection of colorectal cancer: 1971-2013.
ANZ J Surg. 2017;87:34–8.
26. Nathan H, Shore AD, Anders RA, Wick EC, Gearhart SL, Pawlik TM. Variation
in lymph node assessment after colon cancer resection: patient, surgeon,
pathologist, or hospital? J Gastrointest Surg. 2011;15:471–9.
27. Ahmadi O, Stringer MD, Black MA, McCall JL. Clinico-pathological factors
influencing lymph node yield in colorectal cancer and impact on survival:
analysis of New Zealand cancer registry data. J Surg Oncol. 2015;111:451–8.
28. Tekkis PP, Smith JJ, Heriot AG, Darzi AW, Thompson MR, Stamatakis JD. A
national study on lymph node retrieval in resectional surgery for colorectal
cancer. Dis Colon Rectum. 2006;49:1673–83.
29. Hsu C-W, Lin C-H, Wang J-H, Wang H-T, Ou W-C, King T-M. Factors that
influence 12 or more harvested lymph nodes in early-stage colorectal
Cancer. World J Surg. 2009;33:333–9.
30. Lykke J, Jess P, Roikjaer O. Increased lymph node yield is associated with
improved survival in rectal Cancer irrespective of Neoadjuvant treatment:
results from a National Cohort Study. Dis Colon Rectum. 2015;58:823–30.
Publisher’s Note
Springer Nature remains neutral with regard to jurisdictional claims in
published maps and institutional affiliations.