Upregulation of the proto-oncogene Bmi-1 predicts a poor prognosis in pediatric acute lymphoblastic leukemia
Bạn đang xem bản rút gọn của tài liệu. Xem và tải ngay bản đầy đủ của tài liệu tại đây (653.69 KB, 8 trang )
Peng et al. BMC Cancer (2017) 17:76
DOI 10.1186/s12885-017-3049-3
RESEARCH ARTICLE
Open Access
Upregulation of the proto-oncogene Bmi-1
predicts a poor prognosis in pediatric acute
lymphoblastic leukemia
Hong-Xia Peng1, Xiao-Dan Liu2, Zi-Yan Luo1, Xiao-Hong Zhang1, Xue-Qun Luo3, Xiao Chen4, Hua Jiang1*
and Ling Xu1*
Abstract
Background: Bmi-1, the B cell-specific moloney murine leukemia virus insertion site 1, is a member of the
Polycomb-group (PcG) family and acts as an oncogene in various tumors; however, its expression related to
the prognosis of pediatric patients with acute lymphoblastic leukemia (ALL) has not been well studied.
Methods: The Bmi-1 expression levels in the bone marrow of 104 pediatric ALL patients and 18 normal
control subjects were determined by using qRT-PCR. The association between the Bmi-1 expression and the
clinicopathological characteristics of pediatric ALL patients was analyzed, and the correlation between Bmi-1
and the prognosis of pediatric ALL was calculated according to the Kaplan–Meier method. Furthermore, the
association between Bmi-1 expression and its transcriptional regulator Sall4 was investigated.
Results: Compared to normal control subjects, patients with primary pediatric ALL exhibited upregulated levels of
Bmi-1. However, these levels were sharply decreased in patients who achieved complete remission. A significant
positive association between elevated Bmi-1 levels and a poor response to prednisone as well as an increased
clinical risk was observed. Patients who overexpressed Bmi-1 at the time of diagnosis had a lower relapse-free
survival (RFS) rate (75.8%), whereas patients with lower Bmi-1 expression had an RFS of 94.1%. Furthermore, in
ALL patients, the mRNA expression of Bmi-1 was positively correlated to the mRNA expression of Sall4a.
Conclusions: Taken together, these data suggest that Bmi-1 could serve as a novel prognostic biomarker in
pediatric primary ALL and may be partially regulated by Sall4a. Our study also showed that Bmi-1 could serve
as a new therapeutic target for the treatment of pediatric ALL.
Keywords: Bmi-1, Pediatric acute lymphoblastic leukemia, Sall4, Prognosis
Background
Acute lymphoblastic leukemia (ALL) is a common
pediatric malignant tumor characterized by the overproduction and accumulation of immature lymphoid cells
and accounts for nearly 25% of all cancers among children
younger than 15 years old [1]. Although treatment options
for ALL have significantly expanded in the last 10 years,
15–20% of ALL patients cannot achieve long-term remission, and relapse remains a challenge in treating pediatric
* Correspondence: ;
1
Department of Hematology, Guangzhou Women and Children’s Medical
Center, Guangzhou Medical University, 9 Jinsui Road, Guangzhou,
Guangdong 510623, China
Full list of author information is available at the end of the article
ALL. Therefore, identifying novel prognostic markers is
an urgent issue in ALL [2, 3].
The Bmi-1 (B cell-specific moloney murine leukemia
virus integration site 1) gene is a recognized oncogene of
the Polycomb-group (PcG) family and was originally
identified via retroviral insertional mutagenesis in Eμ-cmyc transgenic mice that were infected with the Moloney
murine leukemia virus [4, 5]. The human Bmi-1 gene is
located at chr.10p13, which has been shown to undergo
rearrangements in malignant T cell lymphomas and
chromosomal translocation in infant leukemia [6–8].
Bmi-1 has been implicated to play a critical role in a number of biological pathways, including stem cell self-renewal
© The Author(s). 2017 Open Access This article is distributed under the terms of the Creative Commons Attribution 4.0
International License ( which permits unrestricted use, distribution, and
reproduction in any medium, provided you give appropriate credit to the original author(s) and the source, provide a link to
the Creative Commons license, and indicate if changes were made. The Creative Commons Public Domain Dedication waiver
( applies to the data made available in this article, unless otherwise stated.
Peng et al. BMC Cancer (2017) 17:76
Page 2 of 8
[9–11], DNA damage response [12, 13], cell cycle [14]
and senescence [15, 16].
Recently, Bmi-1 has been the focus of significant clinical
interest because studies have demonstrated its upregulation in various malignancies such as non-small cell lung
cancer [17], breast cancer [18, 19] and colorectal cancer
[20], as well as hematological malignancies including
mantle cell lymphoma [21], B cell non-Hodgkin’s lymphoma [22] and acute myeloid leukemia (AML) [23]. Abnormal overexpression of Bmi-1 has also been proposed to be
involved in tumor invasion, metastasis, cancer therapy
failure, and poor prognosis. For example, elevated Bmi-1
levels were observed in 38.7% (29/ 75) cases in nasopharyngeal carcinoma, and its overexpression is correlated to
the patients’ survival rate: the 5-year overall survival rate
was higher in the Bmi-1-negative group than that in the
Bmi-1-positive group (84.2% vs.47.6%) [24]. Similar results
were also observed in prostate cancer [25, 26], chronic
myeloid leukemia [27, 28] and diffuse large B cell lymphomas [29]. Although a relationship between Bmi-1 expression and the prognosis of patients with pediatric ALL has
not been determined, the biological functions of Bmi-1
suggest that this protein could play a crucial role in the
pathogenesis of pediatric ALL.
In consideration of the important role of Bmi-1 expression in tumorigenesis, the regulation of Bmi-1 is also
thought to be essential. Some studies have revealed that
Sall4 directly regulates Bmi-1 in both mouse models and
human AML cell lines [30, 31]. Consistent with this, a
positive correlation between the expression of the Bmi-1
and Sall4 genes was also discovered in the placenta and
umbilical cord blood groups [32]. However, to the best
of our knowledge, there are no data describing whether
Sall4 contributes to the pathogenesis of leukemia.
The current study analyzed the expression and prognostic value of Bmi-1 in pediatric ALL and further elucidated the relationship between Bmi-1 and Sall4. Our
results indicated that Bmi-1 was frequently upregulated
in patients with ALL compared to healthy subjects, and
patients with upregulated Bmi-1 at the time of diagnosis
had a lower relapse-free survival (RFS) rate than patients
who had lower Bmi-1 expression. In addition, Bmi-1 was
observed to be positively correlated to Sall4a. Our data
suggest that Bmi-1 could serve as a novel biomarker for
the prognostic evaluation of patients with pediatric ALL.
The demographics of the patients and healthy donors are
summarized in the supplementary data (Additional file 1:
Table S1 and Additional file 2: Table S2). Bone marrow
was collected from the patients via bone marrow puncture
either at the time of diagnosis or during follow-up after
treatment. The research protocols were approved by the
Ethics Committee of Guangzhou Women and Children’s
Medical Center and the First Affiliated Hospital of Sun
Yat-sen University. Written informed consent was obtained from the participants’ parents or guardians.
Methods
Statistical analysis
Patients and samples
All results were analyzed using proper statistical methods.
Beyond the traditional descriptive statistical analyses,
inferential analyses were performed using nonparametric
methods. Differences in the mRNA expression between
two groups (e.g., control vs primary, primary vs complete
remission (CR), CR vs relapse) were analyzed using the
Mann–Whitney U test for independent unpaired samples
Tissue samples from 85 ALL patients before initiation of
therapy, 19 ALL patients after therapy completion and
18 healthy subjects were collected between July 2006
and June 2009 at the Guangzhou Women and Children’s
Medical Center of Guangzhou Medical University and
the First Affiliated Hospital of Sun Yat-sen University.
RNA isolation and quantitative reverse transcription
polymerase chain reaction (qRT-PCR)
Total RNA was extracted from patient samples by using
TRIzol reagent (Life Technologies, Grand Island, NY)
according to the manufacturer’s protocol. The purity
and integrity of total RNA were tested to assess the
RNA quality. First, the OD ratios at A260/A280 and
A260/A230 ranged between 1.8-2; second, the ratio of
the 28S and 18S rRNA bands, which were assessed by
denaturing gel electrophoresis, was approximately 2:1.
For qRT-PCR, cDNA was synthesized from 100 ng total
RNA using ABI TaqMan® Reverse Transcription Reagents
(Thermo Fisher Scientific Inc., Waltham, MA USA). For
first-strand cDNA synthesis, 100 ng of total RNA was
used with random hexamer primers, 1× TaqMan RT buffer, 50 U of MultiScribe Reverse Transcriptase and 40 U of
RNase inhibitor in a final volume of 20 μl. The mixture
was incubated for 10 min at 25 °C, 30 min at 48 °C,
and 5 min at 95 °C. Then, qPCR was performed using a
Platinum® Quantitative PCR SuperMix-UDG kit (Thermo
Fisher Scientific Inc.) according to the standard TaqMan®
protocol. The qPCR was performed in a 20 μl PCR reaction containing l μl RT product, 1× PCR SuperMixUDG, and 100 nM probe. The reactions were performed
in a 96-well plate with an initial denaturation at 95 °C
for 2 min followed by 40 cycles of 95 °C for 15 s and
60 °C for 30 s. All PCR reactions were run in triplicate
with GAPDH used as an internal control. All the
primers used are listed in Additional file 3: Table S3.
The relative expression of each gene was calculated
according to the comparative 2−ΔΔCt method where
ΔCt = Ct (target gene) – Ct (GAPDH) and ΔΔCt = ΔCt
(sample) − ΔCt (control); the processed data are presented as the fold change of each mRNA.
Peng et al. BMC Cancer (2017) 17:76
Page 3 of 8
and the Wilcoxon test for paired samples. In instances of
comparisons among more than two groups (e.g., samples
divided into the low-risk group (LR), intermediate risk
group (IR) and high-risk group (HR)), the Kruskal-Wallis
test was performed first followed by Bonferroni’s correction for multiple comparisons. For categorical variables,
the χ2 or Fisher exact tests were used, and correlations
were determined using the Spearman rank correlation
coefficient(r). An analysis of RFS—defined as the time
from CR to relapse—was performed according to the
Kaplan–Meier method, and comparisons of outcomes
among subgroups were performed by using the log-rank
test. A two-sided P < 0.05 was considered to represent a
statistically significant difference. All calculations were
performed using GraphPad Prism 6.0 software.
Results
Analysis of Bmi-1 expression levels in pediatric ALL patients
To determine the expression pattern of Bmi-1 in pediatric
ALL, 85 bone marrow specimens from pediatric patients
with primary ALL and 18 bone marrow specimens from
normal subjects were analyzed by using qRT-PCR. Bmi-1
expression was detected in all of the bone marrow samples, with significantly higher expression observed in the
primary ALL samples compared with that in the samples
from healthy donors (P < 0.001, Fig. 1a). Among the 85
ALL samples, 56 (65.9%) cases showed greater than 2-fold
upregulation in Bmi-1 expression. To study the changes
in Bmi-1 expression before and after therapy treatment,
we detected the Bmi-1 levels in pairs of samples from
individuals who achieve CR after treatment (n = 19). Interestingly, the results found that Bmi-1 expression was
sharply decreased in the majority of CR samples (73.7%)
after treatment, suggesting that Bmi-1 could be a prognostic indicator (Fig. 1b, P = 0.0446). It is noted that the Bmi1 expression level was still higher than that in normal
control subjects although the induction therapy inhibited
its expression in these patients to some extent (Additional
file 4: Figure S1, P = 0.0026). In addition, we assessed several samples by using Western blot. The preliminary data
showed that the protein expression levels of Bmi-1 were
higher in primary ALL samples than those in the control
samples, and Bmi-1 protein expression was slightly
decreased in ALL patients who achieved CR, which was
consistent with the mRNA expression pattern (data not
shown). Therefore, the significant difference in Bmi-1
expression between primary ALL patients and patients
who achieved CR implied that Bmi-1 could be used as
an important biomarker for clinical prognosis.
Relationship between Bmi-1 expression and the
clinicopathological characteristics of pediatric ALL patients
To determine whether Bmi-1 expression correlates with
the clinicopathological characteristics of pediatric ALL
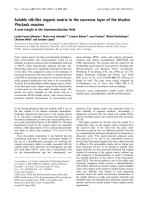
Fig. 1 Bmi-1 expression was increased in the pediatric ALL clinical
specimens. The qRT-PCR assay was repeated three times and produced
similar results for each replicate. The Bmi-1 levels are presented as the
means ± standard deviation (M ± SD) and were normalized to the
GAPDH levels. a The average expression levels of Bmi-1 in pediatric
ALL patients (n = 85) versus normal control subjects (n = 18). b The
average expression levels of Bmi-1 before and after therapy (n = 19) in
the paired samples from pediatric ALL patients. ***P < 0.001; *P < 0.05.
CR, complete remission
patients, we divided the patients into high and low
groups based on the median value of Bmi-1 expression
among the cohort. Notably, highly expressed Bmi-1
was found to be closely correlated to a poor response
to prednisone (p = 0.039) and was significantly more
prevalent among clinically higher risk groups (p =
0.002) (Table 1). To further detect the expression
level of Bmi-1 in different clinical risk grade groups,
all patients were divided into three hierarchy subgroups (LR, IR, and HR) according to their clinical
information (e.g., patient age, initial leukocyte count,
Peng et al. BMC Cancer (2017) 17:76
Page 4 of 8
Table 1 Relationship characteristics of pediatric ALL and Bmi-1
expression level
n
Characteristics
P value
Bmi-1
Low expression
High expression
Age at diagnosis, y
0.100
<6
43
30 (69.8%)
13 (30.2%)
≥6
42
22 (52.4%)
20 (47.6%)
Gender
0.161
Male
60
26 (43.3%)
34 (56.7%)
Female
25
15 (60%)
10 (40%)
< 50
53
30 (56.6%)
23 (43.4%)
≥ 50
32
13 (40.6%)
19 (59.4%)
9
WBC count (×10 /L)
0.153
0.315a
FAB classification
L1
34
13 (38.2%)
21 (61.8%)
L2
47
26 (55.3%)
21 (44.6%)
L3
4
2 (50%)
2 (50%)
a
Immunophenotype
0.281
T
11
4 (36.4%)
7 (63.6%)
B
66
39 (59%)
27 (41%)
0.329a
BCR/ABL
+
8
3 (37.5%)
5 (62.5%)
-
64
40 (62.5%)
24 (37.5%)
Prednisone-test
0.039
PGR
61
36 (59%)
25 (41%)
PPR
14
4 (28.6%)
10 (71.4%)
0.002a
Risk group
LR
16
14 (87.5%)
2 (12.5%)
IR
31
16 (51.6%)
15 (48.4%)
HR
31
10 (32.3%)
21 (67.7%)
a
Two-sided Fisher’s exact test
chromosomal aberrations, immunophenotype, minimal
residual disease and responsiveness to chemotherapy)
as described in Yeoh AE et al. [33] and the CCLGALL-2008 protocol [34]. The results showed that
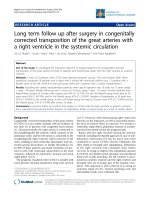
Bmi-1 expression exhibited an incremental trend in
pediatric ALL patients that corresponded to the
clinic risk grades: Bmi-1 showed the highest expression in the HR group followed by the IR group and
the LR group (Fig. 2, P < 0.001). Compared with that
in the LR group, the Bmi-1 expression was approximately 3-fold higher in the IR group and almost 8fold higher in the HR group. However, there were no
correlations between Bmi-1 expression and other
available pathological data, including gender, age,
white blood cell count (WBC), FAB classification and
BCR/ABL fusion gene.
Fig. 2 Expression of Bmi-1 mRNA in the low-, intermediate and
high-risk groups. ***P < 0.001. LR, low-risk group; IR, intermediate
risk group and HR, high-risk group
The influence of Bmi-1 expression on the prognosis of
pediatric ALL
Of the 85 initially enrolled patients, 14 patients (16.5%)
abandoned treatment after diagnosis, and 4 patients
(4.7%) received hematopoietic stem cell transplantation
and then ceased contact. The remaining 67 pediatric
ALL patients (78.8%) received substantially distinct therapies utilizing the IC-BFM 2002 or VHR-ALL GZCLG
protocols according to their clinical risk classification
after diagnosis. (The details of treatment regimens were
available in Additional file 5: Table S4.) The characteristics of the analyzed pediatric ALL subgroups are listed
in Additional file 6: Table S5. Compared with those lost
to the follow-up, the analyzed subgroup (treatment
group) showed no differences in the distribution of the
available parameters (e.g., gender, age, WBC count, FAB
classification and BCR/ABL fusion gene). After a median
follow-up of 17 months (range from 4 to 42 months),
the 3-year RFS was 85.1%. In addition, 10 patients (14.9%)
relapsed: 7 patients (10.4%) with isolated BM relapse, 2
patients (3%) with isolated central nervous system relapse,
and 1 patient (1.5%) with testicular and BM relapse. The
remaining 57 patients were in continuous CR.
After conducting a follow-up with these patients, we
found that the Bmi-1 expression in the patients who relapsed (n = 10) was nearly 5-fold higher at the time of
diagnosis than that of the remaining 57 patients with
continuous CR (P < 0.01, Fig. 3a). The results indicated that
Bmi-1 expression was related to leukemia relapse; thus, we
hypothesized that Bmi-1 could act as a biomarker for predicting leukemia relapse. To confirm it, we detected the
expression level of Bmi-1 in 57 newly diagnosed pediatric
ALL patients using the same methods described above and
found that the levels of Bmi-1 at the time of diagnosis were
correlated to RFS. When the full set of 57 samples were divided into different expression groups, we observed that
Peng et al. BMC Cancer (2017) 17:76
Page 5 of 8
0.3778). Furthermore, we found that there was no significant difference regarding the expression of Sall4a and
Sall4b between pediatric ALL and normal control samples.
In addition, there was also no difference between primary
and CR groups (Additional file 7: Figure S2).
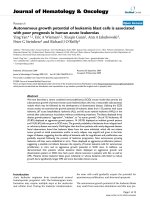
Fig. 3 Bmi-1 expression was associated with ALL patient prognosis.
a A total of 67 primary ALL patient samples were divided according
to clinical outcomes. Patients who relapsed had significantly higher
Bmi-1 expression levels than those who achieved CR after therapy.
b The 3-year relapse-free survival (RFS) curves from a panel of 57
ALL patients. The cases were dichotomized based on the median
expression of Bmi-1. Statistical differences between the curves were
calculated by using the log-rank test, and the two-sided P value is
indicated below the graph. **P < 0.01
patients with Bmi-1 high-expressed at the time diagnosis
had a lower RFS rate (75.8%) than patients with low expression of Bmi-1, who had an RFS rate of 94.1% (Fig. 3b).
Elevated expression of Bmi-1 in pediatric ALL is associated
with the expression of Sall4a
It was previously reported that there was a significant relationship between the expression of Sall4 and Bmi-1 in
AML samples. Based on this evidence, we measured the
mRNA levels of Sall4 in pediatric ALL specimens and
normal control tissues with the goal of identifying the
possible mechanism that causes overexpression of Bmi-1
in ALL. We observed a significantly positive correlation
between Bmi-1 expression and Sall4a (Fig. 4a, 2-tailed
Spearman’s correlation, r = 0.2707; P = 0.0122); however,
there was no statistical correlation between the Sall4b and
Bmi-1 expression levels in the ALL samples examined
(Fig. 4b, 2-tailed Spearman’s correlation, r = 0.09686; P =
Discussion
New biomarkers could be helpful in predicting treatment
outcomes earlier and more precisely, which is of great
interest to physicians and researchers in the field. This report describes for the first time that the proto-oncogene
Bmi-1 is aberrantly expressed in the majority of primary
ALL patients, and this expression is sharply decreased in
CR patients after therapy. It has been shown that patients
with elevated Bmi-1 expression at the time of diagnosis
possessed a significantly higher likelihood of a poor response to prednisone and a higher clinical risk classification. Furthermore, we found that ectopic expression of
Bmi-1 was closely associated with a poor prognosis for
ALL patient survival, as patients with increased Bmi-1 expression had a significantly lower OS. Thus, this study not
only extends our knowledge about the upregulation of this
PcG protein but also verifies that Bmi-1 is an important
and promising candidate tumor biomarker to predict the
prognosis of pediatric patients with ALL.
There have been many studies that investigated the
prognostic value of Bmi-1 expression in other types of
tumors. Consistent with our results, research on ovarian
cancer [35], breast cancer [36, 37], clear cell renal cancer
[38], laryngeal carcinoma [39], cervical cancer [40], and
esophageal adenocarcinoma [41] have reported an association between high Bmi-1 expression and an unfavorable
prognosis. It has also been reported that high expression
of Bmi-1 in AML cells is associated with an unfavorable
prognosis [42]. In brief, Bmi-1 is at an important lynchpin
in more than ten different types of cancer, and a wide
spectrum of malignancies implicate Bmi-1 as a suitable
candidate for predicting outcomes.
However, Teruyuki et al. [43] reported that Bmi-1 gene
expression was lower in pediatric ALL and that there were
no significant correlations between the Bmi-1 gene expression level in leukemic cells and clinical characteristics
such as patient prognosis. These results were inconsistent
with those of our study, which may be due to the different
leukemia subtype and the limited number of samples. In
Teruyuki’s study, the bone marrow-derived cells were
obtained from 15 patients with pediatric precursor B-ALL
that were sorted into different subsets by FACS, and
CD19+ cells were treated as normal B cells for the analysis. In our study, we used mononuclear cells from the
bone marrow instead of sorted normal B cells.
It has been well established that Bmi-1 is an essential
regulator of cellular senescence [16, 44] and that overexpression of Bmi-1 could prevent the development of
Peng et al. BMC Cancer (2017) 17:76
Page 6 of 8
Fig. 4 Bmi-1 expression was positively correlated with Sall4a expression in ALL patient samples. a A statistically significant positive correlation
between the mRNA levels of Bmi-1 and Sall4a was observed in pediatric ALL specimens (r = 0.2707, P = 0.0122). b No statistically significant
correlation between the mRNA levels of Bmi-1 and Sall4b was observed in pediatric ALL specimens (r = 0.09686, P = 0.3778)
senescence in proliferating cells by directly repressing the
expression of p16Ink4a and p19Arf [45]. Glucocorticoids
then play a major role in apoptosis of hematopoietic cells
including lymphocytes [46], exposure to the glucocorticoid dexamethasone results in changes for the expression
of genes associated with cellular senescence, for example,
upregulating cell cycle-related genes p16 and p21 [47].
Therefore, it is conceivable that Bmi-1 expression in ALL
might counteract the effects of glucocorticoids on the
cellular senescence pathway. Consequently, this could
also explain why ALL patients with high Bmi-1 expression exhibited a poor response to prednisone.
Furthermore, our results also demonstrated that Sall4a
and Sall4b, the two Sall4 isoforms, were constitutively
expressed in pediatric ALL patients as well as in normal
control subjects, although there was no statistically significant difference in these values between pediatric ALL samples and normal control samples. Similar to Bmi-1, Sall4
expression has been reported in numerous hematological
malignancies, including myelodysplastic syndromes [48],
AML [49, 50], chronic myelogenous leukemia [51] and
precursor B cell lymphoblastic lymphoma [52, 53]. In
addition, we found that the Bmi-1 gene expression levels
showed a significantly positive correlation with Sall4a but
not Sall4b. This result further verified the conclusion that
a relationship between the Bmi-1 and Sall4 expression
level in hematological malignancies, which was coincide
with previously reports in AML samples [30, 31]. In
addition, these findings indicate that Sall4a and Sall4b may
have different functions in pediatric ALL. However, one
would expect that Sall4a expression would be higher in
primary ALL cells, but this was not the case in our study.
We speculate that this discrepancy could be due to the
weak correlation between Bmi-1 and Sall4a expression
(r = 0.2707) and additional factors involved in the complex regulation of Bmi-1 expression. In addition, Sall4a expression was slightly higher in primary ALL cells, but this
increase was not significant. Sall4a is upstream of Bmi-1,
and little difference was observed between individuals
because of the amplification of the downstream signaling
cascade. To better clarify this effect, more experiments
with a larger cohort are needed. However, the precise molecular mechanism of Bmi-1 in pediatric ALL still remains
unclear and requires further elucidation.
Conclusion
In summary, we provided evidence that Bmi-1 was significantly upregulated in pediatric ALL and that Bmi-1
overexpression was associated with a poor response to
prednisone and a higher clinical risk. In addition, a significantly poorer outcome was observed in patients in
the high Bmi-1 expression group. These findings suggest
that Bmi-1 is an effective biomarker for predicting the
prognosis of patients with pediatric ALL, and future
studies should explore whether Bmi-1 could be a potential therapeutic target as well.
Additional files
Additional file 1: Table S1. Detailed demographic characteristics of
pediatric patients with ALL (n = 85). (XLSX 15 kb)
Additional file 2: Table S2. The demographic characteristics of healthy
donors (n = 18). (DOCX 16 kb)
Additional file 3: Table S3. Sequences of the PCR primers and TaqMan
probes. (DOCX 16 kb)
Additional file 4: Figure S1. The expression levels of Bmi-1 in pediatric
ALL patients who achieved CR versus normal control subjects. The fold
changes of data were presented with respect to the levels in the bone
marrow from healthy donors (n = 18). **P < 0.01; CR, complete remission.
(TIF 3 MB)
Additional file 5: Table S4. Details of treatment regimens for patients
with pediatric ALL. (DOCX 20 kb)
Additional file 6: Table S5. Characteristics of the analyzed pediatric
ALL subgroup. (DOCX 16 kb)
Additional file 7: Figure S2. The expression levels of Sall4 in pediatric
ALL clinical specimens. (A) The average expression levels of Sall4a in
pediatric ALL patients (n = 85) versus that in normal control subjects
(n = 18), P = 0.0783. (B) The average expression level of Sall4b in pediatric
ALL patients (n = 85) versus that in normal control subjects (n = 18),
P = 0.2935. (C) The average expression levels of Sall4a before and after
therapy (n = 19) in the paired samples from pediatric ALL patients,
Peng et al. BMC Cancer (2017) 17:76
P = 0.3247. (D) The average expression levels of Sall4b before and
after therapy (n = 19) in the paired samples from pediatric ALL
patients, P = 0.8984. (JPG 1 MB)
Abbreviations
ALL: Acute lymphoblastic leukemia; AML: Acute myeloid leukemia; Bmi-1: B
cell-specific Moloney murine leukemia virus insertion site 1; CR: Complete
remission; HR: High-risk; HSC: Hematopoietic stem cell; IR: Intermediate
risk; LR: Low-risk; PcG: Polycomb-group; qRT-PCR: Quantitative reverse
transcription polymerase chain reaction; RFS: Relapse-free survival;
WBC: White blood cell count
Page 7 of 8
5.
6.
7.
8.
9.
Acknowledgements
Not applicable.
Funding
This work was supported by a National Nature and Science Grant of China
(No. 81272310) and the Natural Science Foundation of Guangdong Province,
China (2015A030313769).
Availability of data and materials
All data generated or analyzed during this study are included either in this
article or in the supplementary information files.
Authors’ contributions
HXP performed the experiments, made the statistical analysis, and revised
the manuscript. XDL participated in the experiments and drafted the
manuscript. ZYL, XQL and XC participated in the collecting the clinical
information and specimens. XHZ participated in the experiments and
samples collection. LX and HJ participated in its design of this study,
coordinated and helped to draft and revised the manuscript. All authors
read and approved the final manuscript.
Competing interests
The authors declare that they have no competing interests.
10.
11.
12.
13.
14.
15.
16.
17.
Consent for publication
Written informed consent was obtained from each patient for the
publication of this research. A copy of the written consent is available
for review by the Editor-in-Chief of this journal.
Ethics approval and consent to participate
All written informed consent was obtained from the participants’ parents or
guardians. The research protocols were approved by the Ethics Committee
of Guangzhou Women and Children’s Medical Center and the First Affiliated
Hospital of Sun Yat-sen University.
18.
19.
20.
Author details
1
Department of Hematology, Guangzhou Women and Children’s Medical
Center, Guangzhou Medical University, 9 Jinsui Road, Guangzhou,
Guangdong 510623, China. 2Division of Birth Cohort Study, Guangzhou
Women and Children’s Medical Center, Guangzhou Medical University,
Guangzhou, China. 3Department of Pediatrics, The First Affiliated Hospital of
Sun Yat-sen University, Guangzhou, China. 4Department of Pediatrics,
Zhuzhou Central Hospital, Zhuzhou, China.
21.
22.
Received: 29 January 2016 Accepted: 9 January 2017
23.
References
1. Hunger SP, Mullighan CG. Acute lymphoblastic leukemia in children. N Engl
J Med. 2015;373(16):1541–52.
2. Bailey LC, Lange BJ, Rheingold SR, Bunin NJ. Bone-marrow relapse in paediatric
acute lymphoblastic leukaemia. Lancet Oncol. 2008;9(9):873–83.
3. Bhojwani D, Pui CH. Relapsed childhood acute lymphoblastic leukaemia.
Lancet Oncol. 2013;14(6):e205–17.
4. Haupt Y, Alexander WS, Barri G, Klinken SP, Adams JM. Novel zinc finger gene
implicated as myc collaborator by retrovirally accelerated lymphomagenesis in
Eμ-myc transgenic mice. Cell. 1991;65(5):753–63.
24.
25.
van Lohuizen M, Verbeek S, Scheijen B, Wientjens E, van der Gulden H,
Berns A. Identification of cooperating oncogenes in Eμ-myc transgenic
mice by provirus tagging. Cell. 1991;65(5):737–52.
Berger R, Baranger L, Bernheim A, Valensi F, Flandrin G. Cytogenetics of T-cell
malignant lymphoma. Report of 17 cases and review of the chromosomal
breakpoints. Cancer Genet Cytogenet. 1988;36(1):123–30.
Alkema MJ, Wiegant J, Raap AK, Berns A, van Lohuizen M. Characterization
and chromosomal localization of the human proto-oncogene BMI-1. Hum
Mol Genet. 1993;2(10):1597–603.
Pui CH, Raimondi SC, Murphy SB, Ribeiro RC, Kalwinsky DK, Dahl GV, Crist
WM, Williams DL. An analysis of leukemic cell chromosomal features in
infants. Blood. 1987;69(5):1289–93.
Lessard J, Sauvageau G. Bmi-1 determines the proliferative capacity of
normal and leukaemic stem cells. Nature. 2003;423(6937):255–60.
Molofsky AV, Pardal R, Iwashita T, Park IK, Clarke MF, Morrison SJ. Bmi-1
dependence distinguishes neural stem cell self-renewal from progenitor
proliferation. Nature. 2003;425(6961):962–7.
Park IK, Qian D, Kiel M, Becker MW, Pihalja M, Weissman IL, Morrison SJ,
Clarke MF. Bmi-1 is required for maintenance of adult self-renewing
haematopoietic stem cells. Nature. 2003;423(6937):302–5.
Facchino S, Abdouh M, Chatoo W, Bernier G. BMI1 confers radioresistance
to normal and cancerous neural stem cells through recruitment of the
DNA damage response machinery. J Neurosci. 2010;30(30):10096–111.
Ismail IH, Andrin C, McDonald D, Hendzel MJ. BMI1-mediated histone
ubiquitylation promotes DNA double-strand break repair. J Cell Biol.
2010;191(1):45–60.
Bruggeman SW, Hulsman D, Tanger E, Buckle T, Blom M, Zevenhoven J,
van Tellingen O, van Lohuizen M. Bmi1 controls tumor development in an
Ink4a/Arf-independent manner in a mouse model for glioma. Cancer Cell.
2007;12(4):328–41.
Zencak D, Lingbeek M, Kostic C, Tekaya M, Tanger E, Hornfeld D, Jaquet M,
Munier FL, Schorderet DF, van Lohuizen M, et al. Bmi1 loss produces an
increase in astroglial cells and a decrease in neural stem cell population
and proliferation. J Neurosci. 2005;25(24):5774–83.
DiMauro T, Cantor DJ, Bainor AJ, David G. Transcriptional repression of
Sin3B by Bmi-1 prevents cellular senescence and is relieved by oncogene
activation. Oncogene. 2015;34(30):4011–7.
Vonlanthen S, Heighway J, Altermatt HJ, Gugger M, Kappeler A, Borner MM,
van Lohuizen M, Betticher DC. The bmi-1 oncoprotein is differentially
expressed in non-small cell lung cancer and correlates with INK4A-ARF
locus expression. Br J Cancer. 2001;84(10):1372–6.
Kim JH, Yoon SY, Jeong SH, Kim SY, Moon SK, Joo JH, Lee Y, Choe IS, Kim JW.
Overexpression of Bmi-1 oncoprotein correlates with axillary lymph node
metastases in invasive ductal breast cancer. Breast. 2004;13(5):383–8.
Honig A, Weidler C, Hausler S, Krockenberger M, Buchholz S, Koster F,
Segerer SE, Dietl J, Engel JB. Overexpression of polycomb protein BMI-1
in human specimens of breast, ovarian, endometrial and cervical cancer.
Anticancer Res. 2010;30(5):1559–64.
Kim JH, Yoon SY, Kim CN, Joo JH, Moon SK, Choe IS, Choe YK, Kim JW. The
Bmi-1 oncoprotein is overexpressed in human colorectal cancer and correlates
with the reduced p16INK4a/p14ARF proteins. Cancer Lett. 2004;203(2):217–24.
Bea S, Tort F, Pinyol M, Puig X, Hernandez L, Hernandez S, Fernandez PL,
van Lohuizen M, Colomer D, Campo E. BMI-1 gene amplification and
overexpression in hematological malignancies occur mainly in mantle
cell lymphomas. Cancer Res. 2001;61(6):2409–12.
van Kemenade FJ, Raaphorst FM, Blokzijl T, Fieret E, Hamer KM, Satijn DP,
Otte AP, Meijer CJ. Coexpression of BMI-1 and EZH2 polycomb-group
proteins is associated with cycling cells and degree of malignancy in B-cell
non-Hodgkin lymphoma. Blood. 2001;97(12):3896–901.
Sawa M, Yamamoto K, Yokozawa T, Kiyoi H, Hishida A, Kajiguchi T, Seto M,
Kohno A, Kitamura K, Itoh Y, et al. BMI-1 is highly expressed in M0-subtype
acute myeloid leukemia. Int J Hematol. 2005;82(1):42–7.
Song LB, Zeng MS, Liao WT, Zhang L, Mo HY, Liu WL, Shao JY, Wu QL, Li
MZ, Xia YF, et al. Bmi-1 is a novel molecular marker of nasopharyngeal
carcinoma progression and immortalizes primary human nasopharyngeal
epithelial cells. Cancer Res. 2006;66(12):6225–32.
van Leenders GJ, Dukers D, Hessels D, van den Kieboom SW, Hulsbergen
CA, Witjes JA, Otte AP, Meijer CJ, Raaphorst FM. Polycomb-group
oncogenes EZH2, BMI1, and RING1 are overexpressed in prostate
cancer with adverse pathologic and clinical features. Eur Urol. 2007;
52(2):455–63.
Peng et al. BMC Cancer (2017) 17:76
26. Davies NM, Gaunt TR, Lewis SJ, Holly J, Donovan JL, Hamdy FC, Kemp JP,
Eeles R, Easton D, Kote-Jarai Z, et al. The effects of height and BMI on
prostate cancer incidence and mortality: a Mendelian randomization study
in 20,848 cases and 20,214 controls from the PRACTICAL consortium.
Cancer Causes Control. 2015;26(11):1603–16.
27. Yong AS, Stephens N, Weber G, Li Y, Savani BN, Eniafe R, Keyvanfar K,
Kurlander R, Rezvani K, Barrett AJ. Improved outcome following allogeneic
stem cell transplantation in chronic myeloid leukemia is associated with
higher expression of BMI-1 and immune responses to BMI-1 protein.
Leukemia. 2011;25(4):629–37.
28. Mohty M, Szydlo RM, Yong AS, Apperley JF, Goldman JM, Melo JV. Association
between BMI-1 expression, acute graft-versus-host disease, and outcome
following allogeneic stem cell transplantation from HLA-identical siblings
in chronic myeloid leukemia. Blood. 2008;112(5):2163–6.
29. van Galen JC, Muris JJ, Oudejans JJ, Vos W, Giroth CP, Ossenkoppele GJ,
Otte AP, Raaphorst FM, Meijer CJ. Expression of the polycomb-group
gene BMI1 is related to an unfavourable prognosis in primary nodal DLBCL.
J Clin Pathol. 2007;60(2):167–72.
30. Yang J, Chai L, Liu F, Fink LM, Lin P, Silberstein LE, Amin HM, Ward DC,
Ma Y. Bmi-1 is a target gene for SALL4 in hematopoietic and leukemic cells.
Proc Natl Acad Sci U S A. 2007;104(25):10494–9.
31. Shen Q, Liu S, Hu J, Chen S, Yang L, Li B, Wu X, Ma Y, Yang J, Ma Y, et al.
The differential expression pattern of the BMI-1, SALL4 and ABCA3 genes
in myeloid leukemia. Cancer Cell Int. 2012;12(1):42.
32. Chen S, Liu S, Xu L, Yang L, Jin Z, Ma Y, Li B, Wu X, Yang J, Ma Y, et al. The
characteristic expression pattern of BMI-1 and SALL4 genes in placenta tissue
and cord blood. Stem Cell Res Ther. 2013;4(2):49.
33. Yeoh AE, Tan D, Li CK, Hori H, Tse E, Pui CH, Asian Oncology S.
Management of adult and paediatric acute lymphoblastic leukaemia in
Asia: resource-stratified guidelines from the Asian Oncology Summit 2013.
Lancet Oncol. 2013;14(12):e508–23.
34. Remes Troche JM, Chavez Barrera JA, Gonzalez Ortiz B, Heller Rouassant S,
Montijo Barrios E, Velasco Lavin Mdel R, Worona Dibner LB, Asociacion
Mexicana de G. Guidelines for diagnosis and treatment of constipation in
Mexico. D) Evaluation and treatment of constipation in pediatric population.
Rev Gastroenterol Mex. 2011;76(2):155–68.
35. Yang GF, He WP, Cai MY, He LR, Luo JH, Deng HX, Guan XY, Zeng MS, Zeng YX,
Xie D. Intensive expression of Bmi-1 is a new independent predictor of poor
outcome in patients with ovarian carcinoma. BMC Cancer. 2010;10:133.
36. Wang Y, Zhe H, Ding Z, Gao P, Zhang N, Li G. Cancer stem cell marker
Bmi-1 expression is associated with basal-like phenotype and poor
survival in breast cancer. World J Surg. 2012;36(5):1189–94.
37. Choi YJ, Choi YL, Cho EY, Shin YK, Sung KW, Hwang YK, Lee SJ, Kong G, Lee JE,
Kim JS, et al. Expression of Bmi-1 protein in tumor tissues is associated
with favorable prognosis in breast cancer patients. Breast Cancer Res
Treat. 2009;113(1):83–93.
38. Long Q, Liu L, Xia Y, Bai Q, Wang J, Xu J, Guo J. High peritumoral Bmi-1
expression is an independent prognosticator of poor prognosis in renal
cell carcinoma. Tumour Biol. 2015;36(10):8007–14.
39. Yu D, Liu Y, Yang J, Jin C, Zhao X, Cheng J, Liu X, Qi X. Clinical implications
of BMI-1 in cancer stem cells of laryngeal carcinoma. Cell Biochem Biophys.
2015;71(1):261–9.
40. Tong YQ, Liu B, Zheng HY, He YJ, Gu J, Li F, Li Y. Overexpression of BMI-1 is
associated with poor prognosis in cervical cancer. Asia Pac J Clin Oncol.
2012;8(4):e55–62.
41. Choy B, Bandla S, Xia Y, Tan D, Pennathur A, Luketich JD, Godfrey TE,
Peters JH, Sun J, Zhou Z. Clinicopathologic characteristics of high expression
of Bmi-1 in esophageal adenocarcinoma and squamous cell carcinoma.
BMC Gastroenterol. 2012;12:146.
42. Chowdhury M, Mihara K, Yasunaga S, Ohtaki M, Takihara Y, Kimura A.
Expression of Polycomb-group (PcG) protein BMI-1 predicts prognosis in
patients with acute myeloid leukemia. Leukemia. 2007;21(5):1116–22.
43. Kajiume T, Ishikawa N, Ohno N, Sera Y, Karakawa S, Kobayashi M. Expression of
the polycomb group gene Bmi-1 does not affect the prognosis of pediatric
acute lymphoblastic leukemia. Stem Cell Discovery. 2012;02(02):25–30.
44. Park IK, Morrison SJ, Clarke MF. Bmi1, stem cells, and senescence regulation.
J Clin Invest. 2004;113(2):175–9.
45. Bracken AP, Kleine-Kohlbrecher D, Dietrich N, Pasini D, Gargiulo G, Beekman C,
Theilgaard-Monch K, Minucci S, Porse BT, Marine JC, et al. The Polycomb
group proteins bind throughout the INK4A-ARF locus and are disassociated
in senescent cells. Genes Dev. 2007;21(5):525–30.
Page 8 of 8
46. Amsterdam A, Tajima K, Sasson R. Cell-specific regulation of apoptosis by
glucocorticoids: implication to their anti-inflammatory action. Biochem
Pharmacol. 2002;64(5–6):843–50.
47. Bose R, Moors M, Tofighi R, Cascante A, Hermanson O, Ceccatelli S.
Glucocorticoids induce long-lasting effects in neural stem cells resulting
in senescence-related alterations. Cell Death Dis. 2010;1:e92.
48. Wang F, Guo Y, Chen Q, Yang Z, Ning N, Zhang Y, Xu Y, Xu X, Tong C,
Chai L, et al. Stem cell factor SALL4, a potential prognostic marker for
myelodysplastic syndromes. J Hematol Oncol. 2013;6(1):73.
49. Ma JC, Qian J, Lin J, Qian W, Yang J, Wang CZ, Chai HY, Li Y, Chen Q, Qian Z.
Aberrant hypomethylation of SALL4 gene is associated with intermediate and
poor karyotypes in acute myeloid leukemia. Clin Biochem. 2013;46(4–5):304–7.
50. Ma Y, Cui W, Yang J, Qu J, Di C, Amin HM, Lai R, Ritz J, Krause DS, Chai L.
SALL4, a novel oncogene, is constitutively expressed in human acute
myeloid leukemia (AML) and induces AML in transgenic mice. Blood.
2006;108(8):2726–35.
51. Lu J, Ma Y, Kong N, Alipio Z, Gao C, Krause DS, Silberstein LE, Chai L. Dissecting
the role of SALL4, a newly identified stem cell factor, in chronic myelogenous
leukemia. Leukemia. 2011;25(7):1211–3.
52. Ueno S, Lu J, He J, Li A, Zhang X, Ritz J, Silberstein LE, Chai L. Aberrant
expression of SALL4 in acute B cell lymphoblastic leukemia: mechanism,
function, and implication for a potential novel therapeutic target. Exp
Hematol. 2014;42(4):307–16. e308.
53. Cui W, Kong NR, Ma Y, Amin HM, Lai R, Chai L. Differential expression of
the novel oncogene, SALL4, in lymphoma, plasma cell myeloma, and
acute lymphoblastic leukemia. Mod Pathol. 2006;19(12):1585–92.
Submit your next manuscript to BioMed Central
and we will help you at every step:
• We accept pre-submission inquiries
• Our selector tool helps you to find the most relevant journal
• We provide round the clock customer support
• Convenient online submission
• Thorough peer review
• Inclusion in PubMed and all major indexing services
• Maximum visibility for your research
Submit your manuscript at
www.biomedcentral.com/submit