Mammographic breast density and risk of breast cancer in women with atypical hyperplasia: An observational cohort study from the Mayo Clinic Benign Breast Disease (BBD) cohort
Bạn đang xem bản rút gọn của tài liệu. Xem và tải ngay bản đầy đủ của tài liệu tại đây (526.96 KB, 10 trang )
Vierkant et al. BMC Cancer (2017) 17:84
DOI 10.1186/s12885-017-3082-2
RESEARCH ARTICLE
Open Access
Mammographic breast density and risk of
breast cancer in women with atypical
hyperplasia: an observational cohort study
from the Mayo Clinic Benign Breast Disease
(BBD) cohort
Robert A. Vierkant1, Amy C. Degnim2, Derek C. Radisky3, Daniel W. Visscher4, Ethan P. Heinzen1, Ryan D. Frank5,
Stacey J. Winham1, Marlene H. Frost6, Christopher G. Scott1, Matthew R. Jensen1, Karthik Ghosh7,
Armando Manduca8, Kathleen R. Brandt9, Dana H. Whaley9, Lynn C. Hartmann10 and Celine M. Vachon11*
Abstract
Background: Atypical hyperplasia (AH) and mammographic breast density (MBD) are established risk factors for
breast cancer (BC), but their joint contributions are not well understood. We examine associations of MBD and BC by
histologic impression, including AH, in a subcohort of women from the Mayo Clinic Benign Breast Disease Cohort.
Methods: Women with a diagnosis of BBD and mammogram between 1985 and 2001 were eligible. Histologic
impression was assessed via pathology review and coded as non-proliferative disease (NP), proliferative disease without
atypia (PDWA) and AH. MBD was assessed clinically using parenchymal pattern (PP) or BI-RADS criteria and categorized
as low, moderate or high. Percent density (PD) was also available for a subset of women. BC and clinical information
were obtained by questionnaires, medical records and the Mayo Clinic Tumor Registry. Women were followed from
date of benign biopsy to BC, death or last contact. Standardized incidence ratios (SIRs) compared the observed
number of BCs to expected counts. Cox regression estimated multivariate-adjusted MBD hazard ratios.
Results: Of the 6271 women included in the study, 1132 (18.0%) had low MBD, 2921 (46.6%) had moderate MBD, and
2218 (35.4%) had high MBD. A total of 3532 women (56.3%) had NP, 2269 (36.2%) had PDWA and 470 (7.5%) had AH.
Over a median follow-up of 14.3 years, 528 BCs were observed. The association of MBD and BC risk differed by histologic
impression (p-interaction = 0.03), such that there was a strong MBD and BC association among NP (p < 0.001) but
non-significant associations for PDWA (p = 0.27) and AH (p = 0.96). MBD and BC associations for AH women were not
significant within subsets defined by type of MBD measure (PP vs. BI-RADS), age at biopsy, number of foci of AH, type
of AH (lobular vs. ductal) and body mass index, and after adjustment for potential confounding variables. Women with
atypia who also had high PD (>50%) demonstrated marginal evidence of increased BC risk (SIR 4.98), but results were
not statistically significant.
Conclusion: We found no evidence of an association between MBD and subsequent BC risk in women with AH.
Keywords: Mammographic breast density, Breast cancer risk, Atypical hyperplasia
* Correspondence:
11
Department of Health Sciences Research, Division of Epidemiology, Mayo
Clinic, 200 First Street SW, Rochester, MN 55905, USA
Full list of author information is available at the end of the article
© The Author(s). 2017 Open Access This article is distributed under the terms of the Creative Commons Attribution 4.0
International License ( which permits unrestricted use, distribution, and
reproduction in any medium, provided you give appropriate credit to the original author(s) and the source, provide a link to
the Creative Commons license, and indicate if changes were made. The Creative Commons Public Domain Dedication waiver
( applies to the data made available in this article, unless otherwise stated.
Vierkant et al. BMC Cancer (2017) 17:84
Background
Breast biopsies are commonly performed to investigate BC in women with suspicious mammographic or
palpable findings, and the majority of them reveal
only benign breast lesions. In fact, of the estimated
1.6 million breast biopsies performed in the United
States each year [1], approximately 80% are found to
be benign [2]. The histologic features of these benign
breast disease (BBD) findings are quite varied and can
be used to stratify women into groups with significantly different risks of developing a later BC [3, 4].
Atypical hyperplasia (AH) is a high-risk benign lesion
found in approximately 10% of benign biopsies [5]
and is composed of two histologic subtypes: atypical
ductal hyperplasia (ADH) and atypical lobular hyperplasia (ALH). We and others have previously reported
that women with AH are at an approximately fourfold risk of subsequent BC [3, 4, 6, 7], and have an
approximate 30% cumulative risk at 25 years post biopsy [8]. This long-term risk is similar for women
with ADH and those with ALH [6, 8].
In a recent review article we suggested that clinicians
consider the use of screening MRIs and pharmacologic
agents such as aromatase inhibitors (AIs) and selective
estrogen receptor modulators (SERMs) as potential preventive options for women with AH [9]. However, we
also recognize that many women diagnosed with AH will
never progress to BC. Clinical prevention measures can
be costly, and pharmacological agents can induce adverse side effects. Thus, it is important to identify risk
factors among women with AH that further stratify BC
risk in order to target screening and prevention efforts
to those with the highest risk.
Mammographic breast density (MBD), which represents
the proportion of tissues that appear white or dense on a
mammogram, is a well-established risk factor for breast
cancer [10–12]. Women with high MBD have a 3–5 fold
increased risk of BC relative to those with low density
[13, 14]. It has also been shown that AH is associated
with increased MBD [15]. However, to date there
have been very few studies examining the association
of MBD with BC risk in women with AH, with inconsistent findings. Byrne et al. found no association
between percent density and risk in women with AH
[16]. Conversely, two other studies have reported increased risk in women with AH who have high MBD
[17, 18], although small sample sizes limit the significance of the associations. We previously reported no
association between MBD [measured by Wolfe’s parenchymal pattern (PP)] and BC risk in a group of 147
women with AH [19]. Here, we present results in an
expanded cohort of 470 women diagnosed with AH
between 1985 and 2001 to examine if MBD can further stratify BC risk in women with AH.
Page 2 of 10
Methods
Study setting and population
The Mayo Clinic Benign Breast Disease study has been described previously [3] and currently comprises 13,527
women ages 18 to 85 who underwent a benign breast biopsy between 1967 and 2001 at Mayo Clinic in Rochester,
MN. Detailed demographic and clinical features and risk
factors were identified from medical records and questionnaires [3]. BC events were ascertained from study questionnaires, tumor registry, and review of medical records. The
study protocol, including patient contact and follow-up
methods, was approved by the Mayo Clinic Institutional
Review Board. We excluded all women who refused to
allow use of their medical record for research. All women
in the BBD cohort with a biopsy between 1985 and 2001
and for whom MBD was available from clinical
records,were included in this particular study.
Histologic examination
The study breast pathologist (DWV) performed histologic review of archived hematoxylin-and-eosin (H&E)
slides from the benign biopsies. Histology was classified
according to the criteria of Page et al. [4, 7] into the following categories: nonproliferative disease (NP), proliferative disease without atypia (PDWA), and AH. The
degree of lobular involution (LI) for each individual was
categorized as described previously [20].
Assessment of mammographic breast density
MBD was available from medical records starting in 1985.
From 1985 to June 1996, MBD was measured at Mayo
Clinic using Wolfe’s four-category parenchymal pattern (PP)
criteria [21]: N1—non-dense, no ducts visible; P1—ductal
prominence occupying less than a fourth of the breast;
P2—prominent ductal pattern occupying more than a fourth
of the breast; and DY—homogenous, plaque-like areas of
extreme density [21]. From July 1996 to 2001 MBD was
measured using the four density categories of the American
College of Radiology Breast Imaging Reporting and Data
System (BI-RADS) [22]: almost entirely fat (low density);
scattered fibroglandular densities (average density); heterogeneously dense (high density); extremely dense (very high
density). For the primary analyses, the density measures
above were categorized as low, moderate or high MBD by
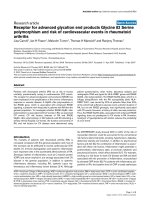
combining the middle two categories for each (Fig. 1).
Retrieval of mammogram films was attempted on all
women with AH over this period. Clinical practice generally saved mammogram films for a ten year period. All
available mammographic films were digitized using an
Array 2905 laser digitizer (Array Corporation,
Netherlands) that has 50 micrometer (limiting) pixel
spacing with 12-bit gray scale bit depth. A single expert
reader, blinded to BC status, calculated mammographic
percent density using the craniocaudal view of the
Vierkant et al. BMC Cancer (2017) 17:84
Page 3 of 10
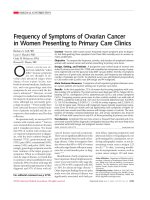
Fig. 1 Pattern of mammographic density and corresponding sample sizes. Categories of mammographic density based on parenchymal pattern (PP)
and BI-RADS density. Panels from left to right display representative examples of low MBD (PP category N1 [N = 60] and BI-RADS category “fatty” [N = 9];
moderate MBD (PP categories P1 [N = 32] or P2 [N = 59], and BI-RADS categories “scattered” [N = 55]or “heterogeneously dense” [N = 85]); and high MBD
(PP category DY [N = 131] and BI-RADS category “extremely dense” [N = 39])
noncancerous breast of women who progressed to breast
cancer and the left breast of unaffected women. Percent
mammographic density, defined as dense area divided by
total area x 100%, was calculated using Cumulus, a
computer-assisted thresholding program [23]. Five percent of images were repeated to assess reliability, with a
resulting intraclass correlation exceeding 0.93. For the
purposes of this study, percent density was classified into
four categories: 0-10%, 11-25%, 26-50%, > 50%.
Statistical methods
Data were summarized using frequencies and percents
for categorical variables, and medians and ranges for
continuous variables. Associations of MBD with demographic and clinical variables were first assessed using
chi-square tests of significance. All variables that were
univariately statistically significant were then included in
a multivariate logistic regression model to assess the independent effects of these characteristics.
To reduce the possibility of including women with
subclinical BC at benign biopsy, women did not contribute person years of observation until six months postbiopsy. Duration of follow-up was calculated as the
number of days from that date to the date of BC diagnosis, death, or last contact. In addition, women with
prophylactic mastectomies or a diagnosis of lobular carcinoma in situ (LCIS) were censored at the date of such
occurrence. We estimated relative risks (RR) using standardized incidence ratios (SIRs) and corresponding 95%
confidence intervals (CI), dividing the observed numbers
of incident BCs by the population-based expected
counts. We calculated expected counts by apportioning
each woman’s follow-up into 5-year age groups and multiple calendar periods, thereby accounting for differences
associated with these variables. We used the Iowa
Surveillance, Epidemiology, and End Results (SEER)
registry as the reference population because of its demographic similarities to the Mayo population (80% of cohort members reside in the Upper Midwest). SIRs were
calculated both overall and within subgroups defined by
histologic, clinical and demographic characteristics. We
assessed potential heterogeneity in SIRs across subgroups using Poisson regression analysis, with the log
transformed expected event rate for each individual
modeled as the offset term.
Cox proportional hazards regression analysis was used
to estimate intra-cohort MBD hazard ratios after
adjustment for demographic and clinical variables.
Statistical tests were two-sided, and analyses were conducted with use of SAS statistical software version 9.4
(SAS Institute Inc., Cary NC). A p-value < 0.05 was
treated as significant.
Results
Of the 7999 women in the BBD cohort diagnosed between 1985 and 2001, 6271 (78.4%) had MBD data
within one year prior to biopsy (3532 with NP, 2269 with
PDWA and 470 with AH). A summary of the number of
women by levels of histologic impression, MBD, BMI
and breast cancer status can be found in Additional file
1. Older women were more likely to have MBD values
than younger women. MBD data availability did not differ significantly across year of biopsy, number of atypical
foci, type of atypia (ADH vs. ALH), extent of lobular involution or body mass index, (p-value > 0.05 for each,
data not shown).
We observed an association between histologic category of BBD and MBD, in that women with NP were
more likely to fall into the low MBD category (699/3532,
19.8%) than those with PDWA (364/2269, 16.0%) or AH
Vierkant et al. BMC Cancer (2017) 17:84
Page 4 of 10
(69/470, 14.7%, chi-square p-value < 0.001). After accounting for age at biopsy and BMI, results were even
more striking: women with AH were more than twice as
likely to be in the high MBD category vs. the low category than those with NP (logistic regression odds ratio
2.10, 95% CI 1.51-2.93).
Over a median follow-up of 14.3 years for the 6271
women, 528 BCs were observed (224 in women with NP,
222 in women with PDWA and 82 in women with AH).
We observed a strong positive dose–response association
between MBD and BC risk in women with NP (test for heterogeneity in SIRs p < 0.001), and a modest but nonsignificant association in women with PDWA (p = 0.27,
Table 1). In contrast, risk of breast cancer did not appreciably differ across density categories for women with AH
(SIR for low density 3.40, for moderate density 3.48, and for
high density 3.25, test for heterogeneity p-value = 0.96,
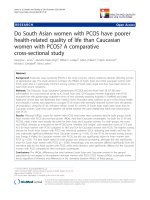
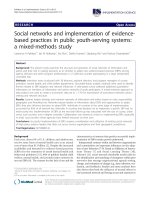
Table 2). BC cumulative incidence curves also overlapped
considerably across the three levels of extent of MBD for
these women (Fig. 2). Tests for interaction between histologic impression (modeled as a categorical variable) and
MBD (modeled as an ordinal variable) revealed that histologic impression significantly modified the association between MBD and breast cancer risk (p = 0.03). Because the
null finding in AH differed from what we had seen in the
other two histologies, we examined the subset of women
with AH more closely. Of the 470 eligible women with AH,
69 (15%) had low, 231 (49%) had moderate, and 170 (36%)
had high extent of MBD, respectively. Associations of MBD
with demographic and clinical characteristics in women
with AH are provided in Table 2. Univariate results showed
several associations with MBD. After multivariate adjustment, age at biopsy (p = 0.001), type of MBD measurement
(p < 0.001), degree of lobular involution (p = 0.03), and BMI
(p < 0.001) remained statistically significant. Compared to
women with high MBD values, those with low values
tended to be older, to have a higher BMI, and to have more
extensive LI. In addition, women with high or low MBD
were more likely to have had a PP density measurement.
Comparisons of clinical and demographic characteristics
by type of density measure (BIRADS versus PP) in women
with AH revealed very few differences (Additional file 2).
Women with BI-RADS density values were slightly more
likely to have been diagnosed with ADH (either alone or
in combination with ALH) than those with PP values
(60.6% vs. 48.6%). No other attributes differed across
MBD measurement type, supporting our decision to combine the two MBD measurement types.
We also examined associations between MBD and
breast cancer risk within subsets of women with AH. We
found no evidence of heterogeneity in risk by MBD when
examining subsets defined by type of MBD measure (PP
vs. BI-RADS), age at benign biopsy, number of atypical
foci, type of AH, or BMI, although sample sizes in some of
these subsets were small (Table 3).
Due to concerns that both the PP and BI-RADS MBD
measures are subjective, we conducted a series of sensitivity analyses in a group of 212 women (with 32 resulting
BC events) for whom mammographic percent density
(PD) was available. Results are provided in Table 4. Risk of
breast cancer did not appreciably differ across the lower
three PD categories (SIR 2.54 for 0-10%, 3.75 for 11-25%,
and 2.94 for 26-50%). We observed an SIR of 4.98 (95% CI
0.60-17.92) for women with >50% PD, but this category
included only 8 subjects and 2 observed breast cancer
events, resulting in a very imprecise point estimate. As
with the primary analyses, the test for heterogeneity in the
SIRs was non-significant (p = 0.76)
Primary analyses combined the middle two categories
of the PP and BI-RADs MBD measures, but secondarily
we examined associations with BC risk within each of
the four categories. Results were similar for PP P1 (SIR
3.62, CI 1.46-7.45) and P2 (SIR 2.89, CI 1.39-5.32), and
for scattered (SIR 3.49, CI 1.60-6.64) and heterogeneously
dense BI-RADS density categories (SIR 3.95, CI 2.21-6.51,
Additional file 3). Sensitivity analyses retaining the original
four-level density values and testing for trend across these
values also yielded null results (p = 0.83).
Due to concerns that associations of MBD with BC risk
may differ depending on time since initial biopsy, we ran
sensitivity analyses subsetting to the first 10 years of postbiopsy follow-up. Findings were similar to our overall
Table 1 Associations of extent of mammographic breast density with breast cancer risk by levels of benign histologic impression
Low Density
Characteristic
N
Medium Density
p-valuea
High Density
Obs
Exp
SIR (95% CI)
N
Obs
Exp
SIR (95% CI)
N
Obs
Exp
SIR (95% CI)
Histologic Impression
NP
699
30
40.07
0.75 (0.50, 1.07)
1586
99
80.27
1.23 (1.00, 1.50)
1247
95
56.69
1.68 (1.36, 2.05)
<0.001
PDWA
364
31
22.15
1.40 (0.95, 1.99)
1104
113
58.76
1.92 (1.58, 2.31)
801
78
43.50
1.79 (1.42, 2.24)
0.27
AH
69
12
3.53
3.40 (1.76, 5.93)
231
41
11.77
3.48 (2.50, 4.73)
170
29
8.92
3.25 (2.18, 4.67)
0.96
Standardized incidence ratios and corresponding 95% confidence intervals, comparing the observed number of breast cancer events to those expected based on
incidence rates from Iowa SEER data. Analyses account for the effects of age and calendar period
NP non-proliferative disease, PDWA proliferative disease without atypia, AH atypical hyperplasia, N number of individuals, Obs observed number of breast cancer
events, Exp expected number of breast cancer events, SIR standardized incidence ratio, CI confidence interval
a
P-value, test of heterogeneity in SIRs across columns
Vierkant et al. BMC Cancer (2017) 17:84
Page 5 of 10
Table 2 Associations of mammographic breast density with demographic and clinical variables
Characteristic
Low (N = 69, 15%)
Moderate (N = 231, 49%)
High (N = 170, 36%)
Total (N = 470)
32 (18.8%)
54 (11.5%)
Age at Benign Biopsy
< 45
7 (10.1%)
15 (6.5%)
45-55
9 (13.0%)
76 (32.9%)
67 (39.4%)
152 (32.3%)
55+
53 (76.8%)
140 (60.6%)
71 (41.8%)
264 (56.2%)
Type of Density Measure
BI-RADS
9 (13.0%)
140 (60.6%)
39 (22.9%)
188 (40.0%)
PPAT
60 (87.0%)
91 (39.4%)
131 (77.1%)
282 (60.0%)
Number of Atypical Foci
p-valuea
Multivariate p-valueb
<0.001
0.001
<0.001
<0.001
0.31
1
47 (68.1%)
126 (54.5%)
96 (56.5%)
269 (57.2%)
2
15 (21.7%)
61 (26.4%)
42 (24.7%)
118 (25.1%)
3+
7 (10.1%)
44 (19.0%)
32 (18.8%)
83 (17.7%)
Type of Atypia
ADH
41 (59.4%)
116 (50.2%)
65 (38.2%)
222 (47.2%)
ALH
27 (39.1%)
96 (41.6%)
96 (56.5%)
219 (46.6%)
ADH and ALH
1 (1.4%)
19 (8.2%)
9 (5.3%)
29 (6.2%)
Involution
Missing
2
11
7
20
None
1 (1.5%)
19 (8.6%)
26 (16.0%)
46 (10.2%)
Partial
41 (61.2%)
124 (56.4%)
112 (68.7%)
277 (61.6%)
Complete
25 (37.3%)
77 (35.0%)
25 (15.3%)
127 (28.2%)
Missing
1
2
2
5
BMI
< 25
25 (36.8%)
78 (34.1%)
101 (60.1%)
204 (43.9%)
25-29
19 (27.9%)
70 (30.6%)
35 (20.8%)
124 (26.7%)
30+
24 (35.3%)
81 (35.4%)
32 (19.0%)
137 (29.5%)
0.004
0.11
<0.001
0.03
<0.001
<0.001
Values presented as number (percent)
a
Chi-square tests
b
Multicategorical nominal logistic regression analysis modeling extent of density as the outcome variable. Model includes all variables found to be univariately
significant (p < 0.05)
Fig. 2 Cumulative breast cancer incidence by extent of mammographic
breast density in women with atypical hyperplasia. Curves account for
death as a competing event
results: SIR 4.11 (95% CI 1.97-7.56) for low MBD, 3.27
(2.14-4.80) for moderate MBD, and 3.63 (2.18-5.67) for
high MBD respectively (test for heterogeneity p = 0.82).
Also, because analysis of BC risk using SIRs does not
allow for formal adjustment of certain potential confounding variables, we re-examined MBD risk associations using
intra-cohort Cox proportional hazards regression analyses
(Additional file 4). We again found no evidence of association after adjustment for age at biopsy, BMI, type of
MBD measure (when applicable) and extent of involution (p = 0.69 using the PP/BI-RADS density measure
and p = 0.47 using the PD measure). Further analyses
modeling PD as a one degree-of-freedom linear term, first
using the original PD values (p = 0.57) and then using
square-root-transformed values (p = 0.58) yielded similar
results.
Finally, we limited events to only the 65 invasive breast
cancers, censoring women with DCIS at date of diagnosis. Although SIRs did order in the hypothesized
Vierkant et al. BMC Cancer (2017) 17:84
Page 6 of 10
Table 3 Associations of extent of mammographic breast density with breast cancer risk in women with atypical hyperplasia
Low Density
Medium Density
p-valuea
High Density
Characteristic
N
Obs
Exp
SIR (95% CI)
N
Obs
Exp
SIR (95% CI)
N
Obs
Exp
SIR (95% CI)
Overall
69
12
3.53
3.40 (1.76, 5.93)
231
41
11.77
3.48 (2.50, 4.73)
170
29
8.92
3.25 (2.18, 4.67)
0.96
Type of Density Measure
PPAT
60
11
3.16
3.48 (1.74, 6.23)
91
17
5.39
3.15 (1.84, 5.05)
131
24
7.33
3.28 (2.10, 4.87)
0.97
BIRADS
9
1
0.37
2.73 (0.07, 15.13)
140
24
6.37
3.77 (2.41, 5.60)
39
5
1.59
3.14 (1.02, 7.31)
0.89
Age at Biopsy
< 45
7
2
0.30
6.61 (0.80, 23.79)
15
2
0.32
6.17 (0.75, 22.21)
32
4
1.20
3.33 (0.91, 8.53)
0.66
45-55
9
0
0.39
NA
76
15
3.64
4.12 (2.31, 6.80)
67
14
3.65
3.84 (2.10, 6.44)
0.21
55+
53
10
2.84
3.53 (1.69, 6.49)
140
24
7.80
3.08 (1.97, 4.58)
71
11
4.07
2.70 (1.35, 4.84)
0.83
Number of Atypical Foci
1
47
6
2.73
2.20 (0.81, 4.79)
126
19
6.80
2.79 (1.68, 4.36)
96
16
4.76
3.36 (1.92, 5.46)
0.65
2
15
4
0.52
7.73 (2.11, 19.81)
61
14
2.81
4.98 (2.72, 8.36)
42
6
2.42
2.48 (0.91, 5.40)
0.16
3+
7
2
0.29
6.98 (0.84, 25.13)
44
8
2.15
3.72 (1.61, 7.32)
32
7
1.74
4.03 (1.62, 8.29)
0.76
ADH
41
7
2.18
3.21 (1.29, 6.61)
116
17
5.74
2.96 (1.73, 4.75)
65
15
3.48
4.31 (2.41, 7.11)
0.57
ALH
27
5
1.28
3.92 (1.27, 9.12)
96
20
5.14
3.89 (2.38, 6.01)
96
13
4.92
2.64 (1.40, 4.52)
0.51
ADH and ALH
1
0
0.08
NA
19
4
0.89
4.48 (1.22, 11.48)
9
1
0.51
1.94 (0.05, 10.79)
0.56
Type of Atypia
BMI at Biopsy
< 25
25
2
1.45
1.38 (0.17, 4.97)
78
18
3.96
4.55 (2.69, 7.19)
101
17
5.17
3.29 (1.91, 5.27)
0.16
25-29
19
5
1.01
4.96 (1.61, 11.55)
70
10
3.37
2.97 (1.42, 5.46)
35
4
1.95
2.05 (0.56, 5.25)
0.42
30+
24
5
1.07
4.66 (1.51, 10.86)
81
13
4.39
2.96 (1.57, 5.07)
32
7
1.76
3.97 (1.60, 8.17)
0.65
Standardized incidence ratios and corresponding 95% confidence intervals, comparing the observed number of breast cancer events to those expected based on
incidence rates from Iowa SEER data. Analyses account for the effects of age and calendar period
N number of individuals, Obs observed number of breast cancer events, Exp expected number of breast cancer events, SIR standardized incidence ratio, CI
confidence interval
a
P-value, test of heterogeneity in SIRs across columns
direction (SIRs = 2.62 for low, 3.09 for moderate, and
3.45 for high MBD respectively), relative effect sizes
were small and did not approach statistical significance
(test for heterogeneity p = 0.78). We found no association of MBD with invasive breast cancer using Cox regression analyses (HRs = 1.08 and 1.08 for moderate and
high MBD relative to low MBD, p = 0.98).
Discussion
We found the MBD and breast cancer association differed by histologic impression. In particular, there was a
strong association among women with NP and a suggestive association among PDWA. However, in our cohort of 470 women diagnosed with AH, we found no
convincing evidence of an association between
Table 4 Associations of percent mammographic breast density (PD) with breast cancer risk in a subgroup of women with atypical
hyperplasia
Characteristic
No. Women
Person Years
Observed Events
Expected Events
SIR (95% CI)
Overall
212
2469
32
10.15
3.15 (2.16, 4.45)
0-10%
59
688
8
3.15
2.54 (1.10, 5.00)
11-25%
69
777
12
3.20
3.75 (1.94, 6.55)
26-50%
76
900
10
3.41
2.94 (1.41, 5.40)
51 + %
8
104
2
0.40
4.98 (0.60, 17.92)
Percent Density
p-valuea
0.76
Standardized incidence ratios and corresponding 95% confidence intervals, comparing the observed number of breast cancer events to those expected based on
incidence rates from Iowa SEER data
Analyses account for the effects of age and calendar period
a
P-value, test of heterogeneity in SIRs
Vierkant et al. BMC Cancer (2017) 17:84
mammographic breast density and subsequent risk of
BC. Null associations persisted within most of the AH
subsets and after adjustment for relevant demographic
and clinical variables. The only subgroup suggesting a
difference in BC risk was women with percent density >
50%, but this result was based on just eight subjects and
two breast cancer events. These results are in contrast
to women with non-proliferative disease, for whom high
MBD was strongly associated with increased BC risk.
Our findings are consistent with those from a nested
case–control study using women with biopsies enrolled
in the Breast Cancer Detection Demonstration Project
[16]. In this study of 347 BC cases and 410 age- and
race-matched controls, Byrne et al. examined BC risk
within categories defined by combinations of percent
density assessed by Cumulus and histologic impression.
For women with NP, they observed a strong dose–response association with density: ORs = 1.0 (ref ) for
women with <50% density, 2.5 for PD of 50-74%, and 5.8
for PD ≥75%. This association attenuated for women
with PDWA: ORs = 1.6 for <50%, 2.5 for 50-74%, and 3.2
for ≥75%, relative to women with NP and PD < 50%.
Notably, they observed no apparent association for
women with AH (ORs = 4.1 for <50%, 3.0 for 50-74%,
and 2.1 for ≥75%), although they only had 99 women
with AH (58 cases and 41 controls).
However, our results contrast with two other studies.
Tice et al. examined BC risk with different combinations of
BBD histologic impression and MBD, as measured using
BI-RADS criteria, in more than 42,000 women in the
Breast Cancer Surveillance Consortium (BCSC), including
2179 with AH diagnosed by community pathologists as
part of a patient’s routine medical care [17]. Compared to
women with non-proliferative disease and BI-RADS category 2, those with AH and BI-RADS category 4 were at
the greatest increased risk of BC (N = 267, RR 5.34); those
with AH and intermediate density were at intermediate
risk [BI-RADS 2 (N = 768, RR 2.57) and BI-RADS 3
(N = 1079, RR 3.37)]; and those with AH and BI-RADS
category 1 were at lowest risk (N = 65, RR 0.68), although
confidence intervals overlapped for all AH risk estimates.
The number of women with AH in this study (N = 2179)
is considerably larger than our current study (N = 470), although women in our study were followed for a longer
period of time (median 13.5 years compared to 6.1). When
we limited our study to the first ten years of follow-up, we
found similar null associations compared to our overall results, albeit with lower precision of estimates.
Reimers et al. examined BC risk associations in 815
women at high risk of breast cancer, with available histologic impression and with MBD data measured used the
BI-RADS criteria [18]. Their study is composed of a subset of individuals enrolled in the Women at Risk Registry
who had either a strong family history of breast cancer
Page 7 of 10
or a biopsy-proven history of LCIS or AH [24]. They reported that in the women with AH, those with BI-RADS
values of 3 or 4 were at increased risk of BC (RR 4.40,
95% CI 2.24-8.67) compared to women with AH and BIRADS of 1 or 2 (RR 1.33, 95% CI 0.54-3.26), using
women with no AH and BI-RADS of 1 or 2 as the referent group. However, confidence intervals were wide and
overlapped considerably between the two AH groups.
The number of women in this study with AH was not
reported, which makes it difficult to compare to our
current study focusing only on AH. Furthermore, the
average length of follow-up was 7.9 years and the number of BC events was also not specified.
Thus, of the four studies to date examining associations
between MBD and BC risk in women with AH, two report
suggestive but non-significant results [17, 18], while ours
and Byrne et al. report decidedly null results [16]. Of note,
all four studies observed overall associations between AH
and BC risk, and between high MBD and BC risk, consistent with the established views. Results differed only when
examining MBD and BC risk within the subset of AH individuals. Several possibilities for this discrepancy exist.
First, it is possible that sample size of ours and other studies were insufficient to detect statistically significant associations. To examine this in our study, we ran a series of
post-hoc power analyses based on characteristics of our
cohort of 470 women. Assuming a two-sided test of hypothesis with a Type I error rate of 0.05, the observed proportions of women with low MBD and high MBD in our
study, and the total observed numbers of BC events in our
study, we would have 52% statistical power to detect a
relative risk of 2 in high MBD women compared to low
MBD women, 80% power to detect a relative risk of 2.6,
and greater than 90% power to detect relative risks of 3 or
larger. Thus, we have a sufficient sample size to pick up
large differences in BC risk similar to those found in previous non-AH studies [13, 14], but modest sample size to
pick up small or intermediate differences.
Another possible explanation for the lack of association
is that women with AH and/or high MBD may have been
selectively prescribed chemopreventive SERMs such as
tamoxifen or raloxifene to reduce their risk of BC, which
in turn could have altered any observed associations between MBD and BC risk. Among the 470 women in our
study, at least 20 had documented evidence of being prescribed tamoxifen or raloxifene subsequent to initial biopsy and (for the 3 of 20 who developed BC) at least six
months prior to BC diagnosis. We ran sensitivity analyses
excluding these women and still found no evidence of an
association between MBD and BC risk (SIR = 3.51 for low
MBD, 3.47 for moderate MBC, 3.33 for high MBD, test
for heterogeneity p = 0.98). None of the three other studies
mentioned prevalence of use of chemopreventive agents
in their findings. However, given the fact that clinical
Vierkant et al. BMC Cancer (2017) 17:84
information was collected prior to 1990 for Byrne et al.
and prior to 2006 for Reimers et al., before tamoxifen and
raloxifene were commonly used preventively, it is unlikely
that these agents affected risk associations for those
studies.
A biologically viable explanation is that high MBD
promotes the development of precancerous lesions such
as AH, which in turn are associated with increased BC
risk. Perhaps high MBD provides a permissive microenvironment for epithelial abnormalities to progress to
pre-malignancy, but once a woman progresses to AH
the density in the microenvironment has no further promoting effect. MBD is composed of both epithelial and
stromal components. It is possible that the BC risk associated with AH reflects the risk related to the epithelial
component of MBD. It is also believed that stromal
growth factors may influence the epithelium, resulting in
abnormalities such as AH which in turn influences subsequent BC risk [25]. If this was the case, one would expect to see a strong positive association between MBD
and presence of AH. This indeed has been reported by
several studies, including the current one. Boyd and colleagues found that women with high MBD had a 9.7-fold
increased risk of developing AH and/or DCIS compared
to those with low MBD [15]. Cuzick et al. found that
women with a personal history of AH were 20 times
more likely to have high PD (defined as ≥50%) than
those with no previous breast biopsy, and 12 times more
likely to have high PD than those with non-proliferative
disease [26]. Our finding that women with AH were
more than twice as likely to have high MBD as those
with NP corroborates these results.
Although the vast majority of our results were null, we
did observe a possible increased risk in BC for women
with AH and PD > 50% (SIR 4.98, 95% CI 0.60-17.92).
However, this result did not approach statistical significance due to the small number of women with this
phenotype and so needs to be verified in an external
cohort.
An interesting finding from this study was that women
with PP MBD measures were more likely to fall into the
high and low MBD categories than those with BI-RADS
measures, who tended to cluster in the moderate category. This may indicate that PP is better at stratifying
levels of MBD than BI-RADS. The PP does attempt to
assess density amount/proportion and patterns (i.e.
nodular vs. diffuse), while the BI-RADS density historically emphasized proportions. Regardless, associations of
MBD with BC risk were similar in the PP and BI-RADS
subsets of women.
Our study has several notable strengths. AH for each
study participant was confirmed by a single breast pathologist with broad breast research experience. This is an
important consideration given the known misclassification
Page 8 of 10
issues for these lesions [27]. Detailed information on clinical and demographic attributes, and post-biopsy follow-up
for cancer events, was ascertained based on questionnaires
and review of Mayo Clinic’s unified medical record and
tumor registry database. It should be noted that study participants were primarily Caucasian, and all were seen at the
same institution in the Upper Midwest, so geographic and
racial/ethnic makeup of the cohort is somewhat homogeneous. The PP and BI-RADS MBD measures used in our
primary analyses are subjective but clinically relevant and
have been consistently associated with BC risk [12, 28–38]
including in our own populations [39–41]. We examined
multiple measures of breast density, including PP, BIRADS and PD. Moreover, Byrne et al. [16] found similar
results to ours using PD measures. Finally, some of the
subset analyses resulted in small cell sizes, making it difficult to state unequivocally that there is no association
across all subgroups.
Conclusion
In summary, we evaluated the impact of mammographic
density on breast cancer risk in women with AH, based
within a cohort of women with benign breast disease.
Women with AH were more likely to have higher mammographic density than women without AH. Although
mammographic density was associated with higher risk in
women without AH, it did not stratify risk in women with
AH. Therefore, our results suggest that MBD measures
may not play as important a role when making management decisions for women with AH than for women with
other forms of benign breast disease
Additional files
Additional file 1: Summary statistics of eligible women. (DOCX 18 kb)
Additional file 2: Associations of MBD measurement type with
demographic and clinical variables in women with atypical hyperplasia.
(DOCX 18 kb)
Additional file 3: Associations of parenchymal pattern (PP) and BI-RADS
MBD measures with breast cancer risk in women with atypical hyperplasia,
using the original four-level categorization. (DOCX 16 kb)
Additional file 4: Associations of extent of mammographic breast
density with breast cancer risk in women with atypical hyperplasia using
Cox proportional hazards regression analysis. (DOCX 17 kb)
Abbreviations
ADH: Atypical ductal hyperplasia; AH: Atypical hyperplasia; AI: Aromatase
inhibitors; ALH: Atypical lobular hyperplasia; BBD: Benign breast disease;
BC: Breast cancer; BI-RADS: Breast imaging reporting and data system;
CI: Confidence intervals; DCIS: Ductal carcinoma; LCIS: Lobular carcinoma in
situ; LI: Lobular involution; MBD: Mammographic breast density;
NP: Nonproliferative disease; PD: Percent data; PDWA: Proliferative disease
without atypia; PP: Parenchymal pattern; SEER: Surveillance epidemiology
and end results; SERMs: Selective estrogen receptor modulator;
SIRs: Standardized incidence ratios
Vierkant et al. BMC Cancer (2017) 17:84
Acknowledgements
We would like to thank Teresa Allers, Joanne Johnson, RN, and Linda Murphy
for critical assistance with data abstraction and coordinating review of biopsy
tissues. Sincere thanks to Marilyn Churchward for assistance with manuscript
preparation.
Funding
Mayo Clinic: P50 CA116201 [Breast SPORE], KG 110542–2 [Komen], R01 CA187112
[NCI] R21 CA186734 [NCI]. The funding sources played no role in the design of
the study, collection, analysis, or interpretation of the data or in writing the
manuscript.
Availability of data and materials
Individuals interested in obtaining access to the de-identified data used in
the manuscript may contact the corresponding author.
Authors’ contributions
RAV, ACD, DCR, DWV, EPH, RDF, SJW, MHF, CMV: made substantial contributions
to conception and design, or acquisition of data, or analysis and interpretation
of data; RAV, ACD, DCR, DWV, EPH, RDF, SJW, MHF, CGS, MRJ, KG, AM, KRB,
DHW, LCH, CMV: been involved in drafting the manuscript or revising it critically
for important intellectual content; RAV, ACD, DCR, DWV, EPH, RDF, SJW, MHF,
CGS, MRJ, KG, AM, KRB, DHW, LCH, CMV: given final approval of the version to
be published. Each author should have participated sufficiently in the work to
take public responsibility for appropriate portions of the content; and; RAV,
ACD, DCR, DWV, EPH, RDF, SJW, MHF, CGS, MRJ, KG, AM, KRB, DHW, LCH, CMV:
agreed to be accountable for all aspects of the work in ensuring that questions
related to the accuracy or integrity of any part of the work are appropriately
investigated and resolved.
Page 9 of 10
4.
5.
6.
7.
8.
9.
10.
11.
12.
13.
14.
Authors’ information
Not applicable.
15.
Competing interests
The authors declare that they have no competing interests.
16.
Consent for publication
Not applicable.
17.
Ethics approval and consent to participate
The study protocol, including patient contact and follow-up methods, was
approved by the Mayo Clinic Institutional Review Board. We excluded all
women who refused to allow use of their medical record for research.
Author details
1
Department of Health Sciences Research, Division of Biomedical Statistics
and Informatics, Mayo Clinic, Rochester, MN, USA. 2Department of
Subspecialty General Surgery, Mayo Clinic, Rochester, MN, USA. 3Department
of Cancer Biology, Mayo Clinic, Jacksonville, FL, USA. 4Department of
Anatomic Pathology, Mayo Clinic, Rochester, MN, USA. 5Department of
Health Sciences Research, Biomedical Statistics and Informatics, Mayo Clinic,
Jacksonville, FL, USA. 6Department of Medical Oncology, Division of the
Women’s Cancer Program, Mayo Clinic, Rochester, MN, USA. 7Department of
General Internal Medicine, Division of the Breast Diagnostic Clinic, Mayo
Clinic, Rochester, MN, USA. 8Department of Physiology and Biomedical
Engineering, Mayo Clinic, Rochester, MN, USA. 9Department of Radiology,
Mayo Clinic, Rochester, MN, USA. 10Department of Medical Oncology, Mayo
Clinic, Rochester, MN, USA. 11Department of Health Sciences Research,
Division of Epidemiology, Mayo Clinic, 200 First Street SW, Rochester, MN
55905, USA.
18.
19.
20.
21.
22.
23.
24.
25.
26.
Received: 8 July 2016 Accepted: 23 January 2017
27.
References
1. Silverstein M. Where’s the outrage? J Am Coll Surg. 2009;208(1):78–9.
2. Shaw CR, Wilson SA, O'Brien ME. Information needs prior to breast biopsy.
Clin Nurs Res. 1994;3(2):119–31.
3. Hartmann LC, Sellers TA, Frost MH, Lingle WL, Degnim AC, Ghosh K, et al.
Benign breast disease and the risk of breast cancer. N Engl J Med. 2005;
353(3):229–37.
28.
29.
Dupont WD, Page DL. Risk factors for breast cancer in women with
proliferative breast disease. N Engl J Med. 1985;312(3):146–51.
Simpson JF. Update on atypical epithelial hyperplasia and ductal carcinoma
in situ. Pathology (Phila). 2009;41(1):36–9.
Degnim AC, Visscher DW, Berman HK, Frost MH, Sellers TA, Vierkant RA, et al.
Stratification of breast cancer risk in women with atypia: a Mayo cohort study.
J Clin Oncol. 2007;25(19):2671–7.
Page DL, Dupont WD, Rogers LW, Rados MS. Atypical hyperplastic lesions of
the female breast. A long-term follow-up study. Cancer. 1985;55(11):2698–708.
Hartmann LC, Radisky DC, Frost MH, Santen RJ, Vierkant RA, Benetti LL, et al.
Understanding the premalignant potential of atypical hyperplasia through
its natural history: a longitudinal cohort study. Cancer Prev Res (Phila). 2014;
7(2):211–7.
Hartmann LC, Degnim AC, Santen RJ, Dupont WD, Ghosh K. Atypical hyperplasia
of the breast–risk assessment and management options. N Engl J Med. 2015;
372(1):78–89.
Boyd NF, Guo H, Martin LJ, Sun L, Stone J, Fishell E, et al. Mammographic
density and the risk and detection of breast cancer. N Engl J Med. 2007;
356(3):227–36.
Vachon CM, van Gils CH, Sellers TA, Ghosh K, Pruthi S, Brandt KR, et al.
Mammographic density, breast cancer risk and risk prediction. Breast Cancer
Res. 2007;9(6):217.
McCormack VA, dos Santos SI. Breast density and parenchymal patterns as
markers of breast cancer risk: a meta-analysis. Cancer Epidemiol Biomarkers
Prev. 2006;15(6):1159–69.
Kerlikowske K, Cook AJ, Buist DS, Cummings SR, Vachon C, Vacek P, et al.
Breast cancer risk by breast density, menopause, and postmenopausal
hormone therapy use. J Clin Oncol. 2010;28(24):3830–7.
Cummings SR, Tice JA, Bauer S, Browner WS, Cuzick J, Ziv E, et al. Prevention of
breast cancer in postmenopausal women: approaches to estimating and
reducing risk. J Natl Cancer Inst. 2009;101(6):384–98.
Boyd NF, Jensen HM, Cooke G, Han HL. Relationship between
mammographic and histological risk factors for breast cancer. J Natl Cancer
Inst. 1992;84(15):1170–9.
Byrne C, Schairer C, Brinton LA, Wolfe J, Parekh N, Salane M, et al. Effects of
mammographic density and benign breast disease on breast cancer risk
(United States). Cancer Causes Control. 2001;12(2):103–10.
Tice JA, O'Meara ES, Weaver DL, Vachon C, Ballard-Barbash R, Kerlikowske K.
Benign breast disease, mammographic breast density, and the risk of breast
cancer. J Natl Cancer Inst. 2013;105(14):1043–9.
Reimers LL, Crew KD, Terry MB. Atypical hyperplasia of the breast. N Engl J
Med. 2015;372(13):1270–1.
Hartmann LC, Degnim AC, Dupont WD. Atypical hyperplasia of the breast. N
Engl J Med. 2015;372(13):1271–2.
Milanese TR, Hartmann LC, Sellers TA, Frost MH, Vierkant RA, Maloney SD, et
al. Age-related lobular involution and reduced risk of breast cancer. J Natl
Cancer Inst. 2006;98(22):1600–7.
Wolfe JN. Breast patterns as an index for developing breast cancer. Am J
Roentgenol. 1976;126:1130–7.
American College of Radiology. Illustrated Breast Imaging Reporting and Data
System (BI-RADS). 3rd ed. Reston: American College of Radiology; 1998.
Byng JW, Boyd NF, Fishell E, Jong RA, Yaffe MJ. The quantitative analysis of
mammographic densities. Phys Med Biol. 1994;39(10):1629–38.
Chun J, El-Tamer M, Joseph KA, Ditkoff BA, Schnabel F. Predictors of breast
cancer development in a high-risk population. Am J Surg. 2006;192(4):474–7.
DeFilippis RA, Chang H, Dumont N, Rabban JT, Chen YY, Fontenay GV, et al.
CD36 repression activates a multicellular stromal program shared by high
mammographic density and tumor tissues. Cancer Discov. 2012;2(9):826–39.
Cuzick J, Warwick J, Pinney E, Warren RM, Duffy SW. Tamoxifen and breast
density in women at increased risk of breast cancer. J Natl Cancer Inst.
2004;96(8):621–8.
Elmore JG, Longton GM, Carney PA, Geller BM, Onega T, Tosteson AN, et al.
Diagnostic concordance among pathologists interpreting breast biopsy
specimens. JAMA. 2015;313(11):1122–32.
Moskowitz M, Pemmaraju S, Russell P, Gardella L, Gartside P, DeGroot I.
Observations on the natural history of carcinoma of the breast, its
precursors, and mammographic counterparts. Part 2: mammographic
patterns. Breast Dis Breast. 1977;3:37–41.
Wilkinson E, Clopton C, Gordonson J, Green R, Hill A, Pike MC. Mammographic
parenchymal pattern and the risk of breast cancer. J Natl Cancer Inst. 1977;
59(5):1397–400.
Vierkant et al. BMC Cancer (2017) 17:84
Page 10 of 10
30. Boyd NF, O'Sullivan B, Campbell JE, Fishell E, Simor I, Cooke G, et al.
Mammographic signs as risk factors for breast cancer. Br J Cancer. 1982;
45(2):185–93.
31. Brisson J, Merletti F, Sadowsky NL, Twaddle JA, Morrison AS, Cole P.
Mammographic features of the breast and breast cancer risk. Am J
Epidemiol. 1982;115(3):428–37.
32. Brisson J, Morrison AS, Kopans DB, Sadowsky NL, Kalisher L, Twaddle JA,
et al. Height and weight, mammographic features of breast tissue, and
breast cancer risk. Am J Epidemiol. 1984;119(3):371–81.
33. Carlile T, Kopecky KJ, Thompson DJ, Whitehead JR, Gilbert Jr FI, Present AJ,
et al. Breast cancer prediction and the Wolfe classification of mammograms.
JAMA. 1985;254(8):1050–3.
34. Wolfe JN, Saftlas AF, Salane M. Mammographic parenchymal patterns and
quantitative evaluation of mammographic densities: a case–control study.
AJR Am J Roentgenol. 1987;148(6):1087–92.
35. Brisson J, Verreault R, Morrison AS, Tennina S, Meyer F. Diet,
mammographic features of breast tissue, and breast cancer risk. Am J
Epidemiol. 1989;130(1):14–24.
36. Saftlas AF, Wolfe JN, Hoover RN, Brinton LA, Schairer C, Salane M, et al.
Mammographic parenchymal patterns as indicators of breast cancer risk.
Am J Epidemiol. 1989;129(3):518–26.
37. Brisson J. Family history of breast cancer, mammographic features of breast
tissue, and breast cancer risk. Epidemiology. 1991;2(6):440–4.
38. Byrne C, Schairer C, Wolfe J, Parekh N, Salane M, Brinton LA, et al. Mammographic
features and breast cancer risk: effects with time, age, and menopause status. J
Natl Cancer Inst. 1995;87(21):1622–9.
39. Ghosh K, Vachon CM, Pankratz VS, Vierkant RA, Anderson SS, Brandt KR, et al.
Independent association of lobular involution and mammographic breast
density with breast cancer risk. J Natl Cancer Inst. 2010;102(22):1716–23.
40. Olson JE, Sellers TA, Scott CG, Schueler BA, Brandt KR, Serie DJ, et al. The
influence of mammogram acquisition on the mammographic density and
breast cancer association in the Mayo Mammography Health Study Cohort.
Breast Cancer Res. 2012;14(6):R147.
41. Brandt KR, Scott CG, Ma L, Mahmoudzadeh AP, Jensen MR, Whaley DH,
et al. Comparison of clinical and automated breast density measurements:
implications for risk prediction and supplemental screening. Radiology.
2016;279(3):710–9.
Submit your next manuscript to BioMed Central
and we will help you at every step:
• We accept pre-submission inquiries
• Our selector tool helps you to find the most relevant journal
• We provide round the clock customer support
• Convenient online submission
• Thorough peer review
• Inclusion in PubMed and all major indexing services
• Maximum visibility for your research
Submit your manuscript at
www.biomedcentral.com/submit