Relationships between longitudinal neutrophil to lymphocyte ratios, body weight changes, and overall survival in patients with non-small cell lung cancer
Bạn đang xem bản rút gọn của tài liệu. Xem và tải ngay bản đầy đủ của tài liệu tại đây (621.2 KB, 6 trang )
Derman et al. BMC Cancer (2017) 17:141
DOI 10.1186/s12885-017-3122-y
RESEARCH ARTICLE
Open Access
Relationships between longitudinal
neutrophil to lymphocyte ratios, body
weight changes, and overall survival in
patients with non-small cell lung cancer
B. A. Derman1,3* , J. N. Macklis1,4, M. S. Azeem2,5, S. Sayidine1,6, S. Basu1,4, M. Batus1,4, F. Esmail1,7, J. A. Borgia1,6,
P. Bonomi1,4 and M. J. Fidler1,4
Abstract
Background: There is emerging evidence showing a significant relationship between overall survival (OS) in
non-small cell lung cancer NSCLC patients and weight change during chemotherapy or chemoradiation. A
high neutrophil/lymphocyte ratio (NLR) at baseline and at follow-up is associated with shorter survival in cancer
patients and may be a surrogate for ongoing inflammation, implicated in cancer cachexia and tumor progression.
The objective of this study is to explore potential relationships between OS, serial weights, and serial NLRs in
advanced NSCLC patients receiving chemotherapy.
Methods: One hundred thirty-nine patients with chemotherapy-naïve NSCLC, predominantly with stage III/IV disease,
were treated with first-line platinum doublets from June, 2011 to August, 2012. NLR, tumor response, and body weight
were recorded at baseline, 6, and 12 weeks from initiation of therapy and correlated with OS. The association between
NLR and OS was assessed using Cox PH (proportional hazards) analysis, the association between NLR and weight
change was assessed using a simple regression analysis, and the association between NLR and tumor response was
assessed using the Fisher’s exact test.
Results: One hundred thirty-nine patients with median age 68, PS 0-1/2 = 83/17%, male/female = 58%/42%. Median
NLR at baseline was 3.6 (range 0.1898 to 30.910), at 6 weeks 3.11 (range 0.2703 to 42.11), and at 12 weeks 3.52
(range 0.2147 to 42.93). A Higher NLR at baseline, 6, and 12 weeks was associated with decreased OS (baseline:
HR 1.06, p < 0.001; 6 weeks: HR 1.07, p = 0.001; 12 weeks: HR 1.05, p < 0.001), and longitudinal NLR, as a time-dependent
covariate, was also associated with decreased OS (HR = 1.06, p < 0.001). Baseline weight and NLR were inversely related
(cor = −0.267, p = 0.001), and weight change and NLR were inversely related at 12 weeks (cor = −0.371, p < 0.001).
Longitudinal measurements of weight and NLR were also negatively associated (slope = −0.06, p < 0.001). Using a
cutoff of NLR > 5, there was a significant association between progressive disease and NLR > 5 at 6 weeks (p = 0.02)
and 12 weeks (p = 0.03).
Conclusions: High baseline and progressive increases in NLRs are associated with progressive disease, inferior OS
and weight loss in NSCLC patients. In addition to having prognostic significance, these observations suggest that
studying molecular mediators of cachexia/inflammation and their relationships to tumor progression may identify
new therapeutic targets in the large subset of NSCLC patients who have cancer cachexia.
Keywords: NSCLC, Weight gain, Neutrophil to lymphocyte ratio, Cancer cachexia
* Correspondence:
1
Rush University Medical Center, Chicago, IL, USA
3
Department of Internal Medicine, 1717 W Congress Parkway, 1025 Kellogg,
Chicago, IL 606012, USA
Full list of author information is available at the end of the article
© The Author(s). 2017 Open Access This article is distributed under the terms of the Creative Commons Attribution 4.0
International License ( which permits unrestricted use, distribution, and
reproduction in any medium, provided you give appropriate credit to the original author(s) and the source, provide a link to
the Creative Commons license, and indicate if changes were made. The Creative Commons Public Domain Dedication waiver
( applies to the data made available in this article, unless otherwise stated.
Derman et al. BMC Cancer (2017) 17:141
Background
Cancer cachexia represents a multifactorial spectrum of
disease that has been defined by international consensus
as “an ongoing loss of skeletal muscle mass (with or
without loss of fat mass) that cannot be fully reversed by
conventional nutritional support and leads to progressive
functional impairment” [1]. Prevalence rates of cachexia
differ by malignancy type, with approximately 60% of
NSCLC patients experiencing it [2]. Cancer cachexia
may be a result of both reduced nutritional intake and
increased resting energy expenditure [3]. More recent
evidence suggests that there are several other factors
that contribute to cancer cachexia, which includes increased insulin resistance, hypogonadism, adrenergic activation, and activation of proinflammatory responses
[4]. Identifying and combating this phenomenon has
taken on great importance in light of studies showing
that weight change in advanced NSCLC patients receiving
concurrent chemoradiation or chemotherapy alone is
inversely associated with overall survival (OS) [5–7].
Similarly, loss of muscle mass (regardless of BMI) is also
associated with worse functional status and OS [8].
The NLR is the ratio between the neutrophil and
lymphocyte counts; what constitutes an elevated value
varies between >3.5 and >5. Several studies have already
shown that an increased baseline NLR is associated
with poor clinical outcomes for several types of cancers,
including NSCLC [9–13]. There is relatively little information regarding longitudinal NLRs, which some have
posited may be even more predictive of individual
patient outcomes [14] and may be a dynamic indicator
of tumor status, cachexia, and ongoing inflammation.
Our objective was to investigate potential relationships
between longitudinal NLRs, body weights, and overall
survival.
Methods
One hundred thirty-nine patients with NSCLC who were
treated with first-line platinum doublets from June, 2011
to August, 2012 were reviewed for this study; none of
the patients received prior therapy with an EGFR tyrosine kinase inhibitor. 127 patients had stage III or stage
IV NSCLC, and 12 patients had either stage I or stage II
disease and received adjuvant chemotherapy following
surgical resection. This study was approved by the institutional review board, and compliant with the Helsinki
declaration. NLR and body weight were recorded at
baseline, 6, and 12 weeks from initiation of therapy and
correlated with OS. All patients had blood drawn in outpatient clinic on the day of evaluation and treatment for
advanced NSCLC. None had active infections at the time
of these visits. Neutrophil and lymphocyte counts were
measured on the Sysmex XN-9000 Hematology Analyzer,
Sysmex Corporation, Kobe, Japan. Albumin was measured
Page 2 of 6
on the Architect Clinical Chemistry Analyzer C16000,
Abbott Diagnostics, Santa Clara, California. The association of OS at NLR at baseline, 6 weeks, and 12 weeks
was assessed using the Kaplan-Meier method, the logrank test, and the Cox proportional hazards (PH) analysis. The effect of serial NLR measured longitudinally
on OS was assessed using a time-dependent covariate
Cox PH analysis. The longitudinal association between
weight and NLR was measured serially at baseline, 6 and
12 weeks was assessed using a mixed effects longitudinal
analysis. The association between NLR and tumor response was assessed using a Fisher’s exact test. Tumor
response rates were calculated for the patients with
measurable disease according to the RECIST (Response
Evaluation Criteria in Solid Tumors) 1.1 guidelines. The
ALI index was defined as the BMI*Albumin/NLR, and
ALI was calculated at baseline, 6 and 12 weeks from
initiation of therapy and correlated with OS; 96, 93,
and 84 patients had ALI scores available at baseline, 6
and 12 weeks respectively.
Results
Of 139 patients evaluated, the median age was 68 years,
and 58% were male. 83% had a performance score of 0–
1 and 17% had a performance score of 2 (Table 1).
The median NLR at baseline (Table 2) was 3.6 (range
0.1898 to 30.910), at 6 weeks 3.11 (range 0.2703 to
42.11), and at 12 weeks 3.52 (range 0.2147 to 42.93).
Higher NLR at baseline, 6 and 12 weeks were associated
with decreased OS (baseline: HR 1.06, p < 0.001; 6 weeks:
HR 1.07, p = 0.001; 12 weeks: HR 1.05, p < 0.001). When
the serial measurements of NLR measured longitudinally
at baseline, 6 and 12 weeks are considered as a timedependent covariate, a Cox PH analysis continued to
support its strongly significant association with decreased
OS (HR = 1.06, p < 0.001).
NLR > 3.5 and NLR > 5 have both been used to define
the elevated NLR group [15]. As shown in Fig. 1, there
were strongly significant differences in OS between the
elevated (>3.5) and non-elevated (≤3.5) NLR groups at
baseline (NLR ≤ 3.5 group median OS not reached vs.
NLR >3.5 group median OS 11.6 months, p = 0.003), at
6 weeks (median OS not reached vs 11.4 mos, p = 0.001)
and at 12 weeks (median OS not reached vs 11.6 mos,
p = 0.001). The same held true when using an NLR cutoff of 5. The median OS in the non-elevated (≤5) NLR
group at baseline, 6 weeks, and 12 weeks were not
reached; the median OS in the elevated (>5) NLR group
at baseline was 9.08 months, at 6 weeks was 11 months,
and at 12 weeks was 11 months (p ≤ 0.009).
Baseline weight and baseline NLR were negatively
correlated (cor = −0.267, p = 0.001), and the change in
weight from baseline to 12 weeks and 12 week-NLR
were also inversely related (cor = −0.371, p < 0.001). The
Derman et al. BMC Cancer (2017) 17:141
Page 3 of 6
Table 1 Demographics
Age at Diagnosis (years)
Median
68
Mean
65
Female
58 (42%)
Male
81 (58%)
Caucasian
94 (67.6%)
Gender (n, %)
Ethnicity (n, %)
African American
35 (25.2%)
Hispanic
6 (4.3%)
Asian
3 (2.2%)
Other
1 (0.7%)
Smoking History At Diagnosis (n, %)
Current Smoker
56 (40.3%)
Former Smoker
72 (51.8%)
Never Smoker
11 (7.91%)
Stage at Diagnosis (n, %)
Stage Ia
Stage II
2 (1.4%)
a
10 (7.2%)
Stage III
54 (38.9%)
Stage IV
72 (51.8%)
Other
1 (0.7%)
Adenocarcinoma
92 (66.2%)
Histopathology (n, %)
Squamous Cell
42 (30.2%)
Large Cell
2 (1.4%)
Other
3 (2.2%)
Performance Status (n, %)
0
44 (31.6%)
1
71 (51.1%)
2
21 (15.1%)
3
3 (2.2%)
4
0 (0%)
a
Received adjuvant chemotherapy following surgical resection
Table 2 Neutrophil-to-Lymphocyte Ratios at Baseline, 6 Weeks &
12 Weeks
Interval
Change in NLR (n, %)
Baseline
–
Median NLR
3.6
0.1898 – 30.910
Range
6 Weeks
Increase (63, 45.6%)
3.11
0.2703 – 42.11
serial measurements of weight and NLR were found to be
significantly associated in a longitudinal mixed effects regression analysis (slope = −0.06, p < 0.001).
The range of weight change was −13.17 kg to +16.61 kg
(median −0.5 kg, mean −0.89 kg) over 12 weeks from initiation of chemotherapy. 55 patients experienced weight
gain ≥ +0.1 kg at 12 weeks; of that group, 41 patients
exhibited weight gain at 6 weeks. Of the 55 patients
who gained weight at 12 weeks, the median weight gain
was +2.41 kg. 73 patients lost weight at 12 weeks, and
the median weight loss was −3.08 kg (Table 3). 37
patients gained albumin at 12 weeks; of that group, 25
patients had gained albumin at 6 weeks. The median
albumin gain was +0.4 g/dL. 40 patients had a decrease
in albumin at 12 weeks, with a median loss of −0.2 g/dL.
20 patients had no change in their albumin (Table 3). Although there is variability amongst individual patients,
there is a longitudinal inverse relationship between NLR
and weight change (cor −0.06224, p < 0.001). There was
no observed association between weight change and albumin change at 6 or 12 weeks (p = 0.265).
In addition, of the 96 patients who had a baseline ALI
score available (Table 4), 38 (39.5%) patients had a baseline ALI < 18 with median OS of 9.6 months compared
to the 58 patients with ALI ≥ 18 with median OS not
reached (p = 0.001). Of 93 patients who had a 6 week
ALI score available, 41 (44%) had an ALI < 18 with median OS 11.4 months compared to the 52 patients with
ALI >18 with median OS not reached (p = 0.03). Of the
84 patients who had a 12 week ALI score available, 30
(35.7%) had an ALI < 18 with median OS of 9 months
compared to the 54 patients with ALI ≥ 18 with median
OS not reached (p < 0.001).
Tumor response was calculated at both 6 and 12week intervals. In total, there were 85 patients for
whom a 6-week response was measurable and 95 patients for whom a 12-week response was measurable.
Response data were not available for 54 patients at the
6-week time point and for 44 patients at the 12-week
time point because they had evaluable disease only
based on RECIST 1.1 response criteria or a CT scan
was not performed at that time point. Using a cutoff of
NLR > 5, there was a significant association between
progressive disease and NLR > 5 at 6 weeks (p = 0.02)
and at 12 weeks (p = 0.03). With a cutoff of NLR > 3.5,
there was a significant association between progressive
disease and NLR >3.5 at 6 weeks (p = 0.02), with a trend
toward significance at 12 weeks (p = 0.06).
Decrease (75, 54.4%)
N/A (1)
12 Weeks
Increase (67, 51.9%)
Decrease (62, 48.1%)
N/A (10)
3.52
0.2147 – 42.93
Discussion
Our understanding of the relationship between cancer
cachexia, inflammation, and survival in NSCLC continues
to evolve. Pretreatment ALI (BMI*Albumin/NLR) has
been one attempt to bridge these three concepts, and was
Derman et al. BMC Cancer (2017) 17:141
Page 4 of 6
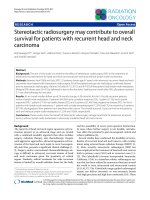
Fig. 1 Kaplan Meier Survival Plots by NLR. Kaplan Meier survival plots were generated using an NLR cutoff of 3.5 at baseline (a), at 6 weeks (b),
and at 12 weeks (c) and an NLR cutoff of 5 at baseline (d), at 6 weeks (e), and at 12 weeks (f). A significant difference in overall survival was seen
in all three categories, illustrating that an NLR > 3.5 and an NLR > 5 serve as poor prognostic factors associated with worse overall survival at
diagnosis and during chemotherapy
Table 3 Changes in Weight and Albumin at 6 & 12 Weeks
Weight Change at 6 Weeks (n)
Weight Change at 12 Weeks (n)
Median Weight Change at 12 Weeks
Increase (55)
Increase (55)
+2.41 kg
Decrease (80)
Decrease (73)
−3.08 kg
No change (4)
No change (1)
0 kg
N/A (10)
Albumin Change at 6 Weeks (n)
Albumin Change at 12 Weeks (n)
Median Albumin Change at 12 Weeks
Increase (36)
Increase (37)
+0.4 g/dl
Decrease (59)
Decrease (40)
−0.2 g/dl
No Change
No Change (20)
0 g/dl
N/A (44)
N/A (42)
No. Maintained Weight Gain from Weeks 6 to 12
41/55 (74.5%)
No. Maintained Albumin Gain from Weeks 6 to 12
25/37 (67.6%)
Derman et al. BMC Cancer (2017) 17:141
Page 5 of 6
Table 4 Advanced Lung Cancer Inflammation Index
Baseline (n = 97)
6 Weeks (n = 94)
ALI Range
1.73 - 497.36
0 - 337.16
1.15 - 429.79
ALI Median
21.61
25.02
25.71
ALI <18 Median OS
9.6 Months
11.4 Months
9 Months
ALI ≥18 Median OS
Not Reached
Not Reached
Not Reached
p-value
p = 0.001
p = 0.03
p < 0.001
shown to be an independent marker of poor outcome in
patients with advanced NSCLC when the ALI < 18 compared to ALI ≥ 18 [16]. Those patients had more sites of
metastatic disease, and poorer PFS (2.4 vs. 5.1 months,
p < 0.001) and OS (3.4 vs. 8.3 months, p < 0.001). Our
findings here confirm that a pretreatment ALI < 18 is associated with poorer OS in advanced stage NSCLC.
Tumor markers such as carcinoembryonic antigen
(CEA), cancer antigen 125 (CA-125), and squamous
cell carcinoma (SCC) antigen have been used to assist
in diagnosis and prognosis in lung cancer but are not
definitive [17, 18]. The advantage of using the NLR
alone as a longitudinal prognostic marker is in its ease
of use. The ability to use a single calculation to estimate
survival, derived only from a complete blood count
with differential, is attractive. A recent meta-analysis
demonstrated that an elevated NLR is associated with
shorter progression free and overall survival in both
NSCLC and SCLC, though the authors note the study
was limited by bias in publication, selection, and heterogeneity [19]. Another meta-analysis found that the
NLR had consistent prognostic value for overall survival in NSCLC with a cutoff value of 5 [20]. In patients
receiving first-line epidermal growth factor receptor
tyrosine kinase inhibitors (EGFR TKIs), the data are
heterogeneous. While one study showed that an elevated
NLR ≥ 3.5 was associated with poor outcomes in EGFRmutated advanced NSCLC [15], another has shown that
NLR did not affect survival in EGFR-mutated advanced
NSCLC [21].
The data presented here not only shows that higher
baseline NLRs are associated with inferior OS, but that
progressive increases in NLR during treatment also portend a worse prognosis. Importantly, longitudinal NLRs
are inversely related to both overall survival and serial
body weights. Thus, the NLR has the potential for prognostication throughout a patient’s treatment course. This
is confirmed by the evidence that shows a significant
association between progressive disease and NLR > 5 at
both 6 and 12 weeks following therapy initiation. These
findings suggest that patients with higher systemic inflammation at diagnosis may have more aggressive disease and should be treated promptly and potently, while
an increasing NLR during treatment may be a harbinger
of disease progression and treatment failure.
12 Weeks (n = 84)
Our findings are in line with evidence suggesting the
role of neutrophils in modulating the cancer milieu.
Neutrophils have the ability to suppress antitumor immunity, promote tumor cell proliferation, and enhance
tumor cell survival, all which serve to promote tumor
growth. Aging neutrophils are phagocytosed by macrophages, which have the ability to increase vascular permeability that enables tumor cell intravasation and metastasis
[22]. Supporting the potential specific association between
NLR and survival in NSCLC are studies in animal models
with a STK11/LKB1-inactivating mutation. Inactivation of
this tumor suppressor gene led to significant increases in
tumor-promoting cytokines and neutrophils with T-cell
suppressive effects. Interestingly, when an IL-6 antibody
was introduced to the murine model, the mice experienced both a significant decrease in tumor-associated
neutrophils and a significant improvement in survival
compared to the control mice [23].
Conclusions
It is likely that NLR is a surrogate for ongoing inflammation, and that inflammation may be a linchpin that links
tumor progression with cachexia and overall survival.
While previous studies have shown the prognostic value
of baseline NLR, it has been suggested that longitudinal
NLRs may be more informative for individual patients
[14]. The negative correlation between longitudinal NLRs,
overall survival, and body weights observed in our patients
suggests that simply measuring longitudinal NLRs may
provide important prognostic information and may serve
as a real-time indicator of disease progression and the
degree of inflammation occurring in individual NSCLC
patients. If this observation is confirmed in larger studies,
it could have important implications for developing treatments for cancer cachexia and for designing combinations
of immune modulators.
Abbreviations
ALI: Advanced lung cancer inflammation index; BMI: Body mass index;
CXI: Cachexia index; EGFR: Epidermal growth factor receptor; NLR: Neutrophilto-lymphocyte ratio; NSCLC: Non-small cell lung cancer; OS: Overall survival;
PH: Proportional hazards; RECIST: Response evaluation criteria in solid tumors;
TKI: Tyrosine kinase inhibitor
Acknowledgements
Not applicable.
Derman et al. BMC Cancer (2017) 17:141
Funding
No external funding source.
Availability of data and materials
The datasets generated and/or analyzed during the current study are
available in the Figshare repository, />NLR_WeightGain_Deidentified_Data_csv/4604518.
Authors’ contributions
BD Data collection, manuscript preparation & revision. JM Data collection,
manuscript preparation & revision. MA Data collection, data analysis, manuscript
preparation. SS Data collection, data analysis, manuscript revision. SB Data
analysis, manuscript preparation & revision. MB Manuscript preparation,
manuscript revision. FE Manuscript preparation, manuscript revision. JB Data
collection, manuscript preparation & revision. PB Data collection, data analysis,
manuscript preparation. MF Data collection, manuscript preparation & revision.
All authors have read and approved the final version of this manuscript.
Competing interests
The authors declare that they have no competing interests.
Consent for publication
No individual person’s data is contained within the manuscript.
Ethics approval and consent to participate
This study was approved by the institutional review board at Rush University
Medical Center (#1303080), and the requirement for obtaining patient consents
was waived the IRB. As such, permission to publish deidentified data was
granted by said board.
Author details
1
Rush University Medical Center, Chicago, IL, USA. 2University of Texas
Southwestern Medical Center, Dallas, TX, USA. 3Department of Internal
Medicine, 1717 W Congress Parkway, 1025 Kellogg, Chicago, IL 606012, USA.
4
Division of Hematology/Oncology, 1725 W. Harrison St., Suite 809, Chicago,
IL 60612, USA. 5Division of Hematology/Oncology, 5323 Harry Hines
Boulevard, Dallas, TX 75390, USA. 6Department of Pathology, 1750 W.
Harrison St., Suite 1415, Chicago, IL 60612, USA. 7Department of Internal
Medicine, 1717 W. Congress Parkway, 10 Kellogg, Chicago, IL 60612, USA.
Received: 13 September 2016 Accepted: 8 February 2017
References
1. Fearon K, Strasser F, Anker SD, Bosaeus I, Bruera E, Fainsinger RL, et al.
Definition and classification of cancer cachexia: an international consensus.
Lancet Oncol. 2011;12:489–95.
2. Dewys WD, Begg C, Lavin PT, Band PR, Bennett JM, Bertino JR, et al.
Prognostic effect of weight loss prior to chemotherapy in cancer patients.
Eastern Cooperative Oncology Group. Am J Med. 1980;69:491–7.
3. Jatoi A, Daly BD, Hughes VA, Dallal GE, Kehayias J, Roubenoff R. Do patients
with nonmetastatic non-small cell lung cancer demonstrate altered resting
energy expenditure? Ann Thorac Surg. 2001;72:348–51.
4. Fearon KCH, Glass DJ, Guttridge DC. Cancer cachexia: mediators, signaling,
and metabolic pathways. Cell Metab. 2012;16:153–66.
5. Gielda BT, Mehta P, Khan A, Marsh JC, Zusag TW, Warren WH, et al. Weight
gain in advanced non-small-cell lung cancer patients during treatment with
split-course concurrent chemoradiotherapy is associated with superior survival.
Int J Radiat Oncol Biol Phys. 2011;81:985–91.
6. Patel JD, Pereira JR, Chen J, Liu J, Guba SC, John WJ, et al. Relationship
between efficacy outcomes and weight gain during treatment of
advanced, non-squamous, non-small-cell lung cancer patients. Ann Oncol.
2016;27:1612–9.
7. Topkan E. Weight gain as a surrogate marker of longer survival in advanced
non-small cell lung cancer patients. Ann Transl Med. 2016;4:381.
8. Collins J, Noble S, Chester J, Coles B, Byrne A. The assessment and impact
of sarcopenia in lung cancer: a systematic literature review. BMJ Open.
2014;4:e003697.
9. Krenn-Pilko S, Langsenlehner U, Thurner E-M, Stojakovic T, Pichler M, Gerger A,
et al. The elevated preoperative platelet-to-lymphocyte ratio predicts poor
prognosis in breast cancer patients. Br J Cancer. 2014;110:2524–30.
Page 6 of 6
10. Stotz M, Pichler M, Absenger G, Szkandera J, Arminger F, Schaberl-Moser R,
et al. The preoperative lymphocyte to monocyte ratio predicts clinical outcome
in patients with stage III colon cancer. Br J Cancer. 2014;110:435–40.
11. Hu K, Lou L, Ye J, Zhang S. Prognostic role of the neutrophil-lymphocyte
ratio in renal cell carcinoma: a meta-analysis. BMJ Open. 2015;5:e006404.
12. Lee S, Oh SY, Kim SH, Lee JH, Kim MC, Kim KH, et al. Prognostic significance
of neutrophil lymphocyte ratio and platelet lymphocyte ratio in advanced
gastric cancer patients treated with FOLFOX chemotherapy. BMC Cancer.
2013;13:350.
13. Yao Y, Yuan D, Liu H, Gu X, Song Y. Pretreatment neutrophil to lymphocyte
ratio is associated with response to therapy and prognosis of advanced
non-small cell lung cancer patients treated with first-line platinum-based
chemotherapy. Cancer Immunol Immunother CII. 2013;62:471–9.
14. Coffelt SB, Wellenstein MD, de Visser KE. Neutrophils in cancer: neutral no more.
Nat Rev Cancer. 2016;16:431–46.
15. Lin GN, Peng JW, Liu PP, Liu DY, Xiao JJ, Chen XQ. Elevated neutrophil-tolymphocyte ratio predicts poor outcome in patients with advanced nonsmall-cell lung cancer receiving first-line gefitinib or erlotinib treatment.
Asian Pacific Organization for Cancer Prevention. 2014. doi: 10.1111/ajco.
12273. [Epub ahead of print].
16. Jafri SH, Shi R, Mills G. Advance lung cancer inflammation index (ALI) at
diagnosis is a prognostic marker in patients with metastatic non-small cell
lung cancer (NSCLC): a retrospective review. BMC Cancer. 2013;13:158.
17. Arrieta O, Villarreal-Garza C, Martínez-Barrera L, Morales M, DorantesGallareta Y, Peña-Curiel O, et al. Usefulness of serum carcinoembryonic
antigen (CEA) in evaluating response to chemotherapy in patients with
advanced non small-cell lung cancer: a prospective cohort study. BMC
Cancer. 2013;13:254.
18. Molina R, Filella X, Augé JM, Fuentes R, Bover I, Rifa J, et al. Tumor markers
(CEA, CA 125, CYFRA 21–1, SCC and NSE) in patients with non-small cell
lung cancer as an aid in histological diagnosis and prognosis. Tumor Biol.
2003;24:209–18.
19. Zhao Q-T, Yang Y, Xu S, Zhang X-P, Wang H-E, Zhang H, et al. Prognostic
role of neutrophil to lymphocyte ratio in lung cancers: a meta-analysis
including 7,054 patients. Onco Targets Ther. 2015;8:2731–8.
20. Gu X-B, Tian T, Tian X-J, Zhang X-J. Prognostic significance of neutrophil-tolymphocyte ratio in non-small cell lung cancer: a meta-analysis. Sci Rep.
2015;5:12493.
21. Sim SH, Beom S-H, Ahn Y-O, Keam B, Kim TM, Lee S-H, et al. Pretreatment
neutrophil-lymphocyte ratio is not a significant prognostic factor in epidermal
growth factor receptor-mutant non-small cell lung cancer patients treated
with tyrosine kinase inhibitors. Thorac Cancer. 2016;7:161–6.
22. Engblom C, Pfirschke C, Pittet MJ. The role of myeloid cells in cancer therapies.
Nat Rev Cancer. 2016;16:447–62.
23. Koyama S, Akbay EA, Li YY, Aref AR, Skoulidis F, Herter-Sprie GS, et al. STK11/
LKB1 deficiency promotes neutrophil recruitment and proinflammatory
cytokine production to suppress T-cell activity in the lung tumor
microenvironment. Cancer Res. 2016;76:999–1008.
Submit your next manuscript to BioMed Central
and we will help you at every step:
• We accept pre-submission inquiries
• Our selector tool helps you to find the most relevant journal
• We provide round the clock customer support
• Convenient online submission
• Thorough peer review
• Inclusion in PubMed and all major indexing services
• Maximum visibility for your research
Submit your manuscript at
www.biomedcentral.com/submit