Cost-effectiveness and resource use of implementing MRI-guided NACT in ER-positive/HER2-negative breast cancers in The Netherlands
Bạn đang xem bản rút gọn của tài liệu. Xem và tải ngay bản đầy đủ của tài liệu tại đây (1.04 MB, 17 trang )
Miquel-Cases et al. BMC Cancer (2016) 16:712
DOI 10.1186/s12885-016-2653-y
RESEARCH ARTICLE
Open Access
Cost-effectiveness and resource use of
implementing MRI-guided NACT in
ER-positive/HER2-negative breast cancers in
The Netherlands
Anna Miquel-Cases1, Lotte M. G. Steuten2, Lisanne S. Rigter3 and Wim H. van Harten1,4*
Abstract
Background: Response-guided neoadjuvant chemotherapy (RG-NACT) with magnetic resonance imaging
(MRI) is effective in treating oestrogen receptor positive/human epidermal growth factor receptor-2 negative
(ER-positive/HER2-negative) breast cancer. We estimated the expected cost-effectiveness and resources required
for its implementation compared to conventional-NACT.
Methods: A Markov model compared costs, quality-adjusted-life-years (QALYs) and costs/QALY of RG-NACT vs.
conventional-NACT, from a hospital perspective over a 5-year time horizon. Health services required for and health
outcomes of implementation were estimated via resource modelling analysis, considering a current (4 %) and a full
(100 %) implementation scenario.
Results: RG-NACT was expected to be more effective and less costly than conventional NACT in both
implementation scenarios, with 94 % (current) and 95 % (full) certainty, at a willingness to pay threshold of €20.000/
QALY. Fully implementing RG-NACT in the Dutch target population of 6306 patients requires additional 5335 MRI
examinations and an (absolute) increase in the number of MRI technologists, by 3.6 fte (full-time equivalent), and of
breast radiologists, by 0.4 fte. On the other hand, it prevents 9 additional relapses, 143 cancer deaths, 23 congestive
heart failure events and 2 myelodysplastic syndrome/acute myeloid leukaemia events.
Conclusion: Considering cost-effectiveness, RG-NACT is expected to dominate conventional-NACT. While personnel
capacity is likely to be sufficient for a full implementation scenario, MRI utilization needs to be intensified.
Keywords: Cost-effectiveness, Resource utilization, Breast cancer, Neoadjuvant chemotherapy,
Response monitoring, MRI
Background
Neoadjuvant (preoperative) chemotherapy (NACT) is
equally effective as adjuvant chemotherapy in breast cancer [1], while offering the possibility of tailoring therapy
based on tumour response at monitoring [2]. Among
non-invasive imaging modalities for response monitoring,
contrast-enhanced magnetic resonance imaging (MRI) is
generally regarded as the most accurate for invasive breast
* Correspondence:
1
Department of Psychosocial Research and Epidemiology, Netherlands
Cancer Institute, Plesmanlaan 121, Amsterdam 1066 CX, The Netherlands
4
Department of Healthcare Technology and Services Research, University of
Twente, Drienerlolaan 5, 7522 NB Enschede, The Netherlands
Full list of author information is available at the end of the article
cancer. It has good correlation with pathologic complete
response (pCR), the most reliable surrogate endpoint of
survival [3–5].
Researchers in the Netherlands Cancer Institute (NKI)
have previously published criteria for monitoring NACT
response with MRI [6]. The research confirmed its prediction for pCR in the triple negative breast cancer subtype
[7], but not in oestrogen receptor-positive (ER+) and
epidermal growth factor receptor 2- negative (HER2-)
tumours. This was not an unexpected finding, given the
known low rates of pCR in ER-positive/HER2-negative
tumors [8, 9] make it an unsuitable measure of tumour
response in these tumours. Hence, to investigate their
© 2016 The Author(s). Open Access This article is distributed under the terms of the Creative Commons Attribution 4.0
International License ( which permits unrestricted use, distribution, and
reproduction in any medium, provided you give appropriate credit to the original author(s) and the source, provide a link to
the Creative Commons license, and indicate if changes were made. The Creative Commons Public Domain Dedication waiver
( applies to the data made available in this article, unless otherwise stated.
Miquel-Cases et al. BMC Cancer (2016) 16:712
benefit from response-guided NACT (RG-NACT), a subsequent study from this group used serial MRI response
monitoring as a readout of response [10]. In this study, unresponsive tumours to the first chemotherapy regimen were
switched to a second, presumably, ‘non-cross-resistant’ regimen. Upon study completion, the tumour size reduction
caused by the non-cross-resistant regimen was similar to
that in initially responding tumours after the first regimen.
Furthermore, relapse frequency in both groups was similar.
These observations suggested that ER-positive/HER2-negative tumours do benefit from RG-NACT with MRI, despite
not reaching pCR. These results are in line with those from
the German Breast Group [11], which also showed survival
advantage from RG-NACT in ER+ patients.
Compared to traditional NACT, RG-NACT has thus
shown to positively influence ER-positive/HER2-negative
patients’ survival, yet comes at additional monitoring
costs. Its onset costs may however be offset by a reduction in the subsequent medical costs. This can be explored via probabilistic cost-effectiveness analysis (CEA),
which quantifies the probability and extent to which RGNACT is expected to be cost-effective compared to conventional NACT as based on current evidence. Such information is of interest for health-care regulators who, under
the pressure of limited resources, are increasingly using
cost-effectiveness as a criterion in decision-making [12].
An important goal for decision-makers is the implementation of cost-effective health-care interventions into routine clinical practice. Yet this can often be jeopardized by
the lack of attention given to resource demands [13]. Implementation as described in a CEA may not always be
feasible, as this assumes that all physical resources (i.e., doctors, scanners, drugs) required by the new strategy are immediately available, regardless of actual supply constraints
(or likely demand). Ignoring these constraints may result in
negative consequences, from low levels of implementation
through to the technology not being implemented at all
[13]. Resource modelling is a method that quantitatively
captures the resource implications of implementing a new
technology. While this approach has scarcely been used in
health-care decision-making, it can be of great help to
health services planners who are challenged by implementation issues normally not addressed in CEAs.
Our aim is thus to estimate the expected costeffectiveness and resource requirements of implementing RG-NACT with MRI for the treatment of
ER-positive/HER2-negative breast cancers using The
Netherlands as a case study population.
Methods
This study followed the Consolidated Health Economic
Evaluation Reporting Standards (CHEERS) checklist and
did not require ethical approval [14].
Page 2 of 17
Treatment strategies
Two strategies were considered for the treatment of ERpositive/HER2-negative breast cancer women; RG-NACT
and conventional-NACT (Fig. 1). RG-NACT followed our
single-institution neoadjuvant chemotherapy program [10]:
treatment with NACT 1 (AC, doxorubicin 60 mg m − 2
and cyclophosphamide 600 mg m − 2 on day 1, every
14 days, with PEG-filgrastim on day 2) for three courses
(3x) followed by MRI scanning and subsequent classification into ‘favourable’ or ‘unfavourable’ responders to NACT
defined by previously published criteria [6]. In short, reduction of more than 25 % in the largest diameter of the
tumour at late enhancement on the interim MRI relative to
the baseline MRI was regarded as a ‘favourable’ response.
All other responses were classified as ‘unfavourable’.
Favourable patients continue with additional 3×NACT 1,
and unfavourable patients switch to 3×NACT 2 (DC, docetaxel 75 mg m − 2 on day 1, every 21 days and capecitabine
2 × 1000 mg m − 2 on days 1–14). Conventional-NACT
represented current practice: treatment with 6×AC. Following NACT, all patients underwent surgery, radiation therapy when indicated and at least 5-years of endocrine
treatment according to protocol.
Implementation scenarios
We performed the cost-effectiveness and resource
modelling analysis for two implementation scenarios in
the Netherlands, i.e. current implementation and full implementation. These scenarios were adopted in a hypothetical cohort of 6306 patients, reflecting the Dutch
target population of stage II/III ER-positive/HER2-negative breast cancers. These are patients with the same
baseline characteristics as those of our neoadjuvant
chemotherapy program, and thus, where RG-NACT
seems beneficial [10]. The current implementation scenario is defined as the number of stage II/III ERpositive/HER2-negative breast cancer patients currently
treated with RG-NACT divided by all stage II/III ERpositive/HER2-negative breast cancer patients. The full
implementation scenario considers the use of RG-NACT
in the entire stage II/III ER-positive/HER2-negative
breast cancer population. Although this is not entirely
likely, there is always a percentage of non-compliant
providers, we decided to present the maximum possible
resource use of RG-NACT. The number of patients
currently treated with RG-NACT was calculated as the
number of scans performed in the Netherlands (assuming 1 scan/patient) [15] minus the number of scans
performed for other disease areas than oncology [16],
other cancers than breast [17], other applications than
guiding response to therapy [18], other stages than II/III
[19], and other receptor expressions than ER-positive/
HER2-negative [20]. The entire stage II/III ER-positive/
HER2-negative breast cancer population was estimated
Miquel-Cases et al. BMC Cancer (2016) 16:712
Page 3 of 17
1-st year of the model:
2-5 years of the model
Neoadjuvant chemotherapy
Clinical evolution
Monitoring response
RFS response
R
Monitoring by MRI
Favourable
True favourable
DFS
Favourable
NACT 1 (3xAC)
Response-guided NACT
D
Unfavourable
False favourable
Markov model
True unfavourable
Markov model
False unfavourable
Markov model
NACT 1
(3xAC)
Favourable
Unfavourable
ER+/HER2-stage II-III
breast cancer patients
Conventional NACT
NACT 2 (3xDC)
Unfavourable
6xAC
Markov model
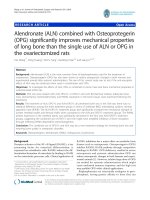
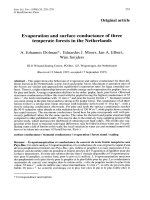
Fig. 1 Decision analytic model to compare the health-economic outcomes of treating ER-positive/HER2-negative stage II-III breast cancer patients
with response-guided NACT vs. conventional-NACT. Decision nodes (■); patient or health provider makes a choice. Chance nodes (●); more
than one event is possible but is not decided by neither the patient or health provider. Abbreviations: NACT = neoadjuvant chemotherapy;
RFS = relapse free survival; DFS = disease free survival; R = relapse; D = death; AC = cyclophosphamide, doxorubicine; DC = docetaxel, capecitabine
by multiplying the 2013 breast cancer incidence in the
Netherlands (The Netherlands Cancer Registry) by the
proportion of patients with stage II/III ER-positive/HER2negative breast cancer (calculations presented in Table 1).
Model overview
We developed a Markov model to estimate mean differences in clinical effects and costs of treatment with
RG-NACT vs. conventional-NACT from a Dutch hospital perspective. For each treatment strategy, the
model simulated the transitions of a hypothetical cohort of stage II/III ER-positive/HER2-negative breast
cancer patients of 50 years old over three healthstates: disease free (DFS), relapse (R, including local,
regional and distant) and death (D, including breast
cancer and non-breast cancer), during a 5-year time
horizon (Fig. 1). The model was programmed in
Microsoft Excel (Redmond, Washington: Microsoft,
2007. Computer Software).
Upon completion of the NACT intervention, patients in
each cohort entered the model in the DFS state (Fig. 1).
Patients treated under the RG-NACT strategy entered
the DFS model state classified as true-favourable, trueunfavourable, false-favourable and false-unfavourable
respondents of NACT at monitoring by using the 5-year
RFS (relapse free survival) as the “gold standard” for
NACT response. This was considered a sensible
assumption to capture all relapses related to NACT
response [21]. Definitions for true-favourable, trueunfavourable, false-favourable and false-unfavourable
respondents are presented in Table 2.
In year 1 of the DFS health-state, patients were attributed the costs and health related quality-of-life (HRQoL)
of the NACT intervention, except when there was an incidental MRI finding or when they suffered from
chemotherapy-related toxicities (Terminology for Adverse
Events grades 3 and 4 [22]); vomiting, neutropenia, handfoot-syndrome (HFS), desquamation and congestive heart
failure (CHF) [23, 24]). In these situations, there was
NACT interruption and temporary changes in costs and
HRQoL, except for HFS and desquamation. For these
toxicities there is no other curative treatment than
time, thereby, they were exempt of costs. From the
DFS health-state, patients could either move to the R
health-state, i.e., ‘relapse event’; move to the D healthstate, i.e., ‘non-breast cancer death event’; or stay in the
DFS health-state, i.e., ‘no event’. From the R health-state,
patients could either move to the D health-state, i.e.,
‘breast cancer or non-breast cancer related death event’;
or stay in the R health-state, i.e., ‘cured relapse’. We
assumed that patients could only develop one relapse. In
the 5th-year of the model, patients could incur long-term
NACT-related toxicities, including myelodysplastic syndrome (MDS) and acute myeloid leukaemia (AML) [25].
Miquel-Cases et al. BMC Cancer (2016) 16:712
Page 4 of 17
Table 1 Current implementation scenario calculation [15–20, 54]
=
Model input parameters
Input model parameters are presented in Table 3.
Clinical
The proportions of favourable and unfavourable patients
at monitoring and after 5-years of NACT were retrieved
from an updated version of the individual patient data
from Rigter et al. [10]. The transition probabilities (tp)
simulating a relapse and a breast cancer death event
were derived from Kaplan-Meyer (KM) curves. The first
from a KM of RFS (interval from finishing the NACT
intervention to occurrence of first relapse) and the second, from a KM of breast cancer specific survival (BCSS;
interval from relapse to occurrence of breast cancer
death). The KMs were either constructed uniquely with
raw data of Rigter et al. [10], or by using additional
assumptions, which we explain in detail below. Calculations were performed in SPSS (IBM Corp. Released
2013. IBM SPSS Statistics for Windows, Version 22.0).
RG-NACT: The tps for the group of false-unfavourable
and false-favourable patients were derived by using KMs
and the formula tp(tu) = 1 − exp{H(t − u) − H(t)} [26],
where u is the length of the Markov cycle (1 year) and H
is the cumulative hazard. Data for the KM of RFS came
from 25 relapsed patients from Rigter et al. [10], and
that of BCSS, from literature [27]. The tps of relapse and
breast cancer death for the true-favourable and trueunfavourable patients were assumed to be zero at all times,
as these patients do not relapse nor die from breast cancer
(see Table 2). Conventional-NACT: tps were derived from
KM curves, with data from the complete dataset of Rigter
et al. [10] for the RFS curve and data from literature [27]
for the BCSS curve. The formula to derive tps was:
tp(tu) = 1 − exp{1/τ(H(t − u) − H(t))} [26], where τ is the
treatment effect or hazard ratio (HR) of RG-NACT vs.
conventional-NACT. This formula allowed calculating
the tps from a “hypothetical” control arm, which was
inexistent in the Rigter et al. [10] study. The used HRs
were 0.5 for the RFS curve, and 0.6 for the BCSS curve.
Both HRs were derived from literature. They were set
equal to the reported HR of DFS and OS in a similar
population of ER-positive breast cancers where RGNACT vs. conventional-NACT was being compared [11].
As these assumptions could affect our cost-effectiveness
results, we performed a one-way and two-way sensitivity
analysis (SA) to the HRs (range 0.1 - 1.5).
The tps of non-BC related deaths (i.e., transition from
any state to D) were accounted for by using Dutch life
tables [28]. The occurrence of vomiting, neutropenia, HFS
and desquamation under 3×AC and 3×DC, were derived
from literature [24]. When a patient received both 3×AC
and 3xDC the probability of vomiting and neutropenia
was represented as the combined probability of two independent events (P(A and B) = P(A) * P(B)). The probability
of occurrence of CHF due to the administration of anthracyclines was accounted for in the 1st-year of the model
and was dose-dependent: 0.2 % with 3×AC and 1.7 % with
6xAC [23]. Also the probability of incidental findings at
Miquel-Cases et al. BMC Cancer (2016) 16:712
Table 2 Definitions of true-favourable, false-favourable,
true-unfavourable and false-unfavourable used in our study
Group of patients
Definition
True favourable
Patient that is classified as favourable at monitoring
(criteria [7]), continues receiving NACT 1, and after
5 years of follow up is classified as favourable due
to absence of relapse event
False favourable
Patient that is classified as favourable at monitoring
(criteria [7]), continues receiving NACT 1, and after
5 years of follow up is classified as unfavourable
due to presence of relapse event
True unfavourable
Patient that is unfavourable at monitoring
(criteria [7]), switches to NACT 2, and after 5 years
of follow up is classified as favourable due to absence
of relapse event (the underlying assumption is that the
patient was not responding to NACT1 but did to NACT 2,
thereby demonstrating that monitoring classified the
patient properly)
False unfavourable Patient that is unfavourable at monitoring
(criteria [7]), switches to NACT 2, and after 5 years
of follow up is classified as unfavourable due to
presence of relapse event (the underlying
assumption is that the patient was responding
to NACT1 and did not to NACT 2, thereby
demonstrating that monitoring classified
the patient wrongly)a
Although we are aware that in the ‘False favourable’ group there could be
patients irresponsive to both NACT 1 and 2, as the design of the RG-NACT
does not allow distinguishing them, we had to make such an assumption
a
MRI was accounted for in that year [29]. The frequency of
MDS and AML events was based on cumulative doses of
anthracycline and cyclophosphamide [25]. Patients whose
NACT was interrupted to treat toxicities were still assumed to benefit from NACT and the same relapse rate
was applied.
Page 5 of 17
Euros, using exchange currencies [37] and the consumer
price index to account for inflation [38].
Health-Related Quality of life
Utilities were derived from published literature. The
DFS utility was 0.78 except in the 1st-year cycle when
patients either accrued the utility of the NACT
regimen without toxicities i.e., 0.62 [39], the utility of
the NACT regimen with toxicities i.e., 0.62 minus the
utility decrements [40–42]) or the utility of anxiety in
patients were incidental findings at MRI occurred i.e.,
0.68 [43]. These utilities lasted for the whole cycle. The
R utility was calculated as an average of the utility of
local and distant relapse [39]. All utility weights were
obtained from sources using the EuroQoL EQ-5D
questionnaires, except anxiety, which was derived from
a Quality of Well-Being index [43]. There is no literature to suggest an effect of monitoring on HRQoL,
thus this was assumed unaltered.
Scenarios and resource modelling
Additional parameters to simulate the scenarios and to
perform the resource modelling exercise were added in the
model. These include a parameter reflecting the RGNACT uptake, and parameters illustrating the proportion
of i) patients with MRI contraindications (impaired renal
function due to the risk of developing Nephrogenic Systemic Fibrosis (NSF) [44], presence of ferrous body parts
like peacemaker (mean of values reported in [45–47], and
claustrophobia [48]), ii) patients with NSF [49], iii) patients
with malignant incidental findings [30] and iv) MRI technologists with acute transition symptoms (ATS) [50].
Costs
Intervention costs comprise of chemotherapy, monitoring,
chemotherapy-related toxicities and costs of confirming
incidental findings. To calculate drug dosages we assumed
patients of 60Kg and body-surface area of 1.6 m2. Drug
use was derived from study protocol, and costed by using
literature [30, 31] and Dutch sources on costs and prices
(Dutch National Health Care Institute; Dutch Healthcare
Authority; Dutch Health Care Insurance Board). Chemotherapy costs included day care and one visit to the oncologist per cycle. Costs of monitoring consisted of one
MRI scan [32] and one medical visit of 1 h (accounting for
waiting time) [31]. Costs of treating toxicities were taken
from literature [33–35]. Costs of confirming incidental
findings were estimated as an average of “standard diagnostic imaging” (i.e., Ultrasound, x-Ray and bone scintigraphy)
using prices from the ‘The Nederlandse Zorgautoriteit’
(Dutch Healthcare Authority) as a proxy [32]. Health state
costs, i.e., follow up costs for the DFS health state and detection plus treatment costs for the R health state, were derived from literature [36]. All results were reported in 2013
Cost-effectiveness analysis
The 5-year cumulative outcomes (health benefits and
costs) were simulated for a cohort of 6306 individuals. The
cost-effectiveness outcome measure was the incremental
cost-effectiveness ratio (ICER), which is the difference in
expected costs (per patient) divided by the difference in
expected effects expressed as (quality-adjusted) life-years
((QA)LYs)) of treating one hypothetical cohort with RGNACT vs. treating an identical cohort with conventionalNACT. For the current implementation scenario, we compared the expected costs and QALYs of a cohort as treated
with conventional-NACT, to the costs and QALYs of a
cohort partially treated with RG-NACT, as dictated by the
implementation rate and MRI contraindications. Patients
where RG-NACT was not implemented or MRI was contraindicated were modelled as receivers of conventionalNACT. The full implementation scenario was modelled in
the same way, except that the RG-NACT strategy was now
applied to all patients in the cohort, except those with MRI
contraindications receiving conventional-NACT.
Parameter
mean
SE
Parametersa
Distribution
Source
Clinical data
Monitoring performanceb (proportions)
True favourable
0,53
0,04
0,53/0,04
Dirichlet
[10]
True unfavourable
0,24
0,05
0,24/0,05
Dirichlet
[10]
False favourable
0,17
0,07
0,17/0,07
Dirichlet
[10]
False unfavourable
0,07
0,09
0,07/0,09
Dirichlet
[10]
0,05
0,02
5/98
beta
[24]
Chemotherapy related toxicities
Vomiting
3×AC
3×DC
0,24
0,04
24/77
beta
[24]
HFS
3×DC
0,22
0,04
23/80
beta
[24]
Neutropenia
3×AC
0,85
0,04
86/15
beta
[24]
3×DC
0,72
0,04
74/29
beta
[24]
Desquamation
3×DC
0,05
0,02
5/98
beta
[24]
CHF
3×AC
0,002
0,20
1/359
beta
[23]
6×AC
0,02
0,60
11/349
beta
[23]
AML/MDS
3×AC
0,003
0,001
12/4471
beta
[25]
6×AC
0,005
0,001
12/2372
beta
[25]
Tp1
0,14
0,06
4/24
beta
[10]
Tp2
0,29
0,08
8/20
beta
[10]
Tp3
0,47
0,09
13/15
beta
[10]
Miquel-Cases et al. BMC Cancer (2016) 16:712
Table 3 Input model parameters
Transition probabilities
Relapse
RG-NACT; False favourable/unfavourable
RG-NACT; True favourable/unfavourable
0,44
0,09
12/16
beta
[10]
0,40
0,09
11/17
beta
[10]
Tp12-5
0,00
NA
-
fixed
assumption
0,50
0,20
0,50/0,20
Normal truncated
assumption
Tp1
0,03
-
-
-
[10]
Tp2
0,06
-
-
-
[10]
Tp3
0,08
-
-
-
[10]
Tp4
0,05
-
-
-
[10]
Tp5
0,04
-
-
-
[10]
HR RFS (RG-NACT vs. conventional-NACT)
Conventional-NACT
Page 6 of 17
Tp4
Tp5
Breast cancer specific death
False favourable/unfavourable
Tp1
0,00
NA
-
fixed
assumption
Tp2
0,04
0,02
5/109
beta
[27]
Tp3
0,12
0,03
14/100
beta
[27]
Tp4
0,06
0,02
7/107
beta
[27]
Tp5
HR BCSS (RG-NACT vs. conventional-NACT)
Conventional-NACT
0,19
0,04
22/92
beta
[27]
0,64
0,13
0,64/0,13
normal
[11]
Tp1
0,00
NA
-
fixed
assumption
Tp2
0,06
-
-
-
[27]
Tp3
0,19
-
-
-
[27]
Tp4
0,09
-
-
-
[27]
Tp5
0,28
-
-
-
[27]
Chemotherapy
0,62
0,04
94/58
beta
[39]
Neutropenia
0,53
0,01
557/488
beta
[40]
Miquel-Cases et al. BMC Cancer (2016) 16:712
Table 3 Input model parameters (Continued)
Utilities
Anxiety
0,68
0,06
40/19
beta
[43]
Vomiting
0,52
0,08
17/16
beta
[41]
HFS
0,50
0,10
12/12
beta
[41]
Desquamation
0,59
0,01
1041/721
beta
[40]
CHF (average grade III/IV)
0,55
-
-
beta
[42]
CHF grade III
0,59
0,02
360/250
beta
[42]
CHF grade IV
0,51
0,05
52/50
beta
[42]
MDS/MLA
0,26
0,01
500/1423
beta
[55]
DFS
0,80
0,03
196/49
beta
[39]
R (average loco-regional and metastatic)
0,73
-
-
beta
[39]
Loco-regional relapse
0,68
0,03
226/104
beta
[39]
Metastatic relapse
0,78
0,04
104/30
beta
[39]
All
0,18
0,01
270/1265
beta
[29]
Malign
0,20
0,02
55/270
beta
[29]
0.07
0.1c
0.45/5.54
beta
[49]
Scenarios and resource modelling
Incidental findings
Impaired renal function
Page 7 of 17
MRI contraindications
Gadolinium allergy
0.0003
0.01d
0.08/29
-
[44]
Body ferrous parts
0.58
0.1
0.26/4.21
beta
[45]
Claustrophobia
0.02
0.1
0.02/0.94
beta
[48]
Uptake
0.04
20-100 %
fixed
assumption
MRI technologists with ATS
0.26
-
fixed
[50]
Mean cost
SEe
Costs
Parameter
Unit costs
Unit measure
Mean resource use
Distribution
Source
Chemotherapy
6×AC
Doxorubicin
€204
90 mg
5,3
€1306
€326
Gamma
[31]
Cyclophosphamide
€45
1080 mg
6,4
€239
€60
Gamma
[31]
Peg-filgrastim
€849
1 mg
6
€5096
€1274
Gamma
[56]
Pharmacy preparation
€45
Per course
6
€267
67
Gamma
NKI
Day care
€286
Day
6
€1718
€430
Gamma
[30]
Oncologist’s visit
€109
Visit
6
€653
€163
Gamma
[31]
€204
90 mg
3,2
€653
€163
Gamma
[31]
€9279
Total
3×AC/3×DC
Doxorubicin
Miquel-Cases et al. BMC Cancer (2016) 16:712
Table 3 Input model parameters (Continued)
Cyclophosphamide
€45
1080 mg
2,7
€120
€30
Gamma
[31]
Peg-filgrastim
€849
1 mg
3
€2548
€637
Gamma
[56]
Docetaxel
€959
108 mg
3,3
€3195
€799
Gamma
[31]
Capecitabine
€27
4500 mg
29,9
€821
€205
Gamma
[31]
Pharmacy preparation
€45
Per course
€267
€67
Gamma
NKI
Day care
€286
Day
6
€1718
€430
Gamma
[30]
Oncologist’s visit
€109
Visit
6
€653
€163
Gamma
[31]
€9974
Total
Monitoring
MRI scan
Hospital costs
€163
Scan
1
€163
€41
Gamma
Specialists fees
€52
Scan
1
€52
€13
Gamma
€149
Episode
1
€149
€37
Gamma
Neutropenia
€14397
Episode
1
€14397
€425
Gamma
[35]
Vomiting
€92
Episode
1
€92
€23
Gamma
[57]
€215
Total
Confirm incidental findings
Page 8 of 17
Chemotherapy related toxicities
CHF
€18225
Episode
1
€18225
€4556
Gamma
[33]
MDS/MLA
€112946
Episode
1
€112946
€28236
Gamma
[58, 59]
Health states
DFS
In & out –patient
€2793
Episode
1
€2793
€563
Gamma
[36]
Drugs
€79
Episode
1
€79
€20
Gamma
[36]
€2872
Total
R
Local relapse
In & out -patient
€12497
Episode
1
€12497
€1692
Gamma
[36]
Drugs
€2336
Episode
1
€2336
€584
Gamma
[36]
In & out -patient
€11645
Episode
1
€11645
€1346
Gamma
[36]
Drugs
€5772
Episode
1
€5772
€1443
Gamma
[36]
€2074
Gamma
[36]
Distant metastasis
€16125
Total
BC death
Miquel-Cases et al. BMC Cancer (2016) 16:712
Table 3 Input model parameters (Continued)
€8296
Episode
1
€8296
Abbreviations: SE standard error, AC cyclophosphamide, doxorubicine; DC docetaxel, capecitabine; HFS hand-food-syndrome, CFH congestive heart failure, AML/ADM acute myeloid leukaemia/myelodysplastic syndrome,
MRI magnetic resonance imaging, tp transition probability, HR hazard ratio, RG-NACT response guided neoadjuvant chemotherapy, NACT neoadjuvant chemotherapy, DFS disease free survival, R relapse, RFS relapse free
survival, BCSS breast cancer specific survival, BC breast cancer, ATS acute transition symptom, NKI Netherlands Cancer Institute
a
Dirichlet distribution: mean/SE, Beta distribution: α/β, Normal distribution: mean/SE
b
We derived these proportions with the dataset of Rigter et al., as explained in the section ‘clinical input parameters’ and following the definitions of ‘Table 2’
c
We assumed a SE = 0.1
d
We assumed a SE = 0.01
e
We assumed SE = 0.25 when this was not available from literature
Page 9 of 17
Miquel-Cases et al. BMC Cancer (2016) 16:712
We performed a probabilistic sensitivity analysis (PSA)
after assigning a distribution to each model parameter
following the recommendations by Briggs et al. [38]. A
beta distribution was assigned to binomial data such as
toxicities and transition probabilities, a dirichlet distribution to the proportions of true/false favourable/unfavourable patients, and a gamma distribution to utilities
and costs (Table 3). The uncertainty surrounding the
model results was presented as cost-effectiveness acceptability curves (CEAC), which reflect the probability of
each alternative to be cost-effective across a range of
threshold values for cost-effectiveness. We discounted
future costs and health effects at a 4 % and 1.5 % yearly
rate respectively, according to the Dutch guidelines on
health-economics evaluations [51]. A strategy was considered cost-effective if the ICER did not exceed the
willingness-to-pay threshold of €20.000/QALY.
Resource modelling analysis
We estimated the health services required and the health
outcomes experienced in each strategy. Health services
required included: number of 1) MRI scans performed,
2) patients scanned per MRI, 3) Full-time equivalent
(FTE) MRI technologists, 4) FTE breast radiologists and
5) confirmation of incidental findings. Health outcomes
included: number of 1) relapses prevented, 2) breast cancer deaths prevented, 3) excluded patients due to contraindications, 4) patients with adverse events (including
NSF, CHF and AML/ADS), 5) patients with anxiety due
to incidental findings, 6) patients with malignant incidental findings, and 7) fte MRI technologists with ATS.
These outcomes were analysed deterministically for the
current and full implementation scenarios and expressed
for the 6306 ER-positive/HER2-negative breast cancer
women. A detailed description of the calculations and
sources for each outcome is presented in (Table 4).
Volumes of health services needed were also calculated
at the hospital level, which required determining the number of hospitals expected to offer RG-NACT under each
scenario. For current implementation, we assumed RGNACT to be used in the 16 hospitals of the largest Dutch
hospital network currently involved in the RG-NACT trial
NCT01057069 (Clinical Trials.gov). Although this trial excludes ER+ patients, we expected involved hospitals to
have endorsed RG-NACT in other subtypes with single
institution studies, as is the case in the NKI. For the
full implementation, we considered all 113 hospitals
(locations) with MRI that deliver cancer treatment (i.e.,
university, general and specialized hospitals), as identified from the database published by the National Public
Health Atlas [52]. The presence and quantity of MRI
scans per hospital was either taken from that hospital’s
website or based on literature [50], indicating 3 MRIs
per academic hospital and 1 per general hospital.
Page 10 of 17
As increasing RG-NACT uptake from 4 to 100 % is
not realistic in a short time-frame, we explored the resource requirements and health outcomes across a range
of implementation rates via one-way SA including 20,
40, 60 and 80 % uptake.
All assumptions made were confirmed by an experienced MRI technologist in a general hospital. One-way
SAs on one key-assumptions was done: ‘the time required by a breast radiologist for MRI scan interpretation’ (range 6.8–15 min).
Results
Cost-effectiveness analysis
At current implementation (4 %) RG-NACT was expected to result in 0.005 QALYs gains and savings of €13
per patient. Under full implementation, RG-NACT is expected to generate 0.12 additional QALYs and savings of
€328 per patient (Table 5). In both scenarios, RGNACT is expected to dominate (be more effective and
less costly) than conventional-NACT. The results of
the PSAs show that at a willingness to pay threshold of
€20.000/QALY, RG-NACT is expected to be the optimal strategy under the current and full implementation
scenarios, with 94 and 95 % certainty respectively
(Fig. 2).
SAs of RFS and BCSS hazard ratios (baseline values of
0.5 and 0.64 respectively), invariably showed the RGNACT strategy to be cost-effective (Table 4). Even when
LYs were slightly higher in the conventional-NACT arm
(i.e., with HRs of >1), the better quality of life provided
by the DC treatment of the RG-NACT strategy (lower
and better tolerated adverse events) maintained the incremental QALYs for the RG-NACT strategy.
Resource modelling analysis
Under the current implementation scenario we calculated that over 5-years, the RG-NACT strategy requires
218 MRI scans to be performed in the target population
of 6306 women, after 40 exclusions due to contraindications. With 31 MRI scans currently used for this purpose
(estimated number of MRI scans in the multicentre
NCT01057069 trial), 7 patients were scanned/MRI, requiring a total of 0.2 fte MRI technologists and 0.02 fte
breast radiologists. At the hospital level covering a
population of 6306 breast cancers, 14 MRI scans would
be required for the prevalent population over a 5-year
timeframe. Assuming an average capacity of 2 MRI
scans/hospital (estimated weighted average of MRI
scans/hospital within the multicentre NCT01057069
trial), this would translate to 7 patients scanned/MRI,
demanding 0.01 fte MRI technologists and 0.001 fte
breast radiologists per hospital. In terms of health outcomes, the current implementation scenario was expected to prevent 0.4 relapses and 6 breast cancer
Miquel-Cases et al. BMC Cancer (2016) 16:712
Page 11 of 17
Table 4 Resource modelling outcomes, sources and calculations
Current implementation
(16 hospitals, 31 MRIs)
Full implementation
(113 hospitals, 148 MRIs)
Source
Health services required at the country level
No of MRIs scans performed
Calculations in Table 2
No of stage II-III, ER-positive/HER2-negative
breast cancers in the Netherlands
See Table 2
No of patients scanned per MRI
‘No of MRI scans performed’/31 MRIsa
‘No of MRI scans performed’/148 MRIsa
See
footnote a
Fte MRI technologists required
Yearly hours required of MRI technologist to perform idem
the ‘No of MRIs scans performed’/Fully workable
hours of an MRI technologist a yearb
See
footnote b
Fte breast radiologists required
Yearly hours required of breast radiologist to perform idem
the ‘No of MRIs scans performed’/Fully workable
hours of a breast radiologist a yearc
See
footnote c
No of confirmations of incidental
findings (using standard imaging)
Derived from the Markov model
idem
-
Health services required at the hospital level
No of MRIs scans performed per
hospital
‘No of MRI scans performed’/16 hospitalsd
‘No of MRI scans performed’/113 hospitalse
See
footnote d
and e
No of patients scanned per MRI per
hospital
‘No of MRI scans performed per hospital’/mean
MRIs per hospitala
‘No of MRI scans performed per hospital’/
mean MRIs per hospitala
See
footnote a
Fte MRI technologists required per
hospital
Yearly hours required of MRI technologist to perform idem
the ‘No of MRI scans performed per hospital’/Fully
workable hours of an MRI technologist a yearb
See
footnote b
Fte breast radiologists required per
hospital
Yearly hours required of breast radiologist to perform idem
the ‘No of MRI scans performed per hospital’/Fully
workable hours of a breast radiologist a yearc
See
footnote c
Health outcomes gained at the country level
No of relapses prevented
Derived from the Markov model
idem
-
No of breast cancer deaths prevented
Derived from the Markov model
idem
-
No of excluded patients due to
contraindications
Derived from the Markov model
idem
-
No of patients with NFS
‘No of MRI scans performed’* p of NSF
idem
[48]
Fte MRI technologists with ATS
‘Fte MRI technologists required’* p of ATS
idem
[49]
No of patients with CHF
Derived from the Markov model
idem
-
No of patients with long term AML/
ADS
Derived from the Markov model
idem
-
No of patients with anxiety due to
incidental findings
Derived from the Markov model
idem
-
No of patients with malignant
incidental findings
‘No of confirmations of incidental findings’
*p malignant incidental findingsf
idem
[28]
Health outcomes lost at the country level
Abbreviations: No number, Fte full-time equivalent, MRI magnetic resonance imaging, RG-NACT response guided neoadjuvant chemotherapy; p probability, NSF
nephrogenic systemic fibrosis, ATS acute transient symptom, CHF chronic heart failure, DSF disease free survival, R relapse, AML/ADS myelodysplastic syndrome/
acute myeloid leukaemia
Note that when a calculation refers to another outcome of the table this is always the outcome within the same column i.e., within the same implementation rate
Idem means calculated equal as the left cell, but adapted to the full implementation scenario figures
a
We search for this information in each hospital website. When this information was not available or unclear, we made use of literature [49] where the most
frequent quantity of MRIs per type of hospital is presented (three for academic hospitals and one for general hospitals)
b
Hours required of MRI technologists for the ‘No of MRIs scans performed (per hospital)’ in a year are calculated by assuming that a full scanning procedure
requires 1 h of MRI technologist. Employees were assumed to work 52 weeks/year, 5 days/week i.e., 260 days/year. Of these, 40 days would be vacation and sick
days, resulting thus in 220 workable days/year. Assuming workers are employed for 8 h/day this results in 1760 working hours/year. Yet workers need some time
off during their working days i.e., breaks, assumed to be 20 %. Thereby, a fully workable year is of 1408 h
c
Hours required of breast radiologist for the ‘No of MRIs scans performed (per hospital)’ in a year are calculated by assuming a mean of 6.8 min needed for a
breast radiologist to interpret one MRI scan [53]. The workable hours a year of a breast radiologist were calculated exactly as explained in footnote 2
d
Assuming its use in the biggest Dutch hospital network involved in RG-NACT (see ‘resource modelling analysis’ section)
e
Assuming its use in all Dutch hospitals (locations) with MRI expected to deliver cancer treatment (i.e., university, general and specialized hospitals)
(see ‘resource modelling analysis’ section)
f
After confirming by ultrasound
Miquel-Cases et al. BMC Cancer (2016) 16:712
Page 12 of 17
Table 5 Resource modelling and cost-effectiveness results for the current and full implementation scenarios of response-guided
NACT in the Netherlands
Cost-effectiveness analysis expressed per patient
Current implementation (4 %)
RG-NACT disc
Full implementation (100 %)
Costs (€)
LYs
QALYs
Δ costs (€)
Δ QALYs
ICER
Costs (€)
LYs
QALYs
Δ costs (€)
Δ QALYs
ICER
28013
4.58
3.46
−13
0.005
dominanta
27698
4.64
3.58
−328
0.12
dominant
RG-NACT undisc
30362
4.79
3.62
−14
0.005
dominant
30021
4.85
3.74
−355
0.13
dominant
Conventional-NACT disc
28026
4.58
3.45
-
-
-
28026
4.58
3.45
-
-
-
Conventional-NACT undisc
30377
4.76
3.61
-
-
-
30377
4.76
3.61
-
-
-
One-way and two-way sensitivity analysis
ICER
HR RFS
ICER
HR OS
ICER
HR RFS/BCSS
0.1
€-12857/QALY
(cost-effective)
0.1
€1190/QALY
(cost-effective)
0.1/0.1
€-922/QALY
(cost-effective)
1
€2398/QALY
(cost-effective)
1
€-10692/QALY
(cost-effective)
1/1
€1139/QALY
(cost-effective)
1.5
€9367/QALY
(cost-effective)
1.5
€-15507/QALY
(cost-effective)
1.5/1.5
€10299/QALY
(cost-effective)
Resource modelling analysis expressed in relation to the Dutch population of ER-positive/HER2-negative breast cancer women (n = 6306)c
Current implementation
(16 hospitals, 31 MRIs)
Full implementation
(113 hospitals, 148 MRIs)
Transition from current to
full implementation
No of MRIs scans performed
218
5335
+5117
No of patients scanned per MRI
7
36
+29
Fte MRI technologists
0.2
3.8
+3.6
Fte breast radiologists
0.02
0.4
Health services required at the country level
b
+0.4
b
0.04 (↑121 %)
0.95 (↑121 %)
38
939
+901
No of MRIs scans performed per hospital
14
47
+33
No of patients scanned per MRI per hospital
7
36
+29
Fte MRI technologists per hospital
0.01
0.03
+0.02
Fte breast radiologists per hospital
0.001
0.004
+0.003
0.002b (↑121 %)
0.001b (↑121 %)
No of confirmations of incidental findings
(using standard imaging)
Health services required at the hospital level
Health outcomes gained at the country level
No of relapses prevented
0.4
9
+9
No of breast cancer deaths prevented
6
149
+143
No of excluded patients due to contraindications
40
971
+931
No of patients with NFS
0.07
2
+2
Fte MRI technologists with acute transient symptom
0.04
0.9
+1
No of patients with CHF
106
83
−23
No of patients with long term AML/ADS
23
21
−2
No of patients with anxiety due to incidental findings
38
939
+901
No of patients with malignant incidental findings
8
192
+184
Health outcomes lost at the country level
Abbreviations: Disc discounted, undisc undiscounted, No number, Fte full-time equivalent, MRI magnetic resonance imaging, NSF nephrogenic systemic fibrosis,
ATS acute transient symptom, CHF chronic heart failure, AML/ADS myelodysplastic syndrome/acute myeloid leukaemia
a
RG-NACT is more effective and less costly than conventional NACT
b
if radiologists spent 15 min to interpret 1 MRI scan
c
When possible, figures were rounded to the nearest whole number
Miquel-Cases et al. BMC Cancer (2016) 16:712
Page 13 of 17
RG-NACT current implementation rate
RG-NACT full implementation rate
Conventional-NACT current implementation rate
Conventional-NACT full implementation rate
1
Probability of cost-effectiveness
0.9
0.8
0.7
0.6
0.5
0.4
0.3
0.2
0.1
0
Willingness to pay for QALY ( )
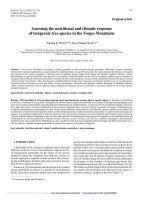
Fig. 2 Cost effectiveness acceptability curves. At a willingness to pay threshold of €20.000/QALY, RG-NACT is expected to be the optimal strategy
with 94 and 95 % certainty under the current and full implementation scenarios respectively
deaths, while yielding 0.07 patients with NSF. Besides,
106 patients would have a CHF, 23 patients would suffer from AML/ADS and 38 incidental findings were
expected, of which 8 would be malignant. Of the required 0.2 fte MRI technologists, 0.04 fte would suffer
from ATS (Table 4).
Under the full implementation scenario, we calculated
that 5335 MRI scans would be needed over a 5-year
period for the 6306 pertinent breast cancer population,
after excluding 971 patients for contraindications. With
148 MRI scans available (estimated number of MRI
scans in the estimated 113 hospitals), this would require
36 patients to be scanned/MRI for which 3.8 fte MRI
technologists and 0.4 fte radiologists are needed. At the
hospital level, 47 MRI scans are expected to be performed
for the prevalent population of 6306 within 5-years. Assuming the mean MRI scans/hospital is 1.3 (estimated
weighted average of MRIs/hospital within the estimated
113 hospitals), 36 patients would be scanned per MRI,
requiring 0.03 fte MRI technologists and 0.004 fte
breast radiologists per hospital. In terms of health outcomes, the full implementation scenario was expected
to prevent 9 relapses and 149 breast cancer deaths, but
to bring about 2 patients with NSF, 83 patients with
CHF and 21 patients with AML/ADS. Furthermore,
there are 939 incidental findings expected, of which
192 would be malignant, and 0.9 fte MRI technologists
are projected to get ATS (Table 4).
The transition from current (4 %) to full (100 %) implementation is expected to increase the number of examinations by 5117 (2347 %) countrywide or by 33
(247 %) per hospital, consequently demanding an increase of scan utilization (for an additional 29 patients),
an increase in the number MRI technologists by 3.6 fte
countrywide or by 0.02 fte per hospital, and a marginal increase in breast radiologists by 0.4 fte countrywide or by 0.003 fte per hospital. In terms of
health outcomes, full implementation would diminish
the number of breast cancer related deaths and relapses by 25-fold (from 6 to 149) and 23-fold (from
0.4 to 9) respectively, and the number of CHF and
AML/MDS by ~0.8-fold (from 106 to 83) and ~0.9fold (from 23 to 21) respectively. However, these
would come at the cost of a ~25-fold increase on
health losses (additional 2 patients with NSF, 1 fte
MRI technologist with ATS, 901 patients with anxiety due
to presence of incidental findings, and 184 patients with
confirmed malignant findings).
The one-way SA to the RG-NACT uptake rate
showed that increasing rates markedly increases the
number of patients with MRI contraindications, the
number confirmatory scans and the number of patients with anxiety while awaiting for those (Fig. 3).
Simultaneously, the number of cancer deaths, and the
number of patients with CHF and AML/ADS decreased consistently (by ~1.5, ~0.98 and ~0.95 -fold
per 20 % rate increase).
The results of the one-way SA on the radiologists’
working pattern assumption showed that increasing the
time required for MRI scan interpretation to 15 min,
increased the ‘fte breast radiologists’ required by 121 %
(Table 4).
Miquel-Cases et al. BMC Cancer (2016) 16:712
a
Page 14 of 17
b
Number (No)
Number (No)
No of MRI scans required
No of confirmations of incidental findings
Fte radiologists required
Fte MRI technologists required
6000
5000
1000
No of patients with MRI contraindications
No of patients with anxiety (incidental findings)
No of patients with malignant incidental findings
No of breast cancer deaths prevented
No of patients with CHF
Fte MRI technologists with ATS
No of patients with AML/ADM
No of relapses prevented
No of patients with NFS
900
800
700
4000
600
3000
500
400
2000
300
200
1000
100
0
0
0%
20%
40%
60%
80% 100%
Implementation rate
0%
20%
40%
60%
80%
100%
Implementation rate
Fig. 3 Influence of implementation rates on resource modelling outcomes, (a) on health services required and (b) on health outcomes.
Abbreviations: No = number; Fte = full-time equivalent; MRI = magnetic resonance imaging; ATS = acute transition syndrome; CHF = chronic heart
failure; AML/ADM = acute myeloid leukaemia/myelodysplastic syndrome; NFS = nephrogenic systemic fibrosis
Discussion
The aim of our study was to estimate the cost-effectiveness
and resource requirements of implementing RG-NACT
with MRI for ER-positive/HER2-negative breast cancer
patients using The Netherlands as a case study population.
As RG-NACT is an emerging treatment approach and its
implementation is at its onset, we performed these analyses
under a current implementation scenario of 4 % uptake,
and under a full implementation scenario, to anticipate the
outcomes of a potential wider roll-out.
At the current 4 % uptake RG-NACT is expected to
be less expensive and achieve more QALYs than
conventional-NACT. With higher implementation rates,
more patients will be treated with this cost-saving and
effective strategy, rendering RG-NACT ever more dominant. At full implementation, 0.12 additional QALYs
and savings of €328 per patient are expected. This is
achieved despite 15 % (971 out of the 6303 patients)
being treated with conventional-NACT due to MRI
contraindications. In both scenarios, decision uncertainty surrounding the ICERs is low (~5 %).
The main drivers of advantageous survival in the RGNACT are the HRs used to derive the hypothetical survival
of the conventional-NACT strategy. Either of the HRs used
(for RFS and BCSS) was below 1, thus implying less breast
cancer related events in the RG-NACT strategy compared
to the conventional-NACT strategy. These values were
based on best available data from the GeparTrio trial [11],
but this evidence is still preliminary. One- and two-way SA
of these HR values demonstrated that even when survival
was higher in the conventional-NACT strategy, the better
quality-of-life derived from DC treatment in the RG-NACT
strategy maintained the cost-effectiveness of RG-NACT.
The cost savings of RG-NACT hinge on a satisfactory
diagnostic performance of MRI. Under current diagnostic performance, 79 % of patients would not yield any
event in the RG-NACT strategy, compared to 76 % in
conventional-NACT. Although the prevention of these
events came at the costs of 30 % of patients receiving a
more expensive treatment than conventional-NACT
(>€695), as treating one relapse is even more expensive
(€16125), RG-NACT was still cost saving.
The resource modelling analysis showed that increasing RG-NACT uptake rates from 4 to 100 % is expected
to increase the number of examinations by 5117
(2347 %), consequently demanding a 5-fold increase in
scans utilization, a 19-fold increase in the number MRI
technologists and a 20-fold increase in the number of
breast radiologists. Thereby, adapting current practice to
meet these resources requires paying special attention to
the availability and utilization of MRIs, as well as availability of technical personnel. For instance, fully implementing RG-NACT in the Netherlands, where 5701
MRI examinations were performed in 2013 (considering
843765 MRI examinations [15] performed in 148 MRIs),
would only require 2 days of additional MRI scanning
per year. However, current MRI utilization is already intense; considering 1 scan lasts 1/2 h and the scan works
8 h/day, 843765 MRI examinations results in 356 days of
MRI scanning. As there are only 260 workable days a
year, hospitals had to intensify MRI’s use i.e., by adding
extra evening shifts. Hence, adding 2 extra days of scanning a year would require of an even more intense MRI
utilization. In terms of personnel, the number of required MRI technologists and breast radiologists are not
expected to be a limiting implementation factor. While
fully implementing RG-NACT would require additional
2 fte MRI technologists and 1 fte breast radiologists to
the current 403 fte MRI technologists and 91 fte breast
radiologists required a year, availability is estimated to
be of 1700 MRI technologists countrywide [50] and 10
breast radiologists per hospital [53].
Miquel-Cases et al. BMC Cancer (2016) 16:712
In terms of health outcomes gained, full implementation would diminish the number of breast cancer
related deaths and relapses by 25- and 23-fold
respectively, and the number of severe and costly
adverse events as CHF and AML/MDS by ~0.8- and
~0.9-fold respectively. However, these would come at
the cost of a parallel ~25-fold increase in patients
with NSF, MRI contraindications, MRI technologists
with ATS and incidental findings causing anxiety and
other diseases.
Our post-hoc analysis on resource requirements at
various RG-NACT implementation rates allow identifying those that seem feasible given current resources.
Considering current MRI machines and personnel
capacity, RG-NACT implementation seems feasible at
any rate. However, it would be interesting to further
investigate whether there is sufficient capacity to
handle an increase of incidental findings (requiring
further diagnostic examinations), as well the costconsequences of treating those that are diagnosed as
malignant.
Our study has some limitations. A limitation of the
response-guided approach itself was the impossibility to
distinguish in the false-unfavourable group, patients truly
falsely classified at monitoring from patients irresponsive to
3×DC or NACT in general. Yet, as this is inherent to
guided-NACT, it was included as such in the model. Furthermore, we did not consider adjuvant treatment in our
model, as the administration of this was similar between
arms. Moreover, we considered AC, instead of a 3rd
generation regimen containing taxanes as standard
treatment because it was considered the best comparator for the used RG-NACT regimens. As costs of
those are different, we performed a post-hoc one-way
SA and found that RG-NACT would become more
dominant due to increased cost savings. Additionally,
we only accounted for direct-medical costs as other
cost beyond the direct hospital-based treatment, such
as productivity losses or home health care exist, are
less likely to influence decision-making.
Conclusion
While the typical CEA assumes perfect implementation
of the strategy under investigation, we showed the
impact of implementation rates on incremental health
gains and cost-savings of RG-NACT in the Dutch
population of ER-positive/HER2-negative breast cancers.
Furthermore, we showed that fully implementing
RG-NACT generates a ~24-fold increase in health
benefits, but requires MRI and personnel capacity to
be increased by 5- and ~20-fold. In the Netherlands,
personnel capacity is likely to be sufficient for a full
implementation scenario, but MRI utilization needs
to be intensified.
Page 15 of 17
Abbreviations
AC, doxorubicin and cyclophosphamide; AML, acute myeloid leukaemia; ATS,
acute transition symptoms; BCSS, breast cancer specific survival; CEA, cost
effectiveness analysis; CEAC, cost-effectiveness acceptability curves; CHEERS,
Consolidated Health Economic Evaluation Reporting Standards; CHF,
congestive heart failure; D, death; DC, docetaxel and capecitabine; DFS,
disease free survival; ER, oestrogen receptor; Fte, full time equivalent;
HER2, human epidermal growth factor receptor-2; HFS, hand food
syndrome; HR, hazard ratio; HRQoL, health related quality of life; ICER,
incremental cost-effectiveness ratio; KM, Kaplan Meyer; LY, life years; MDS,
myelodysplastic syndrome; MRI, magnetic resonance imaging; NACT,
neoadjuvant chemotherapy; NFS, nephrogenic systemic fibrosis; NKI,
Netherlands Cancer Institute; pCR, Pathologic complete response; PSA,
Probabilistic sensitivity analysis; QALYs Quality-adjusted-life-years; R, Relapse; RFS,
Relapse free survival; RG-NACT, Response-guided neoadjuvant chemotherapy;
SA, Sensitivity analysis; Tp, Transition probabilities
Acknowledgements
The authors gratefully acknowledge Prof. dr. Sjoerd Rodenhuis for his clinical
insights, and Mirjam Franken and Dr. Ruud Pijnapple for assessing the
resource modelling assumptions.
Funding
This project is funded by the Center for Translational Molecular Medicine
(CTMM project Breast CARE, grant no.03O-104).
Availability of data and materials
All data generated or analysed during this study are included in this
published article [and its supplementary information files].
Authors’ contributions
AMC contributed to conception and design, data acquisition, data analysis,
data interpretation and manuscript writing. LMGS contributed to conception
and design, data analysis, data interpretation and manuscript writing. LSR
contributed to conception and design, data acquisition and manuscript
adaptations for important intellectual content. WVH contributed to
conception and design, data interpretation and manuscript writing. All
authors have read and approve of the final version of the manuscript.
Competing interests
Lotte MG Steuten has stock ownership in Panaxea, a health economics
consulting agency. Wim van Harten is a non-remunerated non-stock owner
member of the supervisory board of Agendia. The authors have no other
relevant affiliations or financial involvement with any organization or entity
with a financial interest in or financial conflict with the subject matter or
materials discussed in the manuscript apart from those disclosed.
Consent for publication
Not applicable.
Ethics approval and consent to participate
Not applicable.
Author details
1
Department of Psychosocial Research and Epidemiology, Netherlands
Cancer Institute, Plesmanlaan 121, Amsterdam 1066 CX, The Netherlands.
2
Hutchinson Institute for Cancer Outcomes Research, Fred Hutchinson
Cancer Research Center, 1100 Fairview Ave. N., P.O. Box 19024, Seattle, USA.
3
Department of Medical Oncology, The Netherlands Cancer Institute,
Plesmanlaan 121, Amsterdam 1066 CX, The Netherlands. 4Department of
Healthcare Technology and Services Research, University of Twente,
Drienerlolaan 5, 7522 NB Enschede, The Netherlands.
Received: 14 August 2015 Accepted: 29 July 2016
References
1. Mauri D, Pavlidis N, Ioannidis JPA. Neoadjuvant versus adjuvant systemic
treatment in breast cancer: a meta-analysis. J Natl Cancer Inst. 2005;97:188–94.
Miquel-Cases et al. BMC Cancer (2016) 16:712
2.
3.
4.
5.
6.
7.
8.
9.
10.
11.
12.
13.
14.
15.
16.
17.
18.
19.
20.
21.
22.
23.
24.
Gralow JR, Zujewski JA, Winer E. Preoperative therapy in invasive breast
cancer: reviewing the state of the science and exploring new research
directions. J Clin Oncol. 2008;26:696–7.
Yeh E, Slanetz P, Kopans DB, Rafferty E, Georgian-Smith D, Moy L, et al.
Prospective comparison of mammography, sonography, and MRI in patients
undergoing neoadjuvant chemotherapy for palpable breast cancer. AJR Am
J Roentgenol. 2005;184:868–77.
Shin HJ, Kim HH, Ahn JH, Kim S-B, Jung KH, Gong G, et al. Comparison of
mammography, sonography, MRI and clinical examination in patients with
locally advanced or inflammatory breast cancer who underwent
neoadjuvant chemotherapy. Br J Radiol. 2011;84:612–20.
Marinovich ML, Houssami N, Macaskill P, Sardanelli F, Irwig L, Mamounas EP,
et al. Meta-analysis of magnetic resonance imaging in detecting residual
breast cancer after neoadjuvant therapy. J Natl Cancer Inst. 2013;105:321–33.
Loo CE, Teertstra HJ, Rodenhuis S, van de Vijver MJ, Hannemann J, Muller
SH, et al. Dynamic contrast-enhanced MRI for prediction of breast cancer
response to neoadjuvant chemotherapy: initial results. AJR Am J
Roentgenol. 2008;191:1331–8.
Loo CE, Straver ME, Rodenhuis S, Muller SH, Wesseling J, Vrancken Peeters
M-JTFD, et al. Magnetic resonance imaging response monitoring of breast
cancer during neoadjuvant chemotherapy: relevance of breast cancer
subtype. J Clin Oncol. 2011;29:660–6.
von Minckwitz G, Untch M, Blohmer J-U, Costa SD, Eidtmann H, Fasching
PA, et al. Definition and impact of pathologic complete response on
prognosis after neoadjuvant chemotherapy in various intrinsic breast cancer
subtypes. J Clin Oncol. 2012;30:1796–804.
Untch M, Konecny GE, Paepke S, von Minckwitz G. Current and future role
of neoadjuvant therapy for breast cancer. Scotl: Breast Edinb; 2014.
Rigter LS, Loo CE, Linn SC, Sonke GS, van Werkhoven E, Lips EH, et al.
Neoadjuvant chemotherapy adaptation and serial MRI response monitoring
in ER-positive HER2-negative breast cancer. Br J Cancer. 2013;109:2965–72.
von Minckwitz G, Blohmer JU, Costa SD, Denkert C, Eidtmann H, Eiermann
W, et al. Response-guided neoadjuvant chemotherapy for breast cancer. J
Clin Oncol. 2013;31:3623–30.
Dakin H, Devlin N, Feng Y, Rice N, O’Neill P, Parkin D. The influence of costeffectiveness and other factors on NICE decisions. Health Econ. 2014;24.
Thokala P, Dixon S, Jahn B. Resource modelling: The missing piece of the
HTA Jigsaw? Pharmacoeconomics. 2014;33(3):193–203.
Husereau D, Drummond M, Petrou S, Carswell C, Moher D, Greenberg D,
et al. Consolidated Health Economic Evaluation Reporting Standards
(CHEERS)—explanation and elaboration: a report of the ISPOR Health
Economic Evaluation Publication Guidelines Good Reporting Practices Task
Force. Value Health. 2013;16:231–50.
OECD. Health at a Glance 2013, OECD indicators [Internet]. 2013. Available
from: />Medtronic. Pacemakers and MRI Trends [Internet]. [cited 2015 Jan 21].
Available from: />pacemakers_trends.html.
Coburn N, Przybysz R, Barbera L, Hodgson D, Sharir S, Laupacis A, et al. CT,
MRI and ultrasound scanning rates: Evaluation of cancer diagnosis, staging
and surveillance in ontario. J Surg Oncol. 2008;98:490–9.
Wernli KJ, DeMartini WB, Ichikawa L, Lehman CD, Onega T, Kerlikowske K,
et al. Patterns of Breast Magnetic Resonance Imaging Use in Community
Practice. JAMA Int Med. 2014;174:125.
Ries L, Eisner M, Kosary C. SEER cancer statistics review, 1973–1999.
Bethesda: National Cancer Institute; 2002.
Parise CA, Bauer KR, Brown MM, Caggiano V. Breast cancer subtypes as defined
by the estrogen receptor (ER), progesterone receptor (PR), and the human
epidermal growth factor receptor 2 (HER2) among women with invasive
breast cancer in California, 1999–2004. Breast J. 2009;15:593–602.
Early Breast Cancer Trialists’ Collaborative Group. Effects of chemotherapy
and hormonal therapy for early breast cancer on recurrence and 15-year
survival: an overview of the randomised trials. Lancet. 2005;365:1687–717.
National Cancer Institute. Common Terminology Criteria for Adverse Events
(CTCAE) v4.0. />applications/ctc.htm.
Swain SM, Whaley FS, Ewer MS. Congestive heart failure in patients treated with
doxorubicin: a retrospective analysis of three trials. Cancer. 2003;97:2869–79.
Lee KS, Ro J, Nam B-H, Lee ES, Kwon Y, Kwon HS, et al. A randomized
phase-III trial of docetaxel/capecitabine versus doxorubicin/
Page 16 of 17
25.
26.
27.
28.
29.
30.
31.
32.
33.
34.
35.
36.
37.
38.
39.
40.
41.
42.
43.
44.
45.
46.
47.
48.
49.
50.
cyclophosphamide as primary chemotherapy for patients with stage II/III
breast cancer. Breast Cancer Res Treat. 2008;109:481–9.
Smith, DeCillis A, Anderson S. National Surgical Adjuvant Breast and Bowel
Project Experience. Acute myeloid leukemia and myelodysplastic syndrome
after doxorubicin-cyclophosphamide adjuvant therapy for operable breast
cancer: the National Surgical Adjuvant Breast and Bowel Project Experience.
J Clin Oncol. 2003;21:1195–204.
Briggs, et al. Decision modelling for Health Economic Evaluation. Oxford:
Oxford University Press; 2006.
Tsuji W, Teramukai S, Ueno M, Toi M, Inamoto T. Prognostic factors for
survival after first recurrence in breast cancer: a retrospective analysis of 252
recurrent cases at a single institution. Breast Cancer. 2014;21:86–95.
Dutch National Center for Health Statistics [Internet]. />Statweb/.
Rinaldi P, Costantini M, Belli P, Giuliani M, Bufi E, Fubelli R, et al. Extramammary findings in breast MRI. Eur Radiol. 2011;21:2268–76.
Retèl VP, Joore MA, Knauer M, Linn SC, Hauptmann M, van Harten WH.
Cost-effectiveness of the 70-gene signature versus St. Gallen guidelines and
Adjuvant Online for early breast cancer. Eur J Cancer. 2010;46:1382–91.
Frederix G. Disease specific methods for economic evaluations of breast
cancer therapies [Internet]. University Utrecht; 2013. Available from: http://
dspace.library.uu.nl/handle/1874/276437.
Dutch Healthcare Authority. DBC product-finder for tariffs [Internet]. http://
dbc-zorgproducten-tarieven.nza.nl/nzaZpTarief/Welkom.aspx.
Wang G, Zhang Z, Ayala C, Wall HK, Fang J. Costs of heart failure-related
hospitalizations in patients aged 18 to 64 years. Am J Manag Care. 2010;16:
769–76.
Tina Shih Y-C, Xu Y, Elting LS. Costs of uncontrolled chemotherapy-induced
nausea and vomiting among working-age cancer patients receiving highly
or moderately emetogenic chemotherapy. Cancer. 2007;110:678–85.
Schilling MB, Parks C, Deeter RG. Costs and outcomes associated with
hospitalized cancer patients with neutropenic complications: A
retrospective study. Exp Ther Med. 2011;2:859–66.
Lidgren M, Wilking N, Jönsson B, Rehnberg C. Resource use and costs
associated with different states of breast cancer. Int J Technol Assess Health
Care. 2007;23:223–31.
XE currency Converter [Internet]. Available from: />OECD.Stat. OECD (2013) [Internet]. Available from: />index.aspx?queryid=22519#.
Lidgren M, Wilking N, Jönsson B, Rehnberg C. Health related quality of life
in different states of breast cancer. Qual Life Res Int J Qual Life Asp Treat
Care Rehab. 2007;16:1073–81.
Nafees B, Stafford M, Gavriel S, Bhalla S, Watkins J. Health state utilities for
non small cell lung cancer. Health Qual Life Outcomes. 2008;6:84.
Lloyd A, Nafees B, Narewska J, Dewilde S, Watkins J. Health state utilities for
metastatic breast cancer. Br J Cancer. 2006;95:683–90.
Ford E, Adams J, Graves N. Development of an economic model to assess
the cost-effectiveness of hawthorn extract as an adjunct treatment for heart
failure in Australia. BMJ Open. 2012;2(5):e001094.
Coco A. The Cost-Effectiveness of Expanded Testing for Primary HIV
Infection. Ann Fam Med. 2005;3:391–9.
Wertman R, Altun E, Martin DR, Mitchell DG, Leyendecker JR, O’Malley RB,
et al. Risk of nephrogenic systemic fibrosis: evaluation of gadolinium chelate
contrast agents at four American universities. Radiology. 2008;248:799–806.
Singer OC, Sitzer M, du Mesnil de Rochemont R, Neumann-Haefelin T.
Practical limitations of acute stroke MRI due to patient-related problems.
Neurology. 2004;62:1848–9.
Hand PJ, Wardlaw JM, Rowat AM, Haisma JA, Lindley RI, Dennis MS. Magnetic
resonance brain imaging in patients with acute stroke: feasibility and patient
related difficulties. J Neurol Neurosurg Psychiatry. 2005;76:1525–7.
Sølling C, Ashkanian M, Hjort N, Gyldensted C, Andersen G, Østergaard L.
Feasibility and logistics of MRI before thrombolytic treatment. Acta Neurol
Scand. 2009;120:143–9.
Dewey M. Claustrophobia preventing MR imaging of the breast. Radiology.
2010;256:328. author reply 328–9.
Coresh J, Astor BC, Greene T, Eknoyan G, Levey AS. Prevalence of chronic kidney
disease and decreased kidney function in the adult US population: Third National
Health and Nutrition Examination Survey. Am J Kidney Dis. 2003;41:1–12.
Schaap K, Christopher-De Vries Y, Slottje P, Kromhout H. Inventory of MRI
applications and workers exposed to MRI-related electromagnetic fields in
the Netherlands. Eur J Radiol. 2013;82:2279–85.
Miquel-Cases et al. BMC Cancer (2016) 16:712
Page 17 of 17
51. van Roijen LH, Tan SS, Brouwmans CAM. Handliding voor kosten
onderzoek’. Rotterdam: College voor zorgverzekeringen; 2010. 2010 - Guide
for research costs - Methods and standard cost prices for economic
evaluations in healthcare\commissioned by the Health Care Insurance
Board. [Internet]. [cited 2013 Sep 3]. Available from: about:home.
52. National Public Health Atlas. National Public Health Atlas [Internet]. [cited
2015 Jan 22]. Available from: />53. Radiological Society of the Netherlands RS of the N. Radiological Society of
the Netherlands [Internet]. [cited 2015 Feb 27]. Available from: https://www.
radiologen.nl/12/1402/kerngegevens/general-information-radiologicalsociety-of-the-netherlands.html.
54. iKNL (Integraal Kankercentrum Nederland). Nederlandse Kankerregistratie
[Internet]. Available from: />55. Barr R, Furlong W, Henwood J, Feeny D, Wegener J, Walker I, et al.
Economic evaluation of allogeneic bone marrow transplantation: a
rudimentary model to generate estimates for the timely formulation of
clinical policy. J Clin Oncol. 1996;14:1413–20.
56. Dutch National Health Care Institute. Medicijnkosten [Internet]. Available
from: />57. Lachaine J, Yelle L, Kaizer L, Dufour A, Hopkins S, Deuson R. Chemotherapyinduced emesis: quality of life and economic impact in the context of
current practice in Canada. Support Cancer Ther. 2005;2:181–7.
58. Powers A, Faria C, Broder MS, Chang E, Cherepanov D. Hematologic
complications, healthcare utilization, and costs in commercially insured
patients with myelodysplastic syndrome receiving supportive care. Am
Health Drug Benefits. 2012;5:455–65.
59. Uyl-de Groot CA, Gelderblom-den Hartog J, Huijgens PC, Willemze R, van
Ineveld BM. Costs of diagnosis, treatment, and follow up of patients with
acute myeloid leukemia in the netherlands. J Hematother Stem Cell Res.
2001;10:187–92.
Submit your next manuscript to BioMed Central
and we will help you at every step:
• We accept pre-submission inquiries
• Our selector tool helps you to find the most relevant journal
• We provide round the clock customer support
• Convenient online submission
• Thorough peer review
• Inclusion in PubMed and all major indexing services
• Maximum visibility for your research
Submit your manuscript at
www.biomedcentral.com/submit