Predicting clinical outcomes in chordoma patients receiving immunotherapy: A comparison between volumetric segmentation and RECIST
Bạn đang xem bản rút gọn của tài liệu. Xem và tải ngay bản đầy đủ của tài liệu tại đây (2.23 MB, 9 trang )
Fenerty et al. BMC Cancer (2016) 16:672
DOI 10.1186/s12885-016-2699-x
RESEARCH ARTICLE
Open Access
Predicting clinical outcomes in chordoma
patients receiving immunotherapy: a
comparison between volumetric
segmentation and RECIST
Kathleen E. Fenerty1, Les R. Folio2, Nicholas J. Patronas2, Jennifer L. Marté3, James L. Gulley3
and Christopher R. Heery1*
Abstract
Background: The Response Evaluation Criteria in Solid Tumors (RECIST) are the current standard for evaluating
disease progression or therapy response in patients with solid tumors. RECIST 1.1 calls for axial, longest-diameter
(or perpendicular short axis of lymph nodes) measurements of a maximum of five tumors, which limits clinicians’
ability to adequately measure disease burden, especially in patients with irregularly shaped tumors. This is especially
problematic in chordoma, a disease for which RECIST does not always adequately capture disease burden because
chordoma tumors are typically irregularly shaped and slow-growing. Furthermore, primary chordoma tumors tend
to be adjacent to vital structures in the skull or sacrum that, when compressed, lead to significant clinical
consequences.
Methods: Volumetric segmentation is a newer technology that allows tumor burden to be measured in three
dimensions on either MR or CT. Here, we compared the ability of RECIST measurements and tumor volumes to
predict clinical outcomes in a cohort of 21 chordoma patients receiving immunotherapy.
Results: There was a significant difference in radiologic time to progression Kaplan-Meier curves between clinical
outcome groups using volumetric segmentation (P = 0.012) but not RECIST (P = 0.38). In several cases, changes in
volume were earlier and more sensitive reflections of clinical status.
Conclusion: RECIST is a useful evaluation method when obvious changes are occurring in patients with chordoma.
However, in many cases, RECIST does not detect small changes, and volumetric assessment was capable of
detecting changes and predicting clinical outcome earlier than RECIST. Although this study was small and
retrospective, we believe our results warrant further research in this area.
Keywords: Chordoma, Volumetric, RECIST, Radiologic, Response criteria
Abbreviations: CT, Computed tomography; ECOG, European Cooperative Oncology Group; HR, Hazard ratio;
min, Minute; MR, Magnetic resonance; MVA, Modified vaccinia Ankara; PD, Progressive disease; RECIST, Response
evaluation criteria in solid tumors; sec, Seconds; SLD, Sum of the longest dimensions; T, Tesla; TRICOM, Triad of
costimulatory molecules; TSE, Turbo spin echo; TTP, Time to progression
* Correspondence:
1
Laboratory of Tumor Immunology and Biology, Center for Cancer Research,
National Cancer Institute, National Institutes of Health, 10 Center Drive, Room
13N208, Bethesda, MD 20892, USA
Full list of author information is available at the end of the article
© 2016 The Author(s). Open Access This article is distributed under the terms of the Creative Commons Attribution 4.0
International License ( which permits unrestricted use, distribution, and
reproduction in any medium, provided you give appropriate credit to the original author(s) and the source, provide a link to
the Creative Commons license, and indicate if changes were made. The Creative Commons Public Domain Dedication waiver
( applies to the data made available in this article, unless otherwise stated.
Fenerty et al. BMC Cancer (2016) 16:672
Background
The Response Evaluation Criteria in Solid Tumors
(RECIST) are the current standard for measuring treatment response in patients with malignant solid tumors
[1]. However, RECIST has many limitations. RECIST 1.1,
which calls for measurement of the longest diameter of
the tumor (or perpendicular short axis of malignant
lymph nodes), does not adequately represent the size of
nonspherical lesions, nor does it reflect anisotropic
changes in tumor size. Furthermore, it accounts for only
five tumors per patient, with a maximum of two tumors
per organ system.
The advent of advanced segmentation capabilities in
PACS (Picture Archiving Communications Systems) on
CT and MR has made volumetric segmentation an increasingly common alternative to RECIST. Segmentation
consists of object recognition and delineation for the
purpose of extracting quantitative information, such as
tumor volume [2] and density [3]. It has many advantages over one-dimensional RECIST measurements, including the capability to assess all measureable lesions
instead of just five lesions per patient. This has been
shown to decrease variance in assessment of tumor burden [4]. Volumes have also been shown to demonstrate
more consistency than linear measurements in phantoms
(specially designed objects that are scanned to evaluate
imaging technology) [5] and in retrospective studies [6]. It
is thought that volumes better reflect actual changes in
tumor size [7] and better reflect clinical outcomes [8].
Volumetric segmentation has also been shown to be reproducible, even in complex intracranial tumors [9].
Volumetric assessments may be particularly useful in
certain tumor types. Chordoma is a rare, slow-growing
neoplasm that arises from the remnants of the notochord. Many challenges are associated with chordoma
patient care and research. Because it is a rare disease, literature about chordoma is scarce. Although it is commonly assumed that chordoma does not metastasize
often, recent studies have indicated that it metastasizes
more than previously thought [10]. For this reason, clinicians may not look for metastases or may fail to identify
them because metastatic lesions can look like benign
cysts, particularly in the liver [10].
RECIST is especially inadequate for evaluating chordoma tumor burden because lesions are generally lobulated and heterogeneous. Furthermore, changes in tumor
size may not be readily detectable by RECIST because of
chordoma tumors’ typically slow growth; however, owing
to the proximity of these tumors to vital structures in
the sacrum and clivus, small changes in size have significant clinical consequences. The urgent need for improved
methods of assessing tumor burden in chordoma make
this disease a good candidate for a volumetric segmentation study.
Page 2 of 9
Methods
Patients
Our cohort consisted of 21 chordoma patients from two
ongoing National Cancer Institute Institutional Review
Board (IRB)–approved phase I clinical trials of therapeutic cancer vaccines. Eleven patients received the
yeast-brachyury vaccine GI-6301 (NCT01519817) [11].
Thirteen received MVA-brachyury-TRICOM vaccine
(NCT02179515), three of whom had previously received
the yeast-brachyury vaccine. CT and MR scans were acquired at baseline and during treatment, and patients
who went off trial continued to have follow-up scans.
Patients had 2–14 appointments at which imaging was
done (median, five). Although all patients had surgery
and/or radiation, these treatments were most often given
before the baseline scans. Volumetric segmentations
were done on subsequent scans up through the most recent scan available for each patient. One patient had to
be re-baselined after an ablation for the purpose of our
analysis. As a result, that case is used as two separate
data points (pre- and post-ablation) for radiologic time
to progression (TTP) analysis. Two patients were excluded for not having at least two time points with CT
and MR, and another patient was excluded because
symptoms recurred after stopping steroids to enroll on a
clinical trial. This resulted in three patients who were
not included in the Kaplan-Meier analysis and one patient who had two data sets, totaling 19 evaluations. The
two patients without follow-up scans were still included
in other analyses for the purpose of assessing resources
required for volumetric segmentation [12]. This research
was conducted on images collected during two clinical
trials, which were run in compliance with the Helsinki
Declaration and were approved by the Center for Cancer
Research, National Cancer Institute Institutional Review
Board.
Imaging
CT scans of the chest, abdomen, and pelvis were acquired at baseline (pretreatment) and at 8- to 12-week
intervals following treatment initiation using any of the
following scanners: Siemens Definition, Biograph, or
Flash (Siemens Healthcare USA, Malvern, PA), Toshiba
Aquilion ONE™ ViSION CT (Toshiba Medical Systems
Corp., Tochigi, Japan), or GE Lightspeed (GE Medical
Systems, Waukesha, WI).
Patients received contrast-enhanced CT scans using
0.6- to 2.5-mm collimation, 120 kVp, 150–240 reference
mAs (with dose modulation), and 0.25- to 0.75-sec rotation time. Images were pushed to our PACS as contiguous 5 × 5-mm and 2 × 1-mm overlap axial slices for
volumetric assessments and reformats (e.g., coronal).
Scans were obtained with patients coached to full inspiration, supine from chest to pelvis in one acquisition, and
Fenerty et al. BMC Cancer (2016) 16:672
with weight-based (2 mg/kg) i.v. contrast (Isovue 300 at
2 mL/sec) after a 70-sec delay.
One of the following scanners was used to obtain MR
scans: 3 Tesla (3 T) Verio (Siemens), 3 T Achieva TX
(Philips Healthcare, Andover, MA), 1.5 T Aera (Siemens), 3 T mMR (Siemens), or 1.5 T Achieva (Philips).
Patients received TSE T1 axial and coronal imaging,
TSE T2 axial and coronal imaging with fat suppression
(or STIR), and axial diffusion-weighted imaging with B
values of 0, 250, and 800. Apparent diffusion coefficient
maps were generated from the 0 and 800 B values. All
precontrasted images were acquired at a slice thickness
and imaging gap of 6 × 2 mm.
Prior to contrast administration, a precontrast 3D
Axial T1-weighted sequence (3-mm overlapping VIBE/
DIXON/or E-Thrive) was obtained in a breath-held fashion. Following injection of i.v. gadolinium-based contrast
(0.2 mL/kg, injected at 2 mL/s) (Magnevist®, Schering
AG, Berlin, Germany and MultiHance®, Bracco, Milan,
Italy), postcontrast images were obtained in identical
fashion as the precontrast 3D images. Image acquisition
time points were 20 sec, 70 sec, and a 3-min delay. All
data were automatically subtracted from the precontrast
acquisition. A final postcontrast 3D T1-weighted coronal
image (3-mm overlapping VIBE/DIXON/or E-Thrive)
was obtained at the conclusion of the MR examination.
RECIST measurement
Tumors were evaluated using RECIST 1.1 guidelines [1],
which call for one-dimensional, longest-diameter measurements in the axial plane. A maximum of five lesions
may be evaluated in each patient, with no more than
two per organ system.
Volumetric measurement
A neuroradiologist (NP) reviewed the MR sequences to
determine the best ones to use for segmentation. Postcontrast scans were not as useful as expected due to
prior radiation and surgical treatments; enhancement
was poor and tumors could not be differentiated from
adjacent structures. Fat-suppressed T2-weighted and
STIR sequences were deemed the most appropriate for
segmenting sacral and paraspinous tumors, whereas
post-contrast FLAIR sequences were used for clival lesions. Contrast-enhanced CT sequences were used to
segment all metastases.
A research assistant (KF) performed the segmentations
using the lesion management application within PACS
(Vue PACS v 12.0, Carestream Health, Rochester, NY) as
previously described [12]. In short, the proprietary software allows the user to identify the edges of the lesion
with a digital caliper-like tool and then, based on imaging characteristics, the software generates a proposed
border for the lesion across all cuts. To do this, the Vue
Page 3 of 9
PACS livewire segmentation tool applies a combination
of fast marching [13] and level set [14] algorithms together with shape interpolation for region growing. The
cost functions are based on image gradient strengths
and image intensity histograms in order to determine
the expansion limits. The user (KF) can then correct the
border with a correction tool. MR was used for segmenting primary tumors and CT for metastatic disease. Bone
metastases were not evaluable by volumetric segmentation. Tumors with long diameters < 0.5 cm were deemed
immeasurable due to the inherent variability created by
measuring very small lesions, similar to what is outlined
in RECIST 1.1. Masses were reviewed and deemed to be
measurable tumors based on clinical assessment and imaging characteristics; not all were biopsy-confirmed.
Radiologist review
A neuroradiologist with 30 years of experience (NP) validated volumetric segmentations of primary tumors, and
a body radiologist with 20 years of experience (LF) validated segmented metastatic tumors.
Comparison techniques/statistics
Using the following criteria, we divided patients into two
groups independent from radiologic analysis for TTP.
Patients were placed into either a good or a poor clinical
outcome group, based on the presence (poor) of ≥ 1, or
the absence (good) of all of the following clinical indicators: (1) increasing tumor-related pain requiring significant change in pain medications, (2) increasing neurologic
dysfunction, and/or (3) decreasing ECOG performance
status due to tumor-related symptoms [15]. The determination of clinical outcome was made retrospectively at least
six months after initial imaging studies.
For patients in each category, Kaplan-Meier curves
were used to calculate radiologic TTP by RECIST and by
volume (Fig. 1) using the log-rank test for equality of
survivor functions. A hazard ratio was also calculated
using the Cox proportional hazard regression. TTP by
RECIST was assessed using RECIST 1.1, with progressive disease (PD) being an increase of ≥ 20 % in the sum
of the longest diameters (SLD). TTP by volume was determined based on previously outlined criteria [16],
with PD being an increase of ≥ 40 %. TTP was assessed
based on date of enrollment to time of PD by RECIST
or volumetric criteria. Patient data were censored if PD
criteria were not met on the last imaging studies prior
to a local intervention on a target lesion or date of last
available imaging.
Results
Patient demographics
Our cohort was 85.7 % male (18/21 patients) and had a
median age of 60 (Table 1). Primary tumors were located
Fenerty et al. BMC Cancer (2016) 16:672
Page 4 of 9
Table 2 Number of follow-up appointments with ≥ 1 CT or 1
MR/patient
a
# of follow-ups
# of patients (%)
1–5
14 (66.7)
6–10
5 (23.8)
11–15
2 (9.5)
CT computed tomography, MR magnetic resonance
in the spine, sacrum, or clivus, and all patients had been
treated with surgery and/or radiation prior to baseline.
Although only 66.7 % of patients (14/21) were diagnosed
with metastatic disease at baseline, retrospective analysis
identified two additional patients with small metastases
at baseline.
Most patients had 1–5 follow-up appointments (Table 2),
although some had more, and two were excluded from our
analysis for not having at least one follow-up CT and one
follow-up MR that could be analyzed.
A retrospective analysis found that 76.2 % of patients
(16/21) had metastatic disease distributed throughout
the lung, liver, lymph nodes, subcutaneous tissue, and
other soft tissue (Table 3).
b
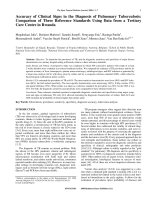
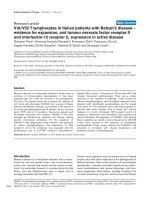
Analysis of TTP
Fig. 1 Volumetric assessment was superior to RECIST at predicting
clinical status in this cohort. a Time to radiologic progression by
volume. Actuarial median for good clinical outcome = 271 days;
median for poor outcome = 156 days; P = 0.012; HR for good vs.
poor clinical status = 0.21, P = 0.023. b Time to radiologic progression
by RECIST. Actuarial median for good clinical outcome = 271 days;
median for poor outcome = 167 days; P = 0.37; HR for good vs. poor
clinical status = 0.52, P = 0.38
Table 1 Patient demographics
Age range (median)
32–82 (60)
Gender
# (%)
Male
18 (85.7)
Female
3 (14.3)
Patients in the good clinical outcome group (no poor clinical indicators, n = 12) appeared to have a longer TTP by
volumetric assessment (P = 0.012, HR 0.21, P = 0.02)
than patients in the poor clinical outcome group (≥1 poor
clinical indicators; n = 7). However, there was no difference between the two groups by RECIST TTP analysis
(P = 0.37, HR 0.52, P = 0.38).
Case studies
Due to small sample size and extensive variability within
our patient population, we found it useful to analyze a
few case studies that exemplified instances in which
volumetric assessment was useful and necessary, as well
Table 3 Distribution of metastases at baseline and most recent
follow-up
Location of metastases
# of patients (%)a
at baseline
# of patients (%)a at
most recent follow-up
20 (95.2)
Lung
9 (56.3)
10 (62.5)
20 (95.2)
Liver
9 (56.3)
9 (56.3)
# (%)
Lymph nodes
2 (12.5)
5 (31.3)
Lumbar/sacral spine
14 (66.7)
Subcutaneous
4 (25.0)
4 (25.0)
Clivus
6 (28.6)
Other soft tissue
5 (31.3)
6 (37.5)
1 (4.8)
Total # of patients
with metastases
16 (100.0)
16 (100.0)
Prior treatment
Surgery
Radiation
Primary tumor
Cervical spine
Metastatic disease at baseline
# (%)
# (%)
Yes
14 (66.7)
No
7 (33.3)
a
Percentages based on 16 patients found to have metastases. Eleven patients
(68.8 %) had bone metastases, which were not evaluable by volumetric
segmentation. Values were obtained by retrospective analysis; thus two
patients with unnoticeable metastatic disease at baseline are included
Fenerty et al. BMC Cancer (2016) 16:672
as instances in which RECIST provided sufficient information about tumor burden.
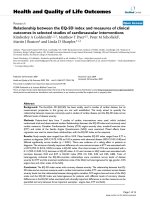
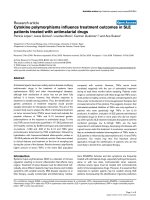
Case 1
For patients who did very well or very poorly clinically,
RECIST was often sufficient to illustrate the extent of
their disease, while volumes provided little additional information. For one patient with recurrent pelvic masses
who had done well clinically for over 2 years, RECIST
indicated a partial response (–43.9 %) and volume indicated a minor response (–59.9 %). On July 8, 2013, the
RECIST measurement for the patient’s primary lesion
was 6.0 cm and its volume was 39.8 cm3. By January 6,
Page 5 of 9
2015, the lesion measured 5.2 cm by RECIST and 14.1 cm3
by volume (Fig. 2). In cases where progression or response
is less apparent, volumes may be superior to RECIST in
predicting clinical outcome (see cases 2 to 4 below).
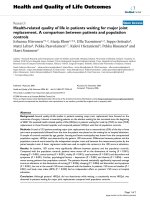
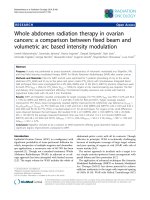
Case 2
One patient had severe pain that increased while on treatment and became difficult to manage by the restaging visit
at 12 weeks. Based on that rapid progression of symptoms,
the patient was retrospectively classified in the poor clinical outcome group. Axial measurement of the longest
diameter of the presacral/pelvic tumor mass demonstrated
growth that did not meet progression criteria (RECIST
Fig. 2 a Patient with a pelvic mass for whom RECIST is an adequate measure of tumor burden, and volumetric measurement provides little additional
information. At the most recent follow-up appointment, RECIST indicated a partial response (–43.9 %) and volume indicated a minor response
(–59.9 %). b Volumetric measurement of the patient’s primary lesion. c Six months later, the tumor had shrunk by both RECIST and volume
Fenerty et al. BMC Cancer (2016) 16:672
+17.2 %). However, the symptoms were consistent with
significant tumor growth, which was observed volumetrically (+139 %), with the most notable growth in the cranialcaudal axis (Fig. 3).
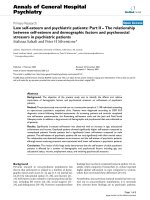
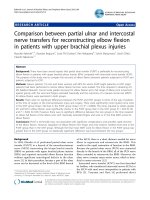
Case 3
In other patients, volume indicated PD earlier than
RECIST. In one patient with metastatic disease to the
liver and lungs, PD was identified at the 28-week followup by volume (+71.4 %), but not until the 36-week
follow-up by RECIST (+23.9 %) (Fig. 4). In cases such as
these, using total tumor volume as a metric of disease
progression would allow patients to consider alternative
therapies earlier.
Case 4
It can be difficult to determine the projected clinical
course for a patient with chordoma for whom RECIST
indicates almost no change over extended periods of
time. For one patient with clival chordoma, RECIST
showed an increase of 5 %, whereas volume indicated a
decrease of 32.4 %. On July 9, 2013, the patient’s primary
lesion measured 2.1 cm by RECIST and 10.6 cm3 by volume. By May 26, 2015, the lesion still measured 2.1 cm
by RECIST but only 7.1 cm3 by volume (Fig. 5). The
Page 6 of 9
patient is doing well clinically, with subjective improvements in headaches related to the tumor mass.
Discussion
Because our clinical experience indicated changes in symptoms prior to radiologic progression by RECIST, we sought
to identify a tool that would give us an earlier insight into
the trajectory of a given patient’s tumor. We noted a recurring pattern of tumor growth in imaged sections of tumors
that were not those with the longest dimension. This finding led to the hypothesis that the total tumor volume may
be changing despite lack of obvious change in the longest
dimension, as measured by RECIST. Volumetric assessment of tumors has previously been difficult to perform.
Radiation oncologists have used planning software to assess volume with promising results [17], but we wanted to
determine if measuring volume could be more widely instituted. Recent improvements in imaging software have
allowed for semi-automated assessment of total tumor volume. Volume assessment is still labor-intensive, but that
limitation appears to be improving rapidly.
Conclusions
In this hypothesis-generating study, we demonstrated
the feasibility of using volumetric assessments and their
Fig. 3 a Patient with a large presacral/pelvic mass had progressed by volume at 12-week follow-up (+139 %) but not by RECIST (+17.2 %). b 3D
rendering of the patient’s lesion at baseline better illustrates tumor size and shape. c Three months later, the tumor had undergone drastic
anisotropic growth not detectable by RECIST
Fenerty et al. BMC Cancer (2016) 16:672
Page 7 of 9
Fig. 4 A case of metastatic disease to the liver and lungs in which volume indicated progressive disease earlier than RECIST. a PD was identified
at 28-week follow-up by volume (+71.4 %), but not until 36-week follow-up by RECIST (+23.9 %). b A 3D rendering of this patient's tumors demonstrates the potential importance of measuring total tumor volume to determine treatment effect
Fig. 5 Patient with clival chordoma who seems to be experiencing clinical benefit from treatment. a At the most recent follow-up, volume is
trending toward improvement (–32.4 %), whereas RECIST measurements have barely changed (+5.0 %). b The patient’s primary lesion. c Twenty-two
months later, the patient’s RECIST measurement had not changed. The tumor was smaller by volume but had not yet reached a partial response by
volumetric criteria
Fenerty et al. BMC Cancer (2016) 16:672
potential impact on clinical decision-making. There were
clear limitations to this study. First, we retrospectively
applied a new, nonvalidated definition for clinical outcomes to a retrospective data set. Second, in this relatively small data set there was significant heterogeneity
of tumor locations (sacral vs. spine vs. clival vs. metastatic disease). Third, the accuracy of measurements varied among our various imaging techniques. And finally,
we used a 40 % cut-off for progression using volumetric
assessment, which is not validated and was created
based on different methods than we used in this study.
These limitations preclude drawing definitive conclusions from the results. The use of clinical criteria retrospectively is perilous due to the possibility of bias
influencing the outcomes. However, the clinical outcome
groups were determined prior to the volumetric assessment and comparison to RECIST, limiting this concern.
The heterogeneity of tumor locations is a major reason
for the need to identify better imaging methods for chordoma and represents the nature of research in this rare
disease. The potential variability between scans is an
issue present in both RECIST measurement [18] and
volumetric measurement, but is likely to be more pronounced on a single cut than over many cuts encompassing the entire tumor mass. Our choice of a cut-off
for significant change by volume is based on a study
evaluating volume by different methods, but we believe
the rationale for this choice remains reasonable. Despite
these weaknesses, the data presented here support the
hypothesis that volumetric assessment may be a more
sensitive tool for measuring early tumor progression in
chordoma and suggest that further exploration of this
method is worthwhile. For cases in which RECIST measurement demonstrates growth or regression, volumetric
assessment is probably unnecessary and unlikely to have
a significant impact. Volumetric assessment appears to
be most useful in cases where RECIST can detect no discernable change in tumor size.
In chordoma management, small changes in tumor
size may have significant clinical impacts due to the anatomic location of lesions. Cases 2, 3, and 4 presented
here illustrate situations in which small changes in
RECIST measurement may belie more significant growth
in other dimensions. Patients were retrospectively
grouped into good or poor clinical outcome categories
based on relatively simple criteria. When we compared
TTP in these groups by RECIST, we found no differences (P = 0.37, HR 0.52, P = 0.38). However, when we
compared TTP by volumetric measurement, there was a
clear separation of the curves (P = 0.012, HR 0.21, P = 0.02).
While not definitive, these preliminary findings support our
hypothesis that volumetric tumor assessment is a more sensitive tool for evaluating tumor growth in chordoma, and
may be useful for predicting clinical outcomes in patients
Page 8 of 9
for whom RECIST demonstrates no change. Based on these
findings, we suggest that clinical trials in chordoma should
employ volumetric tumor assessment to determine the
feasibility of real-time measurement and the potential impact on prospective clinical decisions.
Acknowledgements
This work was supported by funding from the Intramural Research Program
of the Center for Cancer Research (CCR), National Cancer Institute (NCI),
National Institutes of Health. The authors thank Jeffrey Schlom, Ph.D.,
Laboratory of Tumor Immunology and Biology (LTIB), CCR, NCI, for resource
support; Seth Steinberg, Ph.D., Biostatistics and Data Management Section,
NCI, for statistical review; and Bonnie L. Casey, LTIB, NCI, for editorial assistance.
Funding
This research was supported by the Intramural Research Program of the Center
for Cancer Research, National Cancer Institute, National Institutes of Health.
Availability of data and materials
The datasets analyzed during the current study are available from the
corresponding author on reasonable request.
Authors’ contributions
CH oversaw study design. KF, LF, NP, and CH conducted volume
assessments. JM, KF, and CH were involved in data management and
statistical analysis. CH and JG were involved in patient enrollment and
management. All authors have read and approved the manuscript.
Competing interests
Dr. Folio is a co-investigator on a research agreement with Carestream
Health. The other authors declare no competing interests.
Consent for publication
Not applicable.
Ethics approval and consent to participate
All patient data used in this analysis came from patients enrolled on two
phase I clinical trials, which were reviewed by the Center for Cancer
Research (CCR), National Cancer Institute (NCI) Institutional Review Board
(IRB). Imaging data analysis was performed on data from two clinical trials.
All patients were informed of the risks and benefits of trial participation and
the potential for use of clinical data for further research.
All patients reviewed and signed informed consent, approved by the IRB of
the CCR/NCI, after having all questions answered.
Author details
1
Laboratory of Tumor Immunology and Biology, Center for Cancer Research,
National Cancer Institute, National Institutes of Health, 10 Center Drive, Room
13N208, Bethesda, MD 20892, USA. 2Cancer Imaging Program, Division of
Cancer Treatment and Diagnosis, National Cancer Institute, National Institutes
of Health, Bethesda, MD, USA. 3Genitourinary Malignancies Branch, National
Cancer Institute, National Institutes of Health, Bethesda, MD, USA.
Received: 28 October 2015 Accepted: 9 August 2016
References
1. Eisenhauer EA, Therasse P, Bogaerts J, Schwartz LH, Sargent D, Ford R,
Dancey J, Arbuck S, Gwyther S, Mooney M, et al. New response evaluation
criteria in solid tumours: revised RECIST guideline (version 1.1). Eur J Cancer.
2009;45(2):228–47.
2. Mansoor A, Bagci U, Foster B, Xu Z, Papadakis GZ, Folio LR, Udupa JK,
Mollura DJ. Segmentation and Image Analysis of Abnormal Lungs at CT:
Current Approaches, Challenges, and Future Trends. Radiographics. 2015;
35(4):1056–76.
3. Folio LR, Turkbey EB, Steinberg SM, Apolo AB. Viable tumor volume: Volume
of interest within segmented metastatic lesions, a pilot study of proposed
computed tomography response criteria for urothelial cancer. Eur J Radiol.
2015;84(9):1708–14.
Fenerty et al. BMC Cancer (2016) 16:672
4.
5.
6.
7.
8.
9.
10.
11.
12.
13.
14.
15.
16.
17.
18.
Page 9 of 9
Schwartz LH, Mazumdar M, Brown W, Smith A, Panicek DM. Variability in
response assessment in solid tumors: effect of number of lesions chosen for
measurement. Clin Cancer Res. 2003;9(12):4318–23.
Huang J, Sandouk A, Folio LR. Accuracy of volumes in a phantom serial
CT imaging. Radiological Society of North America Annual Meeting,
Chicago, IL. 2012.
Folio LR, Sandouk A, Huang J, Solomon JM, Apolo AB. Consistency and
efficiency of CT analysis of metastatic disease: semiautomated lesion
management application within a PACS. AJR Am J Roentgenol.
2013;201(3):618–25.
Bornemann L, Kuhnigk JM, Dicken V, Zidowitz S, Kuemmerlen B, Krass S,
Peitgen HO, Wein BB, Schubert H, Shin HO, et al. Informatics in radiology
(infoRAD): new tools for computer assistance in thoracic CT part 2. Therapy
monitoring of pulmonary metastases. Radiographics. 2005;25(3):841–8.
Bradley JD, Ieumwananonthachai N, Purdy JA, Wasserman TH, Lockett MA,
Graham MV, Perez CA. Gross tumor volume, critical prognostic factor in
patients treated with three-dimensional conformal radiation therapy for
non-small-cell lung carcinoma. Int J Radiat Oncol Biol Phys. 2002;52(1):49–57.
Solomon J, Warren K, Dombi E, Patronas N, Widemann B. Automated
detection and volume measurement of plexiform neurofibromas in
neurofibromatosis 1 using magnetic resonance imaging. Comput Med
Imaging Graph. 2004;28(5):257–65.
Kishimoto R, Omatsu T, Hasegawa A, Imai R, Kandatsu S, Kamada T. Imaging
characteristics of metastatic chordoma. Jpn J Radiol. 2012;30(6):509–16.
Miettinen M, Wang Z, Lasota J, Heery C, Schlom J, Palena C. Nuclear
Brachyury Expression Is Consistent in Chordoma, Common in Germ Cell
Tumors and Small Cell Carcinomas, and Rare in Other Carcinomas and
Sarcomas: An Immunohistochemical Study of 5229 Cases. Am J Surg Pathol.
2015;39(10):1305–12.
Fenerty KE, Patronas NJ, Heery CR, Gulley JL, Folio LR: Resources Required
for Semi-Automatic Volumetric Measurements in Metastatic Chordoma: Is
Potentially Improved Tumor Burden Assessment Worth the Time Burden?
J Digit Imaging. 2015 Nov 23 [Epub ahead of print]
Sethian JA. A fast marching level set method for monotonically advancing
fronts. Proc Natl Acad Sci U S A. 1996;93(4):1591–5.
Osher S, Sethian JA. Fronts propagating with curvature-dependent speed:
Algorithms based on Hamilton–Jacobi formulations. J Comput Phys.
1988;79:12–49.
Oken MM, Creech RH, Tormey DC, Horton J, Davis TE, McFadden ET,
Carbone PP. Toxicity and response criteria of the Eastern Cooperative
Oncology Group. Am J Clin Oncol. 1982;5(6):649–55.
Shah GD, Kesari S, Xu R, Batchelor TT, O’Neill AM, Hochberg FH, Levy B,
Bradshaw J, Wen PY. Comparison of linear and volumetric criteria in
assessing tumor response in adult high-grade gliomas. Neuro Oncol.
2006;8(1):38–46.
Kabolizadeh P, Chen Y, Liebsch N, Hornicek F, Schwab J, Choy E, Rosenthal
D, DeLaney T. Analysis of tumor response in mobile spine and sacral
chordoma treated with definitive high dose photon/proton radiation
therapy. Int J Radiat Oncol Biol Phys. 2015;93(3):E636–7.
Luft AR, Skalej M, Welte D, Kolb R, Klose U. Reliability and exactness of MRIbased volumetry: a phantom study. J Magn Reson Imaging. 1996;6(4):700–4.
Submit your next manuscript to BioMed Central
and we will help you at every step:
• We accept pre-submission inquiries
• Our selector tool helps you to find the most relevant journal
• We provide round the clock customer support
• Convenient online submission
• Thorough peer review
• Inclusion in PubMed and all major indexing services
• Maximum visibility for your research
Submit your manuscript at
www.biomedcentral.com/submit