A study on the effect of environmental conditions on the data quality of scanned images collected from the 3D human body light scanners
Bạn đang xem bản rút gọn của tài liệu. Xem và tải ngay bản đầy đủ của tài liệu tại đây (512.27 KB, 7 trang )
Journal of Science & Technology 143 (2020) 061-067
A Study on the Effect of Environmental Conditions on the Data Quality of
Scanned Images Collected from the 3D Human Body Light Scanners
Nguyen Thi Nhung1,2, Nguyen Thi Diem1, Phan Thanh Thao1*
1
Hanoi University of Science and Technology – No. 1, Dai Co Viet Str., Hai Ba Trung, Hanoi, Vietnam
2
Hung Yen University of Technical Education – Dan Tien, Khoai Chau, Hung Yen, Vietnam
Received: October 25, 2017; Accepted: June 22, 2020
Abstract
This article presents the results of the study on the influence of environmental conditions on the quality of
human body scan images collected from 3D scanners using structured light with impact factors including: the
scanning distance, backdrop color and environmental light intensity. In this paper, we used Meshlab software
for image grading. We also used grayscale value of Histogram diagram and the number of 3D scanned pixels
which are determined to evaluate the data quality collected from the 3D human body light scanners. In addition,
the study used Design Expert 6.0 software for analyzing collected data and checked the effect of those factors.
The experimental results are given to clarify the effect of considered factors.
Keywords: Environmental conditions, structure light, 3D scanners, the quality of 3D graphics.
the optimum conditions for 3D scanning with scanners
we have built.
1. Introduction
Nowadays*in the world there are many types of
3D scanners using light of different structures. 3D
body scanning equipment has also been developed by
many companies such as: [TC]2 Cyberware, Human
Solutions, TELMAT, Hamamatsu, Wicks and Wilson,
BodyskannerTM...etc. Although these machines have
been accepted in the industry, they still have
disadvantage of high cost that has limited the demand.
Besides, shooting conditions and setting data
processing system are complicated. Therefore, the
design and manufacture of a low-cost device that still
ensures the required measurement is essential in
current conditions. In published research [1], we have
studied the method of 3D measuring application with
light code structure gray to measure the human body
and establish some calculation scanning the human
body with the length x wide = 2.2m x 1m. This
instrument provides the surface data of the sample,
which can then determine the shape and size of the
human body. However, to obtain accurate and proper
scan data, the factors such as the equipment, the
measuring environment, the position of the object
during measurement have a great influence. In this
paper, we present the results of the study on the
influence of environmental conditions on the quality of
human body scan images collected from 3D scanners
using structured light with impact factors including:
the scanning distance, backdrop color and
environmental light intensity As a result, we determine
In the world and in Vietnam there have been
some studies on this issue.
Study the effect of scanning distance on the
quality of 3D images of the human body: Scan distance
is defined as the distance calculated from the scanner
to scan objects. For each type of scanner, scanning
field and scan object, it is necessary to determine the
optimum scanning distances to ensure the best quality
of the scanned images. In 2012, The author Jing Tong
along with his colleagues [2] designed the Microsoft
Kinect scanner with an optimal scanning distance of
100cm. By 2015, the KScan3D 3D scanning engine
using the built-in light beam with the optimal scanning
Distance was introduced and defined as invalid source
specified.
Research on the effects of light intensity of
ambient light: The intensity of illumination is the
specific characteristic of the surface being illuminated
on the surface of the light intensity sensed. Unit of
measure is Lux (lx). This is also an important
influencing factor on the quality of scanning image. In
2007, influential study by Sophie Voisin, Sebti
Foufou, Frédéric Truchetet, David Page, and Mongi
Abidi [3] Concluded that: Ambient light has a strong
influence on the accuracy of the wavelength range
from the light of the structure. In 2013, Mohit Gupta,
Qi Yin, Shree K. Nayar [4] studied static outdoor
scanning using three Scan-only and Concentrate-and-
*
Corresponding author: Tel: (+84) 919785668
Email:
61
Journal of Science & Technology 143 (2020) 061-067
Scan scans, Spread-and-Avergare. The results show
that the too bright or too dark ambient light produce
poor image quality. The results also indicate that the
Concentrate-and-Scan method produces the best
results at the same time. In 2015, Nguyen Thi Ngoc
Quyen [5] presented the optimum environmental light
conditions with 2D indirect measuring system ≥
300lux
light intensity variation between 300-400lux, the
distance variation from 80 to 100cm, experiment with
two background colors: black and blue.
Specification of light intensity, temperature and
humidity: Extech (Taiwan) is shown in Table 1.
Table 1. Specifications of the device measuring the
intensity of light
Research on the effects of background color: The
backdrop is the term "background", attached to our
actual example, the backdrop is the background behind
the scanning object after scanning. With 3D scanning
devices using light, the colors of the backdrop also
have an important effect on the quality of scanning
image. In 2000, new study by the creative team Adrian
Hilton, Daniel Beresford, Thomas Gentils, Raymond
Smith, Wei Sun and John Illingworth [6] was able to
automatically reconstruct 3D models using blue
backdrops. In 2012, the group of authors R.E. Sims, R.
Marshall, D.E. Gyi, S.J. Summerskill, K. Cas [7]
studied 3D TC2 human body scanners using white
light and came to the conclusion that the optimal
background color is black. In 2013, the study of
underwater 3D scanners indicated that the darker
surfaces (brown, gray and black) were of better quality
than those of light-colored surfaces [8]. In 2015, the
team of authors Dinu Dragan, Srdan Mihic, Zoran
Anisic, Ivan Lukovic studied decay after obtaining a
cloud image without affecting the backdrop. In
addition, some factors also have a very important
influence on the quality of 3D human body scan
images such as outdoor natural light, room light,
temperature, humidity, standing posture. The
appearance, color and texture of the object of the scan
[9], etc. In the study presented in this paper, the authors
focus on the influence of some elements of the lip
scanning field such as backdrop color, scanning
distance and illumination intensity of the light source
in the indoor environment measurement. When using
a 3d-scanner with structural light produced by the
group of authors under conditions in Vietnam.
Light intensity
measuring device
Extech
Wind speed
Scale
Resolution
Accuracy
Flow
Scale
Resolution
Light
Scale
Resolution
Accuracy
Humidity
Scale
Resolution
Accuracy
Temperature
Scale
Resolution
Accuracy
0,4 – 30 m/s
0,1 m/s
± 3% FS
0.01 - 1,908,400CFM
(0.001 - 54,000 CMM)
0.001 CFM (CMM)
0 - 1860Fc (0 - 20,000Lux)
0.1Fc (1Lux)
± (5% rdg + 8 digits)
10 - 95%RH
0.1%RH
±4%RH of rdg
32 to 122°F (0 đến 50°C)
0.1°
±2.5°F (1.2°C)
2.2. Research Methods
2.2.1. Determining the assessment criteria of 3D
human body scan image quality
3D-scanned image data obtained by non-contact
metering using structured light is a pixel cloud image.
After the scanning process, in order to be able to
exploit the data for research purposes and practical
applications, the data needs to be further processed by
image processing such as: measurement and
calculation of human body size, 3D surface modeling,
etc. To make the 3D image data good enough after
scanning for subsequent image processing phases, 3D
image scanned must meet the quality requirements as
follows: [10]
2. Experimental research
2.1. Research subjects
Subjects of the research include women aged
18÷23 years and height from 1.5m to 1.7m.
Experimental equipment: Using the 3D body
scanner, the principle of structural light by Nguyen Thi
Nhung and the designing team [1]. The device uses
structural light with the principle of triangular
measurement, gray encoding method, Optoma X321
projector, Camera Basec ace GigE, measuring
chamber size 1.5 × 2.5m, measuring conditions with
temperature of 25 ± 2 ° C, the humidity 65 ± 5%, the
a) 3D brightness rating criteria:
3D images obtained are required to ensure the
brightness, they must not glare, and they are not too
dark or too bright, the borders of the image must be
clear, not blurry, glare. In the study, we assessed the
62
Journal of Science & Technology 143 (2020) 061-067
brightness requirement of the image according to the
following criteria: The brightness in the scanning room
must ensure brightness in accordance with TCVN
71141: 2008. in the ImageJ software to evaluate the
grayscale value of the pixels. The brightness of the
pixels is not too dark or too bright, and the gray-scale
values of pixels need to reach a midtone of 64 to 192
[10].
dressed clothing. Therefore, we choose the
measurement conditions in the measurement room
with the source of light as artificial lighting. Based on
Vietnamese standard 7114 - 2008 on the recommended
light intensity, we provide reasonable laboratory
conditions with a temperature of 25 ± 2 ° C, a standard
moisture content of 65 ± 5% and the light intensity of
the environment 300-400lux, using fluorescent lamps
to provide light in the room.
Determine the background measurement
conditions: Through the previous researches we found
that the two most used background colors are black and
blue. In this study, we used both background colors,
conducted some experiments to select the optimal
background color with the fabrication equipment.
Fig 1. Diagram Histogram
These gray levels range from black to white with
very smooth jumps, typically 256 different levels by
standard. Since the human eye can only clearly
distinguish itself from about 200 different gray levels,
it is entirely possible to observe the continuous change
of gray levels as shown in Fig 1.
2.2.3.
Research,
experimental
experimental data processing
design
and
Using the method of experimental planning
orthogonal two elements to design the experiment,
handling and constructing regression experiment to
study the effects of simultaneous two-factor
environmental conditions measurement on quality of
the scan image [12].
b) Image Resolution Criteria:
3D scanned images obtained must be clear, not
interfered by factors such as costume, hair ... At the
same time to process the image on specialized software
conveniently, with high speed and decreased storage
capacity, in the study, we evaluated the resolution of
the image according to the criteria: pixel density
measured on image analysis software. Research results
show that [11], to evaluate the scanned image quality,
it is necessary to compare the actual number of
scanned pixels with the theoretical pixel count. If the
actual number of pixels of the image scanned is lower
than the number of theoretical pixels scans will not be
satisfied. With the same image area, the larger the
number of pixels, the better the image quality. The
pixel density in an image is used to evaluate the quality
of the pixels and thus to represent the resolution of the
image. The higher the resolution, the more information
the image contains.
Number of samples to be tested: use level 2
orthogonal planning for 2 influencing factors. Number
of experiments: N = 2k + n0 + 2k = 22 + 2 + 2x2 =
10 experiments [4]. Each test sample measures 3 times.
Total sample 10 x 3 = 30 samples. Of these, 2k is the
number of experiments around the center, calculated
as α = ± 1.41. The variability of the experimental
elements and the experimental matrices is shown in
Tables 2 and 3.
A method of optimizing a target based on the
expected function method (group of analytical
methods) was investigated by Harrington (1965),
Gatza-Millan (1972) and Derringer and Suich (1980)
study [13].
Design Expert 6.0 is used to process empirical
data and visually display research results based on
Harrington's orthogonal planning and one or multiple
optimization algorithms.
2.2.2. Research establishes measurement conditions
In parallel with our work on the 3D body scanner
of structural light users, the authors [1] have calculated
the scanning distance theory when the selected optical
system is 93.3cm. This is the average of our research.
The change in the value of scanning distance depends
greatly on the height of the scan object, so to ensure
the generality and accuracy of the experiment, we
select the variation of the scanning distance value. 80
- 100cm.
In Table 3, Y is the average gray level calculated
after the price change of two factors X1 and X2
Table 2. Variable ranges (real variables and coding
variables) of the research elements
NB
Determining conditions for measuring the light
intensity of the environment: In the study by Mohit
Gupta, Qi Yin, Shree K.Nayar [10], we found that the
measurement using the outdoors natural light is not
suitable for human subjects with specific or non-
1
2
Inside:
63
Factors
Xj
X1 (cm)
X2 (Lux)
Encryption value
1,41
75
280
-1
0
+1
+1,41
80
300
90
350
100
400
105
420
X1 – Distance scanning (cm)
Journal of Science & Technology 143 (2020) 061-067
X2 – Light intensity (Lux
Fig. 4. Calculate the gray value on software ImageJ
Table 3. Experiment 2 matrix elements
No.
1
2
3
4
5
6
7
8
9
10
Encoding
variable
x1
x2
-1
-1
+1
-1
-1
+1
+1
+1
-1,41
0
+1,41
0
0
-1,41
0
+1,41
0
0
0
0
Real variable
X1
80
100
80
100
75
105
90
90
90
90
X2
300
300
400
400
350
350
280
420
350
350
ImageJ software and Histogram diagram are used
to evaluate the quality of human scan image data as
illustrated in Figure 4. After a complete scan of the
image data, what we need to do is to evaluate the
quality of scanned images. The visualization method
may not be perfect when it comes to prove, as
measured by the ImageJoy software, to give you the
most specific rating.
Y
178.5
195.9
185.8
202.2
244.9
179.6
152.2
209.1
169.4
168.2
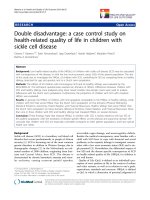
2.3. Research results and discussion
2.3.1. Result of the selection of the background color
of blood
The visual assessment and digitalization of the
number of pixels obtained by data collection of the
gray scale image scanning the body of a female student
are shown in Figures 5a, 5b, 6 and 7.
Meslab software is used to process and transcribe
images (illustrated in Figures 2 and 3). Photographs
obtained will be subject to interference due to
environmental effects and measurement conditions.
On the other hand, the scanner area of the scanner is
not large, so it is necessary to divide the scan object
into parts then multiply it. Therefore, a software to
support editing is needed to have the most completely
scanned image data. However, only the noise can be
removed, the image is not allowed to change the
structure, shape and size of the image.
a/
b/
Fig. 5. Left chest scan image
a/ Blue background; b/ Black background
Method 2 - Judging by the number of pixels
obtained by gray scale.
Fig 2. Noise interference on the Meslab software
Fig. 6. Left chest scan image and gray level value chart
for green background.
Fig 3. Manipulating images on the Meslab software.
Fig. 7. Scanning of left chest and gray level chart for
black background.
Reviews: Rating by grayscale chart histogram
Invalid source specified. The brightness of the image
should not be too dark or too bright, but it should reach
the mean (≈ 100-150).
By comparing the value of two graphs seen: With
a blue background, the value is dark (<100), With
64
Journal of Science & Technology 143 (2020) 061-067
black background, this value is very low. Therefore,
there are more obtained points and these points are
clearer. Results: Select black background.
2.3.2. The results of constructing the experimental
regression equation were used to study the
simultaneous effects of two environmental conditions
on 3D image quality.
Fig. 11. Point cloud image and grayscale-scale graph.
Distance 100cm, light intensity 400lux.
The results of the gray-scale Y values of the 10
experimental designs in the experimental matrix
investigating the simultaneous influence of two
environmental conditions on 3D image quality are
presented in Table 2. The illustrations of the grayscale
distribution charts of each experimental design are
shown in Figures 8 to 17.
Experiment 5: Sweep 75cm; light intensity 350lux
environment.
Experiment 1: Scanning distance is 80cm, light
intensity is 300lux.
Fig. 12. Point cloud image and grayscale-scale graph.
Sweep 75cm; light intensity 350lux.
Experiment 6: Scanning distance 105cm, light
intensity 350lux.
Fig. 8. Point cloud image and gray scale distribution
graph. Distance is 80cm, light intensity is 300lux.
Experiment 2: Scanning distance is 100cm, light
intensity is 300lux.
Fig. 13. Point cloud image and grayscale-scale graph.
Distance 105cm, light intensity 350lux.
Experiment 7: Scanning distance of 90cm, intensity
of light a 280lux field.
Fig. 9. Point cloud image and grayscale-scale graph.
Distance is 100cm, light intensity is 300lux.
Experiment 3: Scanning distance 80cm, light intensity
400lux environment.
Fig. 14. Point cloud image and grayscale-scale graph.
Distance of 90cm, intensity of light a 280lux.
Experiment 8: Scanning distance 90cm, light intensity
420lux environment.
Fig. 10. Point cloud image and grayscale scale graph.
Distance 80cm, light intensity 400lux.
Experiment 4: Scanning distance 100cm, light
intensity 400lux environment.
Fig. 15. Point cloud image and grayscale-scale graph.
Distance 90cm, light intensity 420lux.
65
Journal of Science & Technology 143 (2020) 061-067
Y = 165.88 + 39.99X1 – 13.32X2 + 21.72X12 + 5.92X22
– 0.25X1X2 – 31.54X13 + 16.72X23. R2 = 0.999.
Correlation coefficient R2 = 0.999 shows a high
correlation between Y and two variables X1 and X2.
Experiment 9: Scanning distance 90cm, light intensity
350lux environment.
The results of ANOVA analysis on the effect of
weak substrates on the quality of body image scanning
of 3D human light structures are presented in Table 4.
From the results of ANOVA analysis on the
effect of weak substrate conditions on the 3D body
image scanning of the user light structure, we see that
[12]:
Figure 16. Point cloud image and grayscale-scale
graph. Distance 90cm, light intensity 350lux.
The values of "Prob> F" below 0.0500 show that
the elements X1, X2, X21, X22, X31, X32 have an
important influence on the Y function.
Experiment 10: Scanning distance 90cm, light
intensity 350lux environment.
The values of "Prob> F" greater than 0.1000
indicate that the interactions: X1.X2 have an effect but
little influence on the Y function.
The values of "Prob> F" equals 0 indicate the
interactions: X21. X2, X22. X1 do not completely
affect the Y function, so that the interaction pairs do
not exist in the empirical regression equation.
Fig. 17. Point cloud image and grayscale-scale graph.
Distance 90cm, light intensity 350lux.
DESIGN-EXPERT Plot
Table 4. Results of ANOVA analysis on the effect of
weak conditions on the 3D image quality of the user
body light scanned structural light
Y
X = A: X1
Y = B: X2
205.57
192.177
Total
SS
Block
Means
F
Value
178.783
165.389
df
Square
Prob > F
27.20
1
27.20
1210.49
Model
6100.87
7
871.55
1776.63
0.0221
A
1279.17
1
1279.17
197.05
0.0151
0.50
B
141.88
1
141.88
2622.09
0.0453
A: X1
Y
Source
151.996
1.00
A2
1887.90
1
1887.90
195.03
0.0124
B2
140.42
1
140.42
0.35
0.0455
AB
0.25
1
0.25
2762.74
0.6610
3
A
1989.17
1
1989.17
776.29
0.0121
B3
558.93
558.93
1
A2B
0.000
0
AB2
0.000
0
Error
0.72
1
Total
6128.80
9
-1.00
-0.50
0.00
0.00
-0.50
0.50
-1.00
B: X2
1.00
Fig. 18. 3D graphs on the relationship between
condition factors and image quality.
2.3.3. The results of determining the optimum
environmental conditions to ensure the best quality 3D
human body scan
0.0228
Design Expert software is used and constraints on
the value of the limited function Y in the gray value
range from 64 to 192. Because the two-variable
regression is a complex, nonlinear function of the
variable domain of Elements, there is not just only an
optimal one. To ensure the best scan quality, we in fact
have identified 10 optimal options corresponding
grayscale values of different scanned images which is
shown in Table 5.
0.72
Using Design Expert 6.0 software to process
experimental results and construct experimental
regression equation shows the simultaneous influence
of two environmental conditions on image quality of
3D human scan. Equation Y obtained after data
processing is a tertiary function:
Table 5. The value of the coded variable and the real
variable of the influencing factors and the optimal
value of the function Y
66
Journal of Science & Technology 143 (2020) 061-067
N
B
Y
1
2
3
4
5
6
7
8
9
10
174.5
178.3
157.7
154.8
185.3
187.5
161.1
164.7
161.2
171.6
X1
Encoding
variable
0.14
-0.97
-0.52
-0.29
0.31
0.49
-0.66
-0.22
-0.60
0.07
scanner that includes a projector, a camera, a turntable,
and a shaft for the camera and projector, it is possible
to scan any object that matches the standard
conditions.
X2
real
Encoding
real
variable variable variabl
(cm)
e (Lux)
91.4
80.3
84.8
87.1
93.1
94.9
83.4
87.8
84
90.7
-0.20
-0.16
0.82
0.19
-0.82
0.76
-0.23
-0.53
-0.89
-0.99
340
342
391
359.5
309
388
338.5
323.5
305.5
300.5
References
[1]
[2]
Reviews:
[3]
The process of empirical research shows:
The greater the scanning distance is, the wider the
scanning field is, the fewer sweeps are the more
accurate the imaging process is. But if the scanning
field is too large, the resulting image will be blurry and
likely to cause interference.
[4]
The greater the intensity of light, scanned images
get glare-prone, hard to see. In contrast the smaller the
light intensity, the darker the scanned images get. It is
also difficult to observe and evaluate image quality.
[5]
With the scanning equipment and the scanning
object are female students aged from 18 to 25, the
optimal values of two scan distance parameters and
corresponding intensity of light include:
[6]
The optimal scanning distance is from 83.4 to
94.9 cm.
[7]
Environmental light intensity in the range of
300.5 to pros to 388 Lux.
[8]
3. Conclusion
[9]
In this article, we point out that by controlling the
scan distance, ambient light intensity, background
color... The 3D scanning system works faster and more
accurately during 3D scanning. In fact, through the
empirical process, we find that there are problems
arising between theory and experiment. In some cases,
the experimental results differ from the optimal results
in the computational calculus. In this study, the results
between theoretical calculations and experimental
deviation is negligible. The parameters of the optimum
environmental conditions determined from the
experiment include: Distance scanning: 90 cm,
environmental light intensity: 350lux for 3D images.
Using these parameters to scan the human body
achieve the best quality. On the other hand, the results
of the empirical study show that black-light absorption
is much better than the blue backdrop. With a built-in
[10]
[11]
[12]
[13]
67
Nguyen Thi Nhung, Nguyen Thi Kim Cuc, Nguyen
Van Vinh, Phan Thanh Thao, Nguyen Thanh Hung,
Pham Xuan Khai; Design and manufacturing the
structural light 3D scanner for human body size
measurement; Proceedings of the national science
and technology conference on mechanical –
Transportation engineering (NSCMET 2016), 33-37
(10/2016).
Tong, J., Zhou, J., Liu, L., Pan, Z., & Yan, H. (n.d.).
Scanning 3D Full Human Bodies using Kinects, 4 18 (2012).
Voisin, S., Foufou, S., Truchetet, F., Page, D.,
&Abidi, M. (2017). Study of ambient light influence
for three- dimensional scanners based on structured
light, 1–3, 46(March 2007).
Koepke, J., Hu, X., Muenke, C., Schulten, K., &
Michel, H. (n.d.). The crystal structure of the lightharvesting complex II (B800 – 850) from
Rhodospirillummolischianum, 3, 581–597 (27 Mar
1996).
Nguyen Thi Ngoc Quyen; Research and application
of indirect measurement method and system
construction 2D body size male students serving the
garment industry Journal of Science and
Technology, No. 108 (2015).
Hilton, A, Beresford, D, Gentils, T, SmithR.J,
SunW. and IllingworthJ. Whole-body modelling of
people from multiview images to populate virtual
worlds. The Visual Computer (2000) 16:411 – 436,
Springer-Verlag (2000).
Repository, I.; Collection of anthropometry from
older and physically impaired persons: traditional
methods versus TC2 3-D body scanner (2012).
Impact of Scanning Surfaces on Underwater Laser
Scanners. 2G Robotics (2013).
Dragan, D., Mihic, S., Anisic, Z., &Lukovic, I.; Role
of Background Subtraction in Creating Human Body
Point Clouds from Photographs, (October), 27–28
(2015).
Nguyen Thanh Hai; Image processing; National
University Publishing House. Ho Chi Minh City
(2016).
Zaimovic-uzunovic, N., & Lemes, S; Influences of
surface parameters on laser 3D scaning, 9-12,
(2010).
w. org/wiki/Structured_light., https://en. wikipedia.
org/wiki/Structured_light.
Bui Minh Tri; Mathematical planning; S & T
publishing house; Hanoi (2001).