Effect of confining pressure on shear resistance of ultra-high-performance fiber reinforced concrete
Bạn đang xem bản rút gọn của tài liệu. Xem và tải ngay bản đầy đủ của tài liệu tại đây (3.01 MB, 8 trang )
Journal of Science and Technology in Civil Engineering NUCE 2020. 14 (2): 108–115
EFFECT OF CONFINING PRESSURE ON SHEAR
RESISTANCE OF ULTRA-HIGH-PERFORMANCE FIBER
REINFORCED CONCRETE
Ngo Tri Thuonga,∗
a
Department of Civil Engineering, Thuyloi University, 175 Tay Son street, Dong Da district, Hanoi, Vietnam
Article history:
Received 08/03/2020, Revised 27/03/2020, Accepted 31/03/2020
Abstract
Effect of confining pressure on the shear resistance of ultra-high-performance fiber-reinforced concrete (UHPFRCs), containing 1.5% volume content (1.5 vol.-%) of short smooth steel fiber (SS, l = 13, d = 0.2 mm) and
long smooth steel fiber (LS, l = 30, d = 0.3 mm), was investigated using a new shear test method. Three levels
of confining pressure were generated and maintained to the longitudinal axis of the specimen prior shear loading was applied. The test results exhibited that the shear strength of UHPFRCs was obviously sensitive to the
confining pressure: the higher confining pressure produced higher shear strength. UHPFRC reinforced with 1.5
vol.-% long smooth steel fiber exhibited higher shear resistance than those reinforced with short smooth steel
fiber, regardless of confining pressure levels. The confined shear strength could be expressed as an empirical
function of unconfined shear strength, confining pressure, and tensile strength of UHPFRCs.
Keywords: UHPFRCs, shear resistance; confining pressure effect; smooth fiber.
/>
c 2020 National University of Civil Engineering
1. Introduction
Ultra-high-performance fiber reinforced concrete (UHPFRCs) has been exhibited very high compressive strength, tensile strength, shear strength, strain capacity, and energy absorption capacity [1–
8]. It is, therefore, expected to apply widely into the civil infrastructures to enhance their shear resistance subjected to extreme loads, such as impact and blast loads [3–6, 8, 9]. However, the application
of UHPFRCs to civil infrastructures is still very limited owing to its complex characters, such as fiber
reinforcement parameter dependence as well as confining pressure dependence.
Several methods have been applied to investigate the confining pressure shear dependence of normal concrete (NC) as well as fiber reinforced concrete (FRC) including push-off specimens [10–13],
punch-through specimens (PTS) [14–17], and Iosipescu specimens [18, 19]). However, these methods cannot indicate the unique strain-hardening response (accompanied by the formation of multiple
microcracks) of UHPFRCs under tension, owing to using the pre-crack on the specimen to govern
the shear crack path. Ngo et al. [2] have proposed a new shear test method to investigate the shear
resistance of UHPFRCs capable of measuring the shear-related hardening response of UHPFRCs,
accompanied with multiple microcracks. This method, later, has developed by Ngo et al. [4] to investigate the confining shear dependence of UHPFRCs. However, they have just investigated with 1.5
vol.-% of medium smooth steel fiber (MS, l/d = 19/0.2).
∗
Corresponding author. E-mail address: (Thuong, N. T.)
108
UHPFRCs. However, they have just investigated with 1.5 vol.-% of medium smooth
steel fiber (MS, l/d=19/0.2).
This study aims to investigate the effect of confining pressure on the shear
resistance of UHPFRCs reinforced with different types of fiber: 1.5 vol.-% of the
Thuong, N. T. / Journal of Science and Technology in Civil Engineering
short smooth (SS, l/d=13/0.2) fiber and the long smooth (LS, l/d=30/0.3) were
Thisinvestigated.
study aims to investigate the effect of confining pressure on the shear resistance of UHPFRCs
reinforced with different types of fiber: 1.5 vol.-% of the short smooth (SS, l/d = 13/0.2) fiber and
the long smooth (LS, l/d = 30/0.3) were investigated.
2. Experimental program
2. Experimental
Fig. 1program
shows an experimental program designed for investigating the effect of
pressure
on the shear
resistance
of for
UHPFRCs:
six series
of specimens
werepressure
Fig.confining
1 shows an
experimental
program
designed
investigating
the effect
of confining
cast
and
tested.
In
the
notation
of
the
series,
the
two
first
letters
designate
the
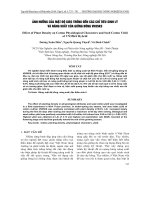
on the shear resistance of UHPFRCs: six series of specimens were cast and tested. In thefiber
notation of
types
for letters
short smooth
fiber
“LS”
for(“SS”
long smooth
while
theand
next
twofor long
the series,
the(“SS”
two first
designate
theand
fiber
types
for shortfiber)
smooth
fiber
“LS”
smooth characters
fiber) whilerepresent
the next two
confining
for 2.0 MPa
the characters
confining represent
pressure the
level
(“02” pressure
for 2.0 level
MPa (“02”
confining
confining
pressure).
pressure).
Fiber types
Confining pressure
Short smooth
fiber
Shear resistance
of UHPFRCs
0 MPa
02 MPa
Long smooth
fiber
04 MPa
(2)
(1)
Notation
SS-00
SS-02
SS-04
LS-00
LS-02
LS-04
Effect of fiber types
Effect of confining pressure on shear resistance
Figure
Experimentalprogram
program
Fig. 1.1.Experimental
.
2.1. Material and specimen preparation
2.1. MaterialThe
andcomposition
specimen preparation
and compressive strength of ultra-high-performance concrete
(UHPC)
matrix
are
provided
in Table
1, while
the properties of smooth
steel fibers
are matrix
The composition and compressive
strength
of ultra-high-performance
concrete
(UHPC)
are provided in Table 1, while the properties of smooth steel fibers are listed in Table 2. The detail
of mixing and curing procedure could be found in2[2, 20]. A Hobart 20-L capacity type mixer with a
controllable rotation speed was used to mix the UHPC mixture. Silica fume and silica sand were first
dry-mix for 5 min before silica powder and cement (Type I) was added and mix about 5 min more.
Water and superplasticizer were then gradually added as the dry compositions show well-distribution.
After the mortar showed suitable workability and viscosity, the fiber distributed by hand and mixed
about 2 min for uniform fiber distribution.
Table 1. The composition of UHPC matrix by weight ratio
Cement
(Type I)
Silica fume
Silica sand
Silica powder
Super-plasticizer
Water
Compressive
strength
1
0.25
1.10
0.30
0.067
0.2
180 MPa
The mixture was poured into molds with no vibration and stored in room temperature for 48 hours
before demolding and curing in water at 90 ± 2◦C for 3 days. All specimens were tested at the age of
28 days.
109
Thuong, N. T. / Journal of Science and Technology in Civil Engineering
Table 2. Properties of smooth steel fibers
Fiber types,
1.5 vol.-%
Diameter,
d f (mm)
Length,
l f (mm)
Density,
ρ (g/cc)
Tensile strength,
σu (MPa)
Elastic modulus,
E (GPa)
Short smooth
steel fiber - SS
0.2
13
7.90
2580
200
Long smooth
steel fiber - LS
0.3
30
7.90
2580
200
2.2. Test setup and procedure
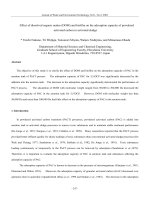
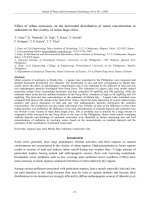
Fig. 2 shows the shear test setup with a confining pressure frame. A high strength aluminum frame
was designed to apply and maintain a compressive load along the longitudinal axis of the specimen.
The shear specimen was placed into the confining pressure frame and the rotating screw at the end
of the frame wasJournal
tightened
to generate
theincompressive
in2019
the longitudinal
axis of the specimen.
of Science
and Technology
Civil Engineeringload
NUCE
ISSN 1859-2996
The pre-stressed level was measured by an indicator system and a load cell installing coaxial with the
longitudinal axis
the the
specimen.
Three
2, and 4 MPa)
pre-stressed
cell of
inside
UTM, while
the levels
vertical(0,
displacement
of the of
middle
region of were
the used in this
study. Details specimen
of the test
methods
and
testing
procedures
can
be
found
elsewhere
[21].
was measured by two linear variable displacement transducers (LDVTs).
Rotation
screw
Load cell
Specimen
Confining frame
LDVTs
Supporting
blocks
Load cell
indicator
Fig. 2. Shear test setup with confining frame
Figure
2. Shear test setup with confining frame
3. Results
The shear testFig.
setup
was the
installed
in a universal curves
testingofmachine
shear load was
3 shows
shear stress-versus-strain
UHPFRCs.(UTM).
The shearThe
stress
applied to the (t)
specimen
by
upwards
movement
of
the
lower
element
of
the
UTM
at
a
was calculated using Eq. (1), while shear strain (g) was calculated using Eq. (2) constant speed
of 1 mm/min. The applied load was measured by a load cell inside the UTM, while the vertical
P
t =region of the specimen was measured by two linear variable displacement
displacement of the middle
2bd
(1)
transducers (LDVTs).
g=
3. Results
d
a
(2)
Where b is the specimen width (mm), P is the applied load (kN), d is the depth of
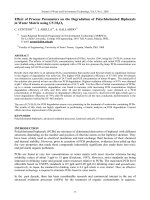
Fig. 3 shows
the shear stress-versus-strain curves of UHPFRCs. The shear stress (τ) was calculated
the specimen (mm), a is shear span (mm) and d is the vertical displacement in the
using Eq. (1), middle
while shear
strain (γ) was calculated using Eq. (2):
part of the specimen.t is the peak value of the shear stress-versus-strain
max
Pthe area under shear stress-versus-strain
curve; gmax is the shear strain at tmax; and Tsp is
τ=
curve up to tmax. The tmax, gmax, and Tsp were2bd
averaged and summarized in Table 3.
110
As can be seen in Figs. 3a and 3b, all
specimens featured shear-related hardening
responses at shear strengths >18 MPa, although their shear resistances differed
according to the confining pressure (sl) level. Higher sl levels produced higher tmax
and gmax in the UHPFRCs. Specifically, the UHPFRCs reinforced with 1.5 vol.-% of
(1)
Thuong, N. T. / Journal of Science and Technology in Civil Engineering
δ
(2)
a
where b is the specimen width (mm), P is the applied load (kN), d is the depth of the specimen (mm),
a is shear span (mm) and δ is the vertical displacement in the middle part of the specimen. τmax is
the peak value of the shear stress-versus-strain curve; γmax is the shear strain at τmax and Tsp is the
area under shear stress-versus-strain curve up to τmax . The τmax , γmax , and T sp were averaged and
summarized in Table 3.
γ=
Table 3. Test results
Confining pressure,
σl (MPa)
Shear strength,
τmax (MPa)
Shear strain at peak
stress, γmax (%)
Shear peak
toughness, T sp (MPa)
SP1
SP2
SP3
SP4
SP5
SP6
Average
Standard deviation
0
0
0
0
0
0
0
18.30
18.88
17.88
18.13
17.78
17.88
18.10
0.4
0.054
0.046
0.055
0.054
0.049
0.055
0.052
0.004
0.75
0.67
0.66
0.81
0.70
0.80
0.73
0.07
02-SS
SP1
SP2
SP3
SP4
SP5
Average
Standard deviation
2
2
2
2
2
2
23.87
25.93
24.34
24.85
25.52
24.90
0.8
0.053
0.057
0.053
0.052
0.058
0.055
0.003
1.07
1.17
1.04
1.03
1.18
1.10
0.07
04-SS
SP1
SP2
SP3
SP4
SP5
Average
Standard deviation
4
4
4
4
4
4
31.94
30.45
32.80
31.09
29.80
31.20
1.2
0.054
0.064
0.061
0.060
0.067
0.061
0.005
1.44
1.61
1.60
1.53
1.59
1.55
0.07
00-LS
SP1
SP2
SP3
SP4
SP5
SP6
Average
Standard deviation
0
0
0
0
0
0
0
22.19
24.25
23.22
24.25
23.58
22.23
23.30
0.9
0.067
0.065
0.061
0.068
0.062
0.070
0.066
0.004
1.06
1.09
0.98
1.19
1.01
1.17
1.08
0.08
02-LS
SP1
SP2
SP3
SP4
SP5
SP6
Average
Standard deviation
2
2
2
2
2
2
2
31.84
33.76
31.42
33.06
32.50
31.96
32.42
0.9
0.072
0.071
0.064
0.094
0.066
0.061
0.071
0.012
1.54
1.23
1.36
1.05
0.91
1.29
1.23
0.22
04-LS
SP1
SP2
SP3
SP4
SP5
SP6
Average
Standard deviation
4
4
4
4
4
4
4
36.20
37.00
35.72
38.75
37.27
37.35
37.00
1.1
0.088
0.091
0.105
0.059
0.085
0.080
0.085
0.015
2.35
2.31
1.20
1.42
1.27
1.99
1.76
0.52
Test series
Spec.
00-SS
111
Journal of Science and Technology in Civil Engineering NUCE 2019
ISSN 1859-2996
Journal
of Science
and
Technology
in
Engineering
NUCE
2019
ISSN
1859-2996
Thuong,
N. T.shear
/ Journal
of Civil
Science
and Technology
in2019
Civil
Engineering
Journal
ofwith
Science
and
Technology
in Civil
Engineering
NUCE
ISSN
1859-2996
accompanied
two
major
cracks.
The typical failure of UHPFRC specimen is shown in Fig. 3(c): all specimens failed with multiple
cracks on the front and back sides of the40specimen, accompanied with two major shear
40 flexural-shear
accompanied
with
two
major
shear
cracks.
accompanied
with
two
major
shear
cracks.
cracks.
LS-0 MPa
SS-0 MPa
40 40
30
MPa
SS-0SS-0
MPa
SS-4
MPa
SS-2SS-2
MPaMPa
30 30
SS-4SS-4
MPaMPa
20
LS-2 MPa
LS-4 MPa
LS-0LS-0
MPaMPa
LS-2LS-2
MPaMPa
LS-4LS-4
MPaMPa
30 30
20
20 20
20 20
10
10
10 10
0
30
Shear stress (MPa)
Shear
Shear
stressstress
(MPa)(MPa)
SS-2 MPa
Shear stress (MPa)
Shear stress (MPa)
Shear stress (MPa)
40 40
10 10
0 0 0
0.05
0.1
0
0.05to peak 0.1
0.1 g
0 Shear
0.05
strain
up
stress,
0.15
Shear
strain
to peak
stress,
Shear
strain
up up
to peak
stress,
g g
0
0 00
0.150.15
0 0
UHPFRC
withwith
1.5 vol.%
SS SSSS
a) UHPFRC
with
1.5
vol.%
a)
UHPFRC
vol.%
a) (a)
UHPFRC
with
1.51.5
vol.%
SS
0.05
0.1
0.15
0.1 stress,0.15
0.050.05
0.1peak
Shear
strain up to
g 0.15
Shear
strain
uppeak
to peak
stress,
Shear
strain
up to
stress,
g g
(b) UHPFRC
with
1.5
vol.%
UHPFRC
with
1.5
vol.%
b) UHPFRC
with
1.5
vol.%
LS LS
b) b)
UHPFRC
with
1.5
vol.%
LSLS
LS-00
LS-00
LS-00
LS-00LS-00
LS-00
c) Failure
of shear
specimens
(front
back
side)
c) Failure
of shear
specimens
(front
andand
back
side)
(c) of
Failure
of shear
specimens (front
and back
c) Failure
shear
specimens
(front
andside)
back side)
Fig.
3. Shear
stress-versus-strain
curves
of UHPFRCs
at different
confining
pressure
Fig.
3. Shear
stress-versus-strain
curves
of UHPFRCs
at different
confining
pressure
Figure
3. Shear stress-versus-strain
curvesofofUHPFRCs
UHPFRCs at different
confining
pressure pressure
Fig. 3. Shear
stress-versus-strain
curves
at different
confining
Discussions
Discussions
3.4.3.
Discussions
3. Discussions
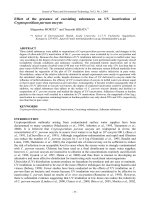
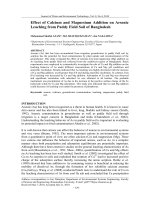
Fig.
4Fig.
expressed
the effects
of
confining
pressure
on the
shear resistance
of
UHPFRCs.
The shear
4 expressed
effects
confining
pressure
shear
resistance
Fig.
4 expressed
thethe
effects
of of
confining
pressure
on on
thethe
shear
resistance
of of
strength and shear strain capacity were strongly dependent on the confining pressure level. The τmax
The
shear
strength
strain
capacity
were
strongly
dependent
on of
UHPFRCs.
The
shear
strength
andand
shear
strain
capacity
strongly
dependent
Fig.
4 expressed
the
effects
ofshear
confining
pressure
the
resistance
ofUHPFRCs.
UHPFRC
reinforced
with
1.5
vol.-%
SS
fiber
increased
from were
18.1
toon
24.9
andshear
31.2
MPa
ason
the
the
confining
pressure
level.
The
tmax
of
UHPFRC
reinforced
with
1.5
vol.-%
SS
fiber
the
confining
pressure
level.
The
of
UHPFRC
reinforced
with
1.5
vol.-%
SS
fiber
confining
pressure
(σl ) strength
increased
from
0 tto
2 and
4strain
MPa, while
those ofwere
UHPFRC
reinforced
with
1.5
max
UHPFRCs.
The
shear
and
shear
capacity
strongly
dependent
on
vol.-%
LS
fiber
are
23.3,
32.4
and
37.0
MPa.
The
results
were
well-matched
with
previous
experimenincreased
from
18.1
andand
31.2
MPa
as as
thethe
confining
pressure
(sl()sincreased
increased
from
18.1to to24.9
24.9
31.2
MPa
confining
pressure
)
increased
l
the confining
pressure
level.
Theshear
tmaxstrain
of UHPFRC
reinforced
with
1.5 vol.-%
SS fiber
tal results reported
by [4,
22]. The
capacity slightly
increased as
the confining
pressure
from
0
to
2
and
4
MPa,
while
those
of
UHPFRC
reinforced
with
1.5
vol.-%
LS
fiber
from
0
to
2
and
4
MPa,
while
those
of
UHPFRC
reinforced
with
1.5
vol.-%
LS
fiber
increased. The γmax of UHPFRC containing 1.5 vol.-% SS fiber increased from 0.052 to 0.055 and
increased
from
18.1
to 24.9
and
31.2
MPa
as2.0
the
confining
pressure
(sprevious
l) increased
are
andand37.0
The
results
with
previous
are23.3,
23.3,32.4
37.0MPa.
MPa.
Thefrom
results
were
with
0.061
when
the32.4
confining
pressure
increased
0 to were
andwell-matched
4.0well-matched
MPa, while those
values
of LS
fromexperimental
0fiber
towere
2 and
4 results
MPa,
while
those
of The
UHPFRC
reinforced
with
1.5
vol.-%
LSasfiber
0.066,
0.071,
and
0.085.
Consequently,
Tshear
alsostrain
increased
as confining
pressure
increased
spshear
results
reported
by
[4,22].
capacity
slightly
increased
as
experimental
reported
by
[4,22].
The
strain
capacity
slightly
increased
owing to the increase of τmax and γmax , as shown in Fig. 4(c).
are the
23.3,
32.4 pressure
and
37.0
MPa.TheThe
The
results
were
well-matched
with
previous
confining
increased.
gmaxgmax
of
UHPFRC
containing
1.5 vol.-%
SS fiber
the
confining
pressure
increased.
of
UHPFRC
containing
vol.-%
fiber
Among
the investigated
fiber reinforcement,
the
UHPFRC reinforced
with1.5
higher
fiberSS
aspect
increased
0.052
to to
0.055
and[4,22].
0.061
the
confining
pressure
increased
from
0 0 as
increased
from
0.052
0.055
and
0.061
when
the
confining
pressure
increased
from
experimental
results
reported
by
The
shear
strain
slightly
increased
ratio
(l/d) from
produced
higher
shear
resistance
in when
terms
of
shear
strength,capacity
shear
strain
capacity,
and
shear
peak
toughness,
regardless
the
confining
pressure
level,
as
can
be
seen
in
Fig.
4.
The
shear
resistance
to to
2.02.0
andand
4.04.0
MPa,
while
those
values
LS
fiber
were
0.066,
0.071,
0.085.
MPa,
while
those
values
LS
fiber
were
0.066,
0.071,
and
0.085.
the confining
pressure
increased.
The
gmaxofofof
UHPFRC
containing
1.5and
vol.-%
SS fiber
of UHPFRC reinforced with the long smooth steel fiber (LS, l/d = 30/0.3 = 100) are higher than
Consequently,
TspTalso
increased
as
confining
pressure
increased
owing
to
the
increase
Consequently,
also
increased
as
confining
pressure
increased
owing
to
the
increase
increased from 0.052spto 0.055 and 0.061 when the confining pressure increased from 0
of of
tmax
andand
gmaxgmax
, as, as
shown
in in
Fig.
4c.4c.
tmax
shown
Fig.
112
to 2.0 and 4.0 MPa, while those values of LS fiber were 0.066, 0.071, and 0.085.
Among
fiber
reinforcement,
thethe
UHPFRC
reinforced
with
Among
theinvestigated
investigated
fiber
reinforcement,
UHPFRC
reinforced
with
Consequently,
Tsp the
also
increased
as
confining
pressure
increased
owing
to the
increase
higher
(l/d)
produced
higher
shear
resistance
in in
terms
of of
shear
higherfiber
fiberaspect
aspectratio
ratio
(l/d)
produced
higher
shear
resistance
terms
shear
of tmax and gmax, as shown in Fig. 4c.
S
S
with the long smooth steel fiber (LS, l/d=30/0.3 = 100) are higher than those of short
with the long smooth steel fiber (LS, l/d=30/0.3 = 100) are higher20than those of short
smooth steel fiber (SS, l/d=13/0.2= 65), while those of medium smooth steel fiber
smooth steel fiber (SS, l/d=13/0.2= 65), while those of medium smooth steel fiber
(MS,
l/d=19/0.2 = 95) were in the middle according to Ngo et al.[23].A similar
trend
(MS, l/d=19/0.2 = 95) were in the middle according to Ngo et al.[23].A
similar trend
15
waswas
experimentally
by
Tran
et
al.
[5]
for
tensile
resistance
and
agree
with
-1
0
1 the
3
4
experimentally by Tran et al. [5] for tensile resistance and agree with
the2
Confining
pressure (MPa)
theoretical
equation
proposed
by
Wille
et
al.
[24]:
the
resistance
of
UHPFRC
is
theoretical equation proposed by Wille et al. [24]: the resistance of UHPFRC is
Thuong,
N.
T. / Journal
of Science and Technology in Civil Engineering
proportional
to the
aspect
ratio
(l/d)
of of
fiber
reinforcement.
proportional
to the
aspect
ratio
(l/d)
fiber
reinforcement.
a) Shear strength
0.10.1
SS SS
30 30
0.09
0.09
0.08
0.08
25 25
20 20
15 15
-1 -1 0
0 1 1 2 2 3 3 4
Confining
pressure
(MPa)
Confining
pressure
(MPa)
(a)a)Shear
strength
a) Shear
strength
Shear
strength
0.05
-1
0
1
2
3
4
Confining pressure (MPa)
b) Shear strain capacity
SSSS
LSLS
Journal of Science
and Technology in Civil Engineering
SS
LS NUCE 2019
Shear strain capacity
Shear strain capacity
Shear strength (MPa)
Shear strength (MPa)
35 35
LS LS
5
2
Shear peak toughness (MPa)
40 40
0.06
ISSN 1
1.5
experimental results [4]. The shear failure in this study was governed
0.07
tensile
failure along the shear plane, which was demonstrated by both the
0.07
1
experimental analysis results [21]. Therefore, the confined shear strength
0.06
0.06
proposed as a function of tensile strength (st) and confining pressure (sl)
0.5
0.05
0.05
and
5.
-1in Fig.
0
1
2
3
4
5
4 and
-1 0their
0
1
5 5 (4) -1
1 relationship
22
33
4 4is plotted
55
Confining pressure (MPa)
Confining
pressure
(MPa)
Confining
pressure
(MPa)
tShear
=strain
t max
+ 1.863 s ls t
(b)b)Shear
strain
capacity
b)
Shear
capacity
conf
strain
capacity
(c)c)Shear
peaktoughness
toughness
Shear peak
Fig. 4. Effect of confining pressure on the shear resistance of UHPFRCs
2 2
Shear peak toughness (MPa)
Shear peak toughness (MPa)
Figure 4. Effect
confining
pressure
shear
resistance
of confining
UHPFRCs
LS
t conf =ont the
+ 1relation
.951
sbetween
SS SS of LS
maxThe
ls t
shear strength of UHPFRCs and co
pressure level of can be expressed by an empirical formulation based
In which
tmax
is the=unconfined
sl issteel
confining pre
those of short smooth steel fiber (SS,
l/d ,=
13/0.2
65), while shear
those strength,
of mediumMPa;
smooth
7
st (=
10.90
in Eq.
(3)and
11.10toMPa
(4)) are
the post-cracking
tens
fiber (MS, l/d = 19/0.2 = 95)
were
in the
middle
according
NgoinetEq.
al. [23].
A similar
trend
was experimentally by Tran etofal.UHPFRC
[5] for tensile
resistance
with
equation
reinforced
withand
1.5agree
vol.-%
thethe
SStheoretical
and LS fiber,
respectively, a
1
proposed by Wille et1 al. [24]: the resistance of UHPFRC is proportional to the aspect ratio (l/d) of
Tran et al. [5].
fiber reinforcement.
40
The relation between
confining shear strength
0.5
0.5 -1
0
1
2
3
4
5
t conf = t max + 1 . 863 s l s t
of UHPFRCs and confining
-1
0 pressure
1
2 level
3 can
4 be5
Confining pressure (MPa)
Confining pressure (MPa)
35 R 2 = 0 . 934
expressed by an empirical formulation
based on
c)
Shear
peak
toughness
the experimental results c)[4].
The
failure in
Shear
peakshear
toughness
Fig.
4.
Effect
of
confining
pressure
on
the
shear
resistance of UHPFRCs
this study
governed
by pressure
diagonal
tensile
failure
30
Fig.was
4. Effect
of confining
on the
shear resistance
of UHPFRCs
Theshear
relation
between
confining
shear strength ofby
UHPFRCs and confining
alongThe
the
plane,
which
was
demonstrated
relation between confining shear strength of UHPFRCs and confining
pressure
level of and
can experimental
be expressed byanalysis
an empirical
formulation based
the
both
theoretical
results
25 onon the
pressure
level of can
be expressed by an
empirical
formulation based
[21]. Therefore, the confined shear strength (τcon f )
7
7
was proposed as a function of tensile
strength (σt )
20
and confining pressure (σl ) by Eqs. (3) and (4) and
t conf = t max + 1 . 951 s l s t
their relationship is plotted in Fig. 5.
15
R 2 = 0 . 978
√
τcon f = τmax + 1.863 σl σt
(3)
10
√
0
2
4
6
8
τcon f = τmax + 1.951 σl σt
(4)
0.5
Confined shear strength (MPa)
1.5 1.5
(s s )
t l
(MPa)
where τmax is the unconfined shear strength, MPa;
σl is confining pressure, MPa; σt (=
in
Figure 5.equation
Proposedfor
prediction
equation
for
Fig.10.90
5. Proposed
prediction
confined
shear strengths
of UHPF
confined shear strengths of UHPFRCs
Eq. (3) and 11.10 MPa in Eq. (4)) are the postcracking tensile strength of UHPFRC reinforced
with 1.5 vol.-% the SS and LS4.Conclusions
fiber, respectively,
according to Tran et al. [5].
The effects of confining pressure on the shear resistance of UH
investigated using a new shear test method. The following observ
5. Conclusions
conclusions can be drawn from this study:
The effects of confining pressure on the shear resistance of UHPFRC were investigated using a
new shear test method. The following
observations
and conclusions
can be drawn
this study:
• The
shear strength
of UHPFRC
was from
strongly
dependent on th
pressure level:
113 the confined shear strength increased as the applie
pressure increased.
• UHPFRC reinforced with 1.5 vol.-% long smooth steel fiber exhib
shear resistance than those reinforced with short smooth steel fiber
Thuong, N. T. / Journal of Science and Technology in Civil Engineering
- The shear strength of UHPFRC was strongly dependent on the confining pressure level: the
confined shear strength increased as the applied confining pressure increased.
- UHPFRC reinforced with 1.5 vol.-% long smooth steel fiber exhibited higher shear resistance
than those reinforced with short smooth steel fiber, regardless of confining pressure levels.
- The confining shear strength could be predicted base on the unconfined shear strength, confining
strength, and tensile strength by an empirical in this study.
Acknowledgements
This research is funded by Vietnam National Foundation for Science and Technology Development (NAFOSTED) under grant number 107.01-2019.03.
References
[1] Wille, K., Naaman, A. E., Parra-Montesinos, G. J. (2011). Ultra-High Performance Concrete with Compressive Strength Exceeding 150 MPa (22 ksi): A Simpler Way. ACI Materials Journal, 108(1).
[2] Ngo, T. T., Park, J. K., Pyo, S., Kim, D. J. (2017). Shear resistance of ultra-high-performance fiberreinforced concrete. Construction and Building Materials, 151:246–257.
[3] Ngo, T. T., Kim, D. J. (2018). Shear stress versus strain responses of ultra-high-performance fiberreinforced concretes at high strain rates. International Journal of Impact Engineering, 111:187–198.
[4] Ngo, T. T., Kim, D. J., Moon, J. H., Kim, S. W. (2018). Strain rate-dependent shear failure surfaces of
ultra-high-performance fiber-reinforced concretes. Construction and Building Materials, 171:901–912.
[5] Tran, N. T., Tran, T. K., Kim, D. J. (2015). High rate response of ultra-high-performance fiber-reinforced
concretes under direct tension. Cement and Concrete Research, 69:72–87.
[6] Hoan, P. T., Thuong, N. T. (2019). Shear resistance of ultra-high-performance concrete reinforced with
hybrid steel fiber subjected to impact loading. Journal of Science and Technology in Civil Engineering
(STCE)-NUCE, 13(1):12–20.
[7] Thang, N. C., Thang, N. T., Hanh, P. H., Tuan, N. V., Thanh, L. T., Lam, N. T. (2013). Research and
manufacture of ultra-high-performancez concrete using silica fume and fine granulated blast furnace slag
in Vietnam. Journal of Science and Technology in Civil Engineering (STCE)-NUCE, 7(1):83–92. (in
Vietnamese).
[8] Danh, L. B., Hoa, P. D., Thang, N. C., Linh, D. D., Dung, B. T. T., Loc, B. T., Dat, D. V. Experimental
research on the impact load ability of ultra-high performance concrete materials (UHPC). Journal of
Science and Technology in Civil Engineering (STCE)-NUCE, 13(3V):12–21. (in Vietnamese).
[9] Ngo, T. T., Kim, D. J. (2018). Shear stress versus strain responses of ultra-high-performance fiberreinforced concretes at high strain rates. International Journal of Impact Engineering, 111:187–198.
[10] Mattock, A. H., Hawkins, N. M. (1972). Shear transfer in reinforced concrete—Recent research. PCI
Journal, 17(2):55–75.
[11] Valle, M., Buyukozturk, O. (1993). Behavior of fiber reinforced high-strength concrete under direct shear.
ACI Materials Journal, 90(2):122–133.
[12] Barragan, B., Gettu, R., Agullo, L., Zerbino, R. (2006). Shear failure of steel fiber-reinforced concrete
based on push-off tests. ACI Materials Journal, 103(4):251.
[13] Millard, S. G., Molyneaux, T. C. K., Barnett, S. J., Gao, X. (2010). Dynamic enhancement of blastresistant ultra high performance fibre-reinforced concrete under flexural and shear loading. International
Journal of Impact Engineering, 37(4):405–413.
[14] JSCE-SF6 (1990). Method of test for shear strength of steel fiber reinforced concrete. Japan Society of
Civil Engineers, 67–69.
[15] Rao, G. A., Rao, A. S. (2009). Toughness indices of steel fiber reinforced concrete under mode II loading.
Materials and structures, 42(9):1173–1184.
114
Thuong, N. T. / Journal of Science and Technology in Civil Engineering
[16] Boulekbache, B., Hamrat, M., Chemrouk, M., Amziane, S. (2012). Influence of yield stress and compressive strength on direct shear behaviour of steel fibre-reinforced concrete. Construction and Building
Materials, 27(1):6–14.
[17] Banthia, N., Majdzadeh, F., Wu, J., Bindiganavile, V. (2014). Fiber synergy in Hybrid Fiber Reinforced
Concrete (HyFRC) in flexure and direct shear. Cement and Concrete Composites, 48:91–97.
[18] van Zijl, G. P. A. G. (2007). Improved mechanical performance: Shear behaviour of strain-hardening
cement-based composites (SHCC). Cement and Concrete Research, 37(8):1241–1247.
[19] Li, V. C., Mishra, D. K., Naaman, A. E., Wight, J. K., LaFave, J. M., Wu, H.-C., Inada, Y. (1994). On
the shear behavior of engineered cementitious composites. Advanced Cement Based Materials, 1(3):
142–149.
[20] Park, J. J., Kang, S. T., Koh, K. T., Kim, S. W. (2008). Influence of the ingredients on the compressive
strength of UHPC as a fundamental study to optimize the mixing proportion. In Proceedings of the Second
International Symposium on Ultra High Performance Concrete, 105–112.
[21] Ngo, T. T., Park, J. K., Pyo, S., Kim, D. J. (2017). Shear resistance of ultra-high-performance fiberreinforced concrete. Construction and Building Materials, 151:246–257.
[22] Luki´c, B., Forquin, P. (2016). Experimental characterization of the punch through shear strength of an
ultra-high performance concrete. International Journal of Impact Engineering, 91:34–45.
[23] Ngo, T. T., Kim, D. J. (2018). Synergy in shear response of ultra-high-performance hybrid-fiberreinforced concrete at high strain rates. Composite Structures, 195:276–287.
[24] Wille, K., El-Tawil, S., Naaman, A. E. (2014). Properties of strain hardening ultra high performance
fiber reinforced concrete (UHP-FRC) under direct tensile loading. Cement and Concrete Composites, 48:
53–66.
115